

Abstract
Paclitaxel (PTX) is a gold standard chemotherapeutic agent for breast, ovarian, pancreatic and non-small cell lung carcinoma. However, in clinical use PTX can have adverse side effects or inadequate pharmacodynamic parameters, limiting its use. Nanotechnology is often employed to reduce the therapeutic dosage required for effective therapy, while also minimizing the systemic side effects of chemotherapy drugs. However, there is no nano formulation of paclitaxel with chemosensitization motifs built in. With this objective, we screened eleven pharmaceutical excipients to develop an alternative paclitaxel nanoformulation using a self-assembly method. Based on the screening results, we observed tannic acid possesses unique properties to produce a paclitaxel nanoformulation, i.e., tannic acid-paclitaxel (TAP). This stable TAP nanoformulation, referred to as TAP nanoparticles (TAP NPs), showed a spherical shape of 102.22±14.05 nm and negative zeta potential of −8.85±0.44 mV. The presence of PTX in TAP NPs was confirmed by Fourier Transform Infrared (FTIR) spectra, thermogravimetric analyzer (TGA) scans, and X-ray diffraction (XRD). Encapsulation efficiency of PTX in TAP NPs was determined to be > 96.49±0.43 %. Intracellular drug uptake of plain drug PTX on breast cancer cells (MDA-MB-231) shows more or less constant drug concentration from 2–6 hours, suggesting drug efflux by the P-gp transporters, over TAP NPs, in which PTX uptake was more than 95.52+11.01% in 6 hours, as analyzed by liquid chromatography-tandem mass spectrometry (LC-MS/MS). Various biological assays such as proliferation, clonogenic formation, invasion, and migration confirm superior anticancer effects of TAP NPs over plain PTX at all tested concentrations. P-gp expression Rhodamine-123 (RH123), beta-tubulin stabilization, Western blot, and microarray analysis further confirm the improved therapeutic potential of TAP NPs. These results suggest that the TAP nanoformulation provides an important reference for developing a therapeutic nanoformulation affording pronounced, enhanced effects in breast cancer therapy.
Keywords: Nanoparticles, drug delivery, breast cancer, paclitaxel, nanomedicine, tannic acid, cancer therapeutics
1. Introduction
Breast cancer (BC) is one of the most commonly diagnosed cancers in American women in the United States [1]. Currently, 1 in 8 women (about 12%) may develop BC in their lifetime. American Cancer Society 2018 statistics projected that about 266,120 new BC diagnoses and 40,920 deaths will occur due to this disease [1]. Apart from hormonal therapy, chemotherapy is the most effective treatment for BC. Historically, the importance of taxane drugs in BC is well established. Paclitaxel (PTX) is a taxane derived from the bark of Taxus brevifolia, first isolated and structure elucidated in 1971 [2]. It’s first generation pharmaceutical formulation (Taxol®) is well known for improving the overall survival rate and progression-free survival of patients [3, 4]. It was approved for the treatment of various cancers including breast cancer. Despite the therapeutic benefits, the presence of Cremophor EL and ethanol in this formulation exerts serious adverse effects.
Various nanomedicine technologies have been put forth into the development of PTX delivery systems that not only increase the bioavailability of PTX, but also lower taxol-associated systemic toxicities [5]. For instance, a clinically successful PTX nanoformulation is Nab-paclitaxel, composed of solvent-free paclitaxel protein-bound particles (Abraxane™). This formulation potentiates the selective uptake of paclitaxel in tumors (~33% greater tumor uptake vs. conventional paclitaxel) and shows improved therapeutic index, lower systemic side effects, and avoids steroid premedication. Nab-paclitaxel was FDA-approved in 2005 for chemotherapeutic treatment of metastatic breast cancer. Its later clinical trials led to FDA approval to treat non-small cell lung cancer (2012) and metastatic pancreatic cancer (2013). Similarly, many other PTX preclinical nanoformulations, notably Genexol PM®, NK-105, Paclical®, Lipusu®, PICN, SB05, LEP-ETU, and Triolimus, have received heightened attention in cancer treatment. However, many of these formulations have not made an impact similar to Nab-paclitaxel.
Many dietary polyphenolic compounds derived from plant sources are known to exhibit anti-cancer and chemosensitization properties. Strong scientific evidence suggest [6] that incorporation of bioactive compounds in one’s diet can often reduce the risk of cancer and other chronic diseases. These foods are consumed daily by humans and are thus nontoxic in nature. Among many naturally occurring polyphenolic compounds, tannic acid has received much attention lately due to its excipient value in pharmaceutics, giving it medicinal value. Furthermore, TA has been employed in generating a number of biocompatible products for biomedical applications.
Tannic acid belongs to a subset of hydrolyzable tannin congeners commonly found in a variety of plants, fruits, grains, nuts, and tea leaves. Lately, TA has attracted attention as being an additive molecule, one that can provide improved solubilization of various hydrophobic drugs (amphotericin B, curcumin, rapamycin, paclitaxel, or docetaxel) for localized to parenteral applications. TA renders such additive features due to its low viscosity (easy for generating formulations), excellent water solubility (not all polyphenols exhibit water solubility), and biocompatibility. TA inherently possesses such desired nanocarrier properties primarily because it can bind to drug molecules via hydrophobic interactions, which in turn forms a self-assembled crosslinked network via acting as hydrogen-bonding donor [7, 8].
Our goal is to generate PTX nanoformulations by combining pharmaceutical excipients that not only impart solubilization of PTX, but also contribute to chemosensitization. In our pilot study, the generation of a series of pharmaceutical small-molecule excipient-based PTX formulations, and then screening for specific/strong binding, lower particle size, and enhanced cellular uptake in breast cancer cells, indicate that the TA-bound PTX nanoparticles (TAP NPs) formulation is the best candidate for further study. Therefore, the aim of this study was to design, optimize, and evaluate the improved in vitro therapeutic efficacy of TAP NPs in breast cancer.
2. Materials and methods
2.1. Chemicals and solvents
Aquaplex® (randomly methylated β-cyclodextrin, catalogue no. AP-OLEC2), Trappsol® (carboxymethyl-β-cyclodextrin (CM-β-CD), catalogue no. TCMBPY), β-cyclodextrin (β-CD, catalogue no. TBCD-P), and hydroxypropyl-β-cyclodextrin (HP-β-CD, catalogue no. THPB-P) were received from CTD Holdings, Inc. (Alachua, FL). L-ascorbic acid (L-AC, catalogue no. A7506), D-α-tocopherol (D-α-TP, catalogue no. 57668), Tween 80 (T80, catalogue no. P1754), D-mannitol (DM, catalogue no. M4125), D-sorbitol (DS, catalogue no. S1876), citric acid (CA, catalogue no. 251275), tannic acid (TA, catalogue no. 403040), and 4-(2-Hydroxyethyl) piperazine-1-ethanesulfonic acid, N-(2-Hydroxyethyl)piperazine-N′-(2-ethanesulfonic acid) (HEPES, catalogue no. H3375) were purchased from Aldrich (St. Louis, MO, USA). LC-MS/MS mobile phase solvents (methanol, formic acid and acetonitrile) were purchased from Aldrich. All of these chemicals, reagents, and solvents were analytical or HPLC grade and were used as received without further purification.
2.2. Cell culture
The breast cancer cell lines (MDA-MB-231 and MCF-7) were purchased from American Type Culture Collection (ATCC, Manassas, VA, USA). These cell lines were cultured in Dulbecco’s Modified Eagle Medium (DMEM) that was supplemented with phenol red, 10% fetal bovine serum, 100 U/mL penicillin and 100 U/mL streptomycin (Thermo Fisher Scientific, Grand Island, NY). For all experiments, cell lines were incubated at 37°C in a humidified 5% CO2 and 95% air atmosphere (Thermo Fisher Scientific, Waltham, MA, USA). At 80–90 % confluency, these cells were trypsinized, counted using Trypan Blue (0.4%) and seeded as per specific experiments. Cells were allowed to adhere to the plate surface overnight before implementing any further treatment.
2.3. Preparation of nanoparticles
We have screened a set of eleven commonly used water-soluble pharmaceutical excipients/small molecules Aquaplex®, Trappsol®, L-AC, CA, DM, β-CD, HP-β-CD, D-α-TP, DS, T80, and TA to achieve the best PTX nanoformulation. The PTX nanoparticles were prepared by the solvent evaporation method. Being lipophilic in nature, paclitaxel was dissolved in acetone (stock concentration, 1 mg/mL). Pharmaceutical excipient(s) (5 mg) were dissolved in 1 mL of ultrapure water (Milli-Q® Integral ultrapure water, 18.2 MΩ-cm) in 8 mL flat bottom glass vials on a Benchmark digital magnetic stir plate (400 rpm, ABC Scientific, Glendale, CA, USA) at room temperature. To this solution, PTX in acetone solution (100 µL of 1 mg/mL) was slowly added dropwise to this solution. The stirring speed was increased to 900 rpm and the solution was allowed to stir overnight to ensure that all of the acetone evaporated, leaving behind the nano self-assembly of small molecule and PTX, referred to as pharmaceutical excipient-PTX nanoparticles (PE-PTX NPs). For particle size, zeta potential, cellular uptake, and hemolysis experiments, a fresh batch of PE-PTX nanoparticles was always prepared. Note: the tannic acid-PTX nanoformulation will be referred to as TAP NPs (Tannic Acid-Paclitaxel Nanoparticles). This is a specific optimized formulation with low particle size, superior cellular internalization, and better hemocompatibility.
2.4. Particle size and zeta potential
The hydrodynamic mean particle size (nm) and the size distribution/polydispersity (PDI) of PE-PTX NPs were measured by Zetasizer (Nano ZS, Malvern Instruments, Malvern, UK) based on the dynamic light scattering principle. These measurements were performed at 25°C with an angle of detection of 173°. For this determination, 50 µL of 100 µg/mL of PE-PTX NPs were added to 1 ml of ultrapure water and subjected to probe sonication (VirSonic Ultrasonic Cell Disrupter 100, The VirTis Company, Gardiner, NY) for 30 s. An average diameter and distribution of particle sizes of the samples were reported from 3 runs (each run took ~2 min). The zeta potential of these nanoparticles (50 µL of 100 µg/mL PE-PTX NPs in 1 ml of 1X PBS) was determined by a laser Doppler microelectrophoresis technique using Zetasizer. Each measurement was carried out in triplicate (each reading = 30 runs). Additionally, we determined the particle size and zeta potential of the optimized formulation (TAP NPs) in HEPES buffer at pH 6, 7, 7.4 and 8 to investigate the alteration in size distribution and charge with change in pH. For this purpose, freshly prepared 1 mM of HEPES buffer using HEPES salt in ultrapure water was prepared. The pH of the buffer solutions were adjusted with 0.1 N HCl and NaOH solutions and stored at 25oC.
2.5. Quenching assay
Binding affinities of the pharmaceutical excipients to PTX (PTX conjugated to Oregon green 488 conjugate with a Flutax-2, Molecular Probes Inc., Life Technology, OR, USA) were determined following fluorescence decay of PTX using a SpectraMax Plus plate reader (Molecular Devices, Sunnyvale, CA). PTX conjugated to Oregon green 488 was used instead of PTX for this experiment. The PTX conjugated to Oregon green 488 at a concentration 5 µg/mL was set for this study. The concentrations of PE solutions were as follows: 0, 5, 10, 15, 20, 30, 80, and 130 µg/mL. The fluorescence spectra were obtained by exciting these solutions at 496 nm and emission set between 450–600 nm. All measurements were performed at room temperature. The fluorescence decay profiles of PE-PTX samples were used to calculate the number of binding sites and the binding constant (k) [9].
2.6. Cellular uptake
The cellular uptake of these nanoformulations in MDA-MB-231 and MCF-7 breast cancer cells was determined by tracking fluorescent dye (coumarin 6)-loaded NPs. Coumarin 6 was loaded in pharmaceutical excipient nanoparticles (PE-NPs) in a similar fashion as described in Section 2.3. For the qualitative cellular uptake experiment, 0.5×10⁶ cells were seeded in a 12-well plate and allowed to adhere to the plate surface overnight. On the next day, the cells were treated with PE-NPs at a concentration of 5 μmol/L for 3 hours. After treatment, cells were washed with 1X PBS, then phenol red-free DMEM medium was added and imaged under the GFP channel (Ex 470 nm/Em 525 nm) of EVOS® 214 FL Imaging System (AMF4300, Life Technologies, Carlsbad, CA, USA). For semi-quantification of Coumarin 6 loaded in PE-NPs inside the breast cancer cells, they were trypsinized using 0.25% Trypsin-EDTA, pelleted down, washed twice with 1X PBS, collected, and dispersed in 1 mL phenol red-free DMEM medium. These cell suspensions were injected into the Accuri C6 Flow Cytometer (Accuri Cytometer, Inc., Ann Arbor, MI, USA) and fluorescence levels were detected in FL1 channel using 220 FITC/GFP green filter with an excitation at 488 nm (Blue laser, 530 ± 15 nm).
2.7. Hemocompatibility
The hemolysis assay was performed to determine the hemocompatibility of PE-PTX NPs with freshly collected human blood samples from Interstate Blood Bank, Inc., (IBBI, Memphis, TN, USA). The IBBI has appropriate ethical approval and authority to collect blood samples and distribute for research and clinical work. The blood sample (1 mL) was centrifuged at 2000 rpm for 5 min, then the supernatant was discarded and the red blood cell (RBC) pellet was suspended in 10 ml isotonic PBS and 200 µL of cell suspension was used for the hemocompatibility assay. This RBC solution was treated with 10–100 µg/well PTX (in DMSO) or an equivalent concentration of PTX in PE-PTX NPs in a 96-well plate and incubated for 1 hour at 37°C. For this experiment, PBS and sodium dodecyl sulfate (SDS at 1 mg/mL) served as negative and positive experimental controls, respectively. After the incubation period, the hemoglobin released into the medium was collected and transferred into a fresh 96-well plate and hemoglobin optical density was quantified using a spectrophotometer (Cytation 3 imaging reader, BioTeK Winooski, VT, USA) at λmax570 nm. To confirm our results, a few drops of the treated RBCs were collected after the quantification and smeared on a glass slide using the cover slip, and imaged using the EVOS® FL Imaging System (AMF4300, Life Technologies, Carlsbad, CA, USA).
2.8. Physicochemical characterization of TAP NP formulation
Freshly prepared solution samples of TAP NPs were lyophilized in the Labconco Freeze Dry System (−52°C 133 × 10−3 m Bar; Labconco, Kansas City, MO, USA). The freeze-dried samples were used to record physicochemical characterization data, such as Fourier Transform Infrared (FTIR) spectra; thermogravimetric analyzer (TGA) scans; and X-ray diffraction (XRD data. FTIR spectra of TAP NPs were recorded on a Universal Attenuated Total Reflectance (UATR) Accessory plate by a Spectrum 100 FTIR spectrometer (Waltham, MA). The lyophilized samples were placed on the tip of the UATR diamond objective and a pressure of 90 N/cm2 was applied. Spectra were acquired between 4000 and 650 cm−1 at a scanning speed of 4 cm−1 for 32 scans. The averaged data were presented as FTIR spectra (%T vs. cm−1) and analyzed using Spectrum 100 software. A Q50 thermogravimetric analyzer (TA Instruments, New Castle, DE) was used for TGA analysis under dry nitrogen atmosphere with a flow rate and heating rate of 10 mL/min and 10°C /min, respectively. Thermogravimetric profiles were recorded from 50°C to 500°C. A Rigaku D/Max-B diffractometer (Rigaku Americas Corp, Woodlands, TX) with cobalt-alpha radiation (k 1.5 Å) was used for phase identification for crystalline material analysis. XRD patterns were acquired over 2θ range from 25o–70oC. The morphology and particle size of TAP NPs (after drying on grids) were determined using a JEOL 200EX transmission electron microscope (TEM) (JEOL Ltd, Tokyo, Japan) coupled with an AMT camera. For this study, TAP NPs (20 µL of 100 µg PTX-equivalent/mL of TAP NPs) were placed onto the shiny side of the copper grid (150 mesh, Electron Microscopy Sciences, PA, USA). A 2% w/v aqueous solution of uranyl acetate was used to stain TAP NPs to increase contrast property. The air-dried TAP NPs were imaged under the TEM at a direct magnification of 100,000x.
2.9. Quantitative analysis of TAP NPs
2.9.1. LC-MS/MS Analysis
The concentrations of PTX in the TAP NPs were measured by liquid chromatography-tandem mass spectrometry (LC-MS/MS) using an LC system (Shimadzu Corporation, Kyoto, Japan) connected to a Triple Quad 5500 tandem mass spectrometer (AB SCIEX, Framingham, MA). The mobile phase was water with 0.1% formic acid and acetonitrile with 0.1% formic acid (v/v). The gradient elution was as follows: the starting condition was set at 50% mobile phase B and was kept at 50% for the first min. The percentage mobile phase B was then increased from 50% to 100% from 1–2 min, maintained at 100% up to 4 min, and then decreased to 50% up to 5 min, and maintained at 50% until 6 min elapsed time. The flow rate was set at 0.8 mL/min and total run time was 6 min, with a retention time of 2.36 min for PTX. Docetaxel (DTX) was used as an internal standard. Separation was achieved using XTerra® MS C18 Column Reversed-Phase 3.5 µm Spherical Hybrid, 4.6 mm x 50 mm (#186000432, Waters, Milford, MA). The following mass spectrometry ionization parameters were used: positive electrospray ionization mode, curtain gas pressure set at 20 psi, collision-activated dissociation at 10 psi, ion spray voltage at 5500 V, temperature at 60°C, gas 1 and gas 2 pressure at 50.0 psi, declustering potential at 51.0 V, entrance potential at 10.0 V, collision energy at 21.0 V, and collision exit potential at 24.0 V. Analytes were quantified using multiple reaction monitoring to monitor the ion transitions of m/z 876.3→308.0 for PTX and m/z of 830.4→549.2 for DTX. The calibration standards for the analysis of drug encapsulation efficiency study were prepared in PBS, whereas CelLytic™ M (C2978) was used for the calibration standard preparation for cellular uptake study. The range of linear response of PTX was 0.039–40 µg/mL with R2=0.9916 in PBS and 0.01–10 µg/mL with R2=0.9959 in cell lytic buffer.
2.9.2. Encapsulation efficiency
Encapsulation or entrapment efficiency (EE) of paclitaxel in TAP NPs was quantified by using LC-MS/MS. TAP NPs were centrifuged at 10,000 rpm for 10 min to remove larger particles and non-encapsulated drug as a pellet. Supernatants were analyzed for drug content using LC-MS/MS. The EE was calculated as follows: EE = [Amount of drug in TAP NPs (µg)/Initial amount of drug (µg)] × 100.
2.9.3. Intracellular drug uptake
To determine in vitro intracellular concentration of PTX in MDA-MB-231 cells, cells were seeded in 150 mm petri dishes and allowed to attain 60–70% confluency. Each of the petri dishes at the defined time point was treated with 500 ng of PTX or equivalent concentration of PTX in TAP NPs. Control cells without any treatment served as a control for this study. After 2, 4, and 6 hours of treatment, cells were washed with 1X PBS to remove any unwanted drug adhering to the cell surface, followed by trypsinization and centrifuging at 1000 rpm for 5 min. For extraction of internalized drug from cells, the trypsinized and centrifuged pellet was re-suspended in CelLytic™ M buffer and sonicated using 30 cycles of Ultrasonic Homogenizer (Biologics, Inc.), active every 10 seconds for a 5 min duration at 200 W, on an ice bath. The internalized drug extracted from cells was measured by LC-MS/MS. Data were represented in triplicates or greater number of determinations.
2.10. Biological assays
2.10.1. Cell proliferation assay
MTT assay was performed to assess the superior cytotoxicity of TAP NPs over PTX on breast cancer cells. Briefly, 5×10³ breast cancer cells (MDA-MB-231 and MCF-7) in 100 µL of media were seeded in a 96-well plate and allowed to rest in the incubator at 37°C overnight. Cells were treated with 1–50 nmol/L PTX or 1–50 nmol/L PTX-equivalent TAP NPs, and controls of untreated cells, DMSO, and plain TA, respectively, for 48 hours. Afterwards, cells were incubated with 20 µL of MTT reagent and incubated for 2–3 hours until the formazan salts formed. The media was aspirated out very carefully (as not to disturb any formazan crystals) and 100 µL of DMSO were added to dissolve the salt formation [10]. The absorbance was recorded using a Microplate Reader (BioTeK Cytation 3, Winooski, VT, USA) at 570 nm. Each treatment concentration was studied in triplicate determinations. The cell proliferation ability of PTX or TAP NPs was determined as the percentage in contrast to the control (DMSO or TA). Changes in cell morphology following treatment were imaged using EVOS® FL Imaging System at 20X magnification.
2.10.2. Clonogenic assay
This study was performed to investigate the influence of TAP NPs on clonogenic forming ability of breast cancer cells. Briefly, MDA-MB-231 and MCF-7 (250 cells/well in 1 mL) were seeded in a 12-well plate and allowed to adhere to the plate and grow smaller colonies in 2 days. Then cells were treated with 0.25, 0.5, and 1 nmol/L PTX and 0.25, 0.5, and 1 nmol/L PTX-equivalent TAP NPs and respective controls (no treatment and TA-treated breast cancer cells). These cells were allowed to rest in the incubator for the next 15 days, with intermittent changing of medium but no drug added. After 15 days visible colonies were processed for staining with hematoxylin and imaged according to our previous reports [11]. The number of colonies formed were represented as bar graphs to represent the difference in the effect of each treatment group. The results are presented as the percentage of colonies in contrast to the control groups (non-treated cells).
2.10.3. Cellular migration
Cell migration was analyzed using the Boyden’s chamber cell migration assay [12, 13]. Briefly, MDA-MB-231 (0.5×10⁵) cells were suspended in serum-free media with 5 and 10 nmol/L of PTX or equivalent amounts in TAP NPs, added to the upper chamber of the 96-transwell inserts (catalogue no.3374, Corning, NY, USA). These inserts were then placed inside the 96-well plates in pure media (10% FBS). After 24 hours incubation, the migrated cells at the lower inside of the Transwell inserts were fixed with 4% formaldehyde and stained with crystal violet, with cells on the upper side of the insert being removed with a cotton swab. Inserts were imaged using the EVOS® FL Imaging System, the number of migrated cells were counted and expressed as a percentage with respect to the migrated control cells (cells with no treatment).
2.10.4. Cellular invasion
Cellular invasion was measured using the BD Biocoat Matrigel Invasion Chambers (BD Biosciences) [13]. MDA-MB-231 (3.5 × 10⁴ cells) were seeded in the matrigel invasion chambers (BD Biosciences, Bedford, MA, USA) in serum-free medium and treated with 5 and 10 nmol/L PTX or 5 and 10 nmol/L equivalent PTX of TAP NPs for 24 hours. 10% FBS medium was placed into the lower chamber as chemoattractant. The invaded cells were fixed with methanol and stained using crystal violet. The plates were imaged and were counted as described in section 2.10.3.
2.11. Drug resistance assays
2.11.1. P-gp ATPase activity
To investigate the effect of TAP NPs on the inhibition of P-gp efflux pump, the P-gp-Glo™ Assay Systems (Promega, USA) was used per manufacturer’s instructions. This assay can be used to determine the effect of a compound to characterize inhibitors of P-gp ATPase activity. Na3VO4 is used as a negative control and verapamil is used as a positive control for drug stimulation of P-gp ATPase activity. The test compounds were PTX, TAP NPs, and TA, while untreated samples served as our experimental control. The manufacturer’s protocol was followed for the experiment.
2.11.2. Rhodamine-123 efflux assay
To study the difference in P-gp expression with treatment of TAP NPs, the Rhodamine-123 (RH123) accumulation assay was employed [14]. For this study, 0.5×10⁶ of MDA-MB-231 BC cells were seeded in a 6-well plate and allowed to adhere to the surface overnight. The next day, cells were treated with 5 and 10 nmol/L of PTX or 5 and 10 nmol/L of PTX-equivalent TAP NPs. After 48 hours, 2.62 µmol/L of RH123 was incubated with cells for 30 min. Following incubation, cells were washed with 1X PBS and imaged using phenol red-free DMEM medium under an EVOS® 214 FL Imaging System [15]. For semi-quantification, cells were then trypsinized, pelleted down, washed with 1X PBS, and suspended in phenol red-free DMEM medium and analyzed using Accuri C6 Flow Cytometer in FL1 channel with an excitation at 488 nm (Blue laser, 530 ± 15 nm).
2.12. β-tubulin stabilization
The treatment effect of TAP NPs on tubulin stabilization was studied by confocal imaging. For this, MDA-MB-231 (0.25 × 10⁶) cells were grown on coverslips and were treated with 5 and 10 nmol/L PTX or PTXequivalent TAP NPs for 8 hours. Blank TA and cells with DMSO treatment served as our experimental control. The treated cells were fixed in 4% paraformaldehyde in PBS, pH 7.4 for 15 minutes at room temperature. Fixation was subsequently quenched with 0.1 M glycine and washed in PBS. After washing, cells were blocked in 10% goat serum/5% BSA/0.5% TritonX-100 in PBS for 1 hour at RT. Following blocking, sections were incubated with 1:50 Anti-beta Tubulin antibody (#ab6046, Abcam, Cambridge, MA) overnight at 4°C, on a rocker at 20 oscillations/min. The next day, after washing in blocking buffer three times for 5 minutes each, cells were probed using Goat anti-Rabbit IgG (H+L) Cross-Adsorbed Secondary Antibody, Alexa Fluor 488 (catalogue no. A11008) and DAPI to label nuclei for 1 hour. After washing in PBS four times for 5 minutes each, coverslips were mounted using Prolong Diamond Antifade Mountant (catalogue no. P36961) and imaged using a laser confocal microscope (Carl Zeiss LSM 710, Thornwood, NY, USA) with a 40×0.7NA oil immersion objective. All images were captured using the same laser power and gain settings to ensure comparability for intensity analysis. Fluorescent intensities were quantified using Image J. Data were represented by measuring fluorescent intensities from 18 individual cells.
2.13. Western blotting
MDA-MB-231 BC cells (1 ×10⁶) were seeded in a 100 mm dish and allowed to adhere to the surface overnight. The next day, these plates were treated with 10 nmol/L PTX or 10 nmol/L PTX-equivalent TAP NPs, and their respective controls of untreated cells and TA treated cells, for 48 hours. Cell lysates were formed using 2X SDS lysis buffer (Santa Cruz Biotechnology, Santa Cruz, CA) and the protein was quantified using Bradford assay and run on a SDS-PAGE [16, 17]. The expressions of specific proteins were determined with an immunoblotting assay as described above. Protein expressions confirmed by immunoblotting were β-actin (#4967), Bcl-xL (#2762), Bad (#9268), p53 (#2527), Cleaved Caspase-7 (#9491), MDR1/ABCB1 (#13342), and Cleaved PARP (#9548) (Cell Signaling Technologies, Danvers, MA). The protein bands were developed under the ChemiDoc™ MP System (Bio-Rad, Hercules, CA, USA) with the help of Lumi-Light Detection Kit.
2.14. RNA extraction and microarray studies
The gene regulatory effects of TAP NPs on breast cancer cells were evaluated by microarray studies. For this, MDA-MB-231 cells (1×10⁶) were seeded in a 100 mm dish and allowed to reach 60–70% confluency before treating with PTX and TAP NPs for 24 hours. The RNA was extracted, purified, and processed as described in our previous study [18]. The RNA integrity was confirmed through NanoDrop™ 2000 (Thermo Fisher Scientific, Waltham, MA, USA). In this study, the clariom™ S Human gene array (Affymterix, Santa Clara, CA, USA) was employed as gene chips, and the assay was performed per the manufacturer’s protocol.
2.15. Statistical Analysis
All data were generated and analyzed using GraphPad Prism 5.03 Software (GraphPad Software, San Diego, CA) and results are presented as mean ± standard error of mean (SEM). Statistical significance was performed using Student’s t test, and * corresponds to a p value <0.05, which was considered significant when compared to control.
3. Results
3.1. Screening of pharmaceutical excipients for PTX delivery
The main purpose of conducting this study was to develop a nanoformulation against breast cancer that would possess superior anticancer activity [19]. For this purpose, we developed nanoformulation(s) of paclitaxel utilizing eleven commonly used pharmaceutical excipients: Aquaplex®, L-ascorbic acid, citric acid, beta-cyclodextrin, carboxymethyl-beta-cyclodextrin, D-mannitol, hydroxypropyl-beta-cyclodextrin, D-α-tocopherol, D-sorbitol, tannic acid, and Tween The drug–loaded, self-complexed nanoparticles were prepared with a self-assembly technique. Incorporation of paclitaxel dissolved in acetone occurred when the drug solution is placed in a polymer excipient solution overnight. Evaporation of acetone allows nanoparticles to form a suspension in an aqueous phase. The resultant nanoparticles generated with all above pharmaceutical excipients were screened and characterized for particle size and size distribution, surface charge, drug binding efficiency, hemocompatibility, and cellular uptake in cancer cells (Table 1). Supplementary Information, Fig. S1 represents particle sizes of all the PE-PTX NPs generated. Among these, TAP NPs and Tween 80-PTX NPs demonstrate good particle sizes of <100 nm, which is considered optimal from a drug delivery standpoint. However, Tween 80-PTX NPs, despite having a low particle size of 80.68+7.13, the lower number of available binding sites and low binding rate limits its further optimization.
Table 1.
Preliminary evaluation of pharmaceutical excipient based paclitaxel nanoparticles for developing breast cancer therapeutics.
| Pharmaceutical excipient based paclitaxel nanoformulation | ||||||||
|---|---|---|---|---|---|---|---|---|
| Pharmaceutical excipienta |
Particle size (nm) |
Zeta Potential (mV) |
Fluorescence quenching | Mean fluorescence intensity (MFI×105)c |
% hemolysis at 50 µgd |
|||
| Dye quenching (AUC×106)b |
Number of Binding site(s) |
Binding rate constant (k) |
MDA-MB- 231 |
MCF7 | ||||
| Aquaplex® | 355.93±15.97 | −4.32±0.81 | 1.65 | 0.80 | 0.003 | 1.37±0.092 | 0.86±0.014 | 2.06±0.01 |
| L-Ascorbic acid (L-AC) |
321.63±23.22 | −2.25±0.65 | 0.94 | 1.38 | 0.035 | 1.87±0.031 | 0.98±0.010 | 3.78±0.34 |
| Citric acid (CA) | 323.60+27.90 | −3.60±0.65 | 1.17 | 0.57 | 0.008 | 0.23±0.002 | 0.40±0.002 | 50.17±0.35 |
| Trappsol®, (CarboxyMethyl- β-CD) |
252.50±14.51 | −6.98±0.78 | 1.26 | 0.73 | 0.012 | 2.18±0.045 | 2.18±0.067 | 7.21±0.59 |
| β-cyclodextrin (β-CD) |
254.31±7.58 | −5.07±0.66 | 1.34 | 1.05 | 0.012 | 0.49±0.008 | 0.32±0.004 | 12.71±0.68 |
| Hydroxypropyl β- cyclodextrin (HP- β-CD) |
213.56±8.55 | −5.59±0.46 | 1.47 | 0.94 | 0.010 | 0.47±0.004 | 0.18±0.001 | 19.24±3.82 |
| D-Mannitol (DM) | 308.33±19.77 | −8.87±0.46 | 1.50 | 0.41 | 0.001 | 0.27±0.001 | 0.23±0.013 | 1.03±0.03 |
| D-Sorbitol (DS) | 149.76±4.61 | −7.05±0.30 | 2.58 | 0.63 | 0.001 | 0.14±0.026 | 0.14±0.017 | 6.18±0.59 |
| Tannic acid (TA) | 102.22±14.05 | −8.85±0.44 | 0.94 | 1.40 | 0.038 | 4.24±0.045 | 4.91±0.030 | 5.15±0.02 |
| D-α-tocopherol (D-α-TP) |
161.06±21.25 | −6.28±0.05 | 1.70 | 0.46 | 0.003 | 0.18±0.001 | 0.21±0.004 | 9.96±0.34 |
| Tween 80 (T80) | 80.68±7.13 | −6.63±0.39 | 2.20 | 0.43 | 0.001 | 2.30±0.266 | 2.49±0.149 | 9.96±0.02 |
5 mg/mL of each pharmaceutical excipient was used to generate PE-PTX nanoparticles.
Oregon green 488 conjugated to PTX (5 µg/ml) was quenched with 130 µg/ml of PE solutions.
Coumarin 6 loaded Pharmaceutical excipient nanoparticles (5 μg/ml equivalent coumarin 6 nanoparticles) were treated on breast cancer cells
ASTM E2524–08 standard considers hemolysis of ≤ 5% safe compounds are safe for human consumption.
The PTX-conjugated Oregon green 488 quenching ability with all pharmaceutical excipients was determined with a fluorescence spectrophotometer. The fluorescence intensity of the PTX dye decreases with the increase of pharmaceutical excipients. This quenching is at a maximum with tannic acid as seen in Table 1 (Column 4: Dye quenching). In contrast to all the other ten pharmaceutical excipients employed, TA has the minimum area under the curve (AUC), demonstrating that PTX dye is quenched by TA, which causes the most reduction in AUC (Supplementary Information, Fig. S2). This is directly correlated to the binding ability of tannic acid to PTX by attractive forces such as hydrogen bonding and electrostatic interactions. The superior binding efficiency with tannic acid was confirmed from the higher number of binding sites (1.4) and binding constant (0.03) over other pharmaceutical excipients. Table 1 shows ascorbic acid has a similar reduction in AUC, total number of binding sites and binding constant as tannic acid; however, its large particle size of 321.63 nm (as formulated into nanoparticles) limits its further use.
Tannic acid-paclitaxel nanoparticles (TAP NPs) formation by the self-assembly process was confirmed by space-filling energy-minimized (MM2) molecular modeling using ChemBio3D Ultra 14 Suite (CambridgeSoft Corporation, A subsidiary of PerkinElmer, Inc.). The space-filling energy-minimized molecular models of different ratios of TA:PTX (1:1, 2:1, 3:1, 4:1, 5:1, 6:1, 8:1, 10:1 and 12:1) indicates thermodynamically feasible TA-PTX self-assembly formation (Scheme 1A). Among many ratios employed for the formation of TAP NPs, TA: PTX ratio of 24:1 leads to a well-organized nanoparticle structure with particle size and zeta potential of 102.22±14.05 nm and −8.85±0.44 mV. The presence of excess TA was utilized as a stabilizing agent of the nano formulation, as previously reported [20]. The illustration of self-assembly formation of TAP NPs is shown in Scheme 1B. The nanoparticles generated should be well internalized inside the cytosolic membrane to be able to deliver therapeutic benefits. In this regard, we loaded the nanoparticles with fluorescent dye (coumarin 6) to be able to detect through the GFP channel of the microscope/flow cytometer. This study was investigated using breast cancer cell lines MDA-MB-231 and MCF7. The cellular internalization was observed to be in the order of tannic acid > Tween 80 > CM-β-CD > ascorbic acid > aquaplex > β-CD > HP-β-CD > D-mannitol > citric acid tocopherol > D-sorbitol for MDA-MB-231, and tannic acid > Tween 80 > CM-β-CD > ascorbic acid > aquaplex > citric acid > β-CD > tocopherol > D-mannitol >HP-β-CD > D-sorbitol for MCF7 (Table 1, Column 7 & 8). Tannic acid demonstrated significantly increased cellular uptake in contrast to all the coumarin 6-loaded excipient nanoparticles, through determinations both by flow cytometry (Table 1) and the EVOS® FL Imaging System (Supplementary Information, Fig. S3). To implement our generated nanoparticles from bench to bedside, the toxicity profile of the formulations needs to be assessed. Hemocompatibility assay of these pharmaceutical excipient-PTX nanoparticles (PE-PTX NPs) were investigated at varying concentrations ranging from 10- µg/well PTX alone and 10–100 µg/well PTX-equivalent PE-PTX NPs. Table 1 data show that µg PTX is toxic to RBCs with ~ 63% hemolysis (Supplementary Information, Fig. S4). There was no significant difference observed with varying concentrations of TAP NPs, while many PE-PTX NPs were not toxic in nature. Indeed, TAP NPs exhibited a safer profile. This behavior was further evaluated by the morphological changes of red blood cells that are incurred after incubating with PTX alone and PE-PTX NPs, respectively (Supplementary Information, Fig. S5). TAP NPs demonstrated no morphological changes in the structure of RBCs on treatment (similar to negative control or PBS).
Scheme 1:
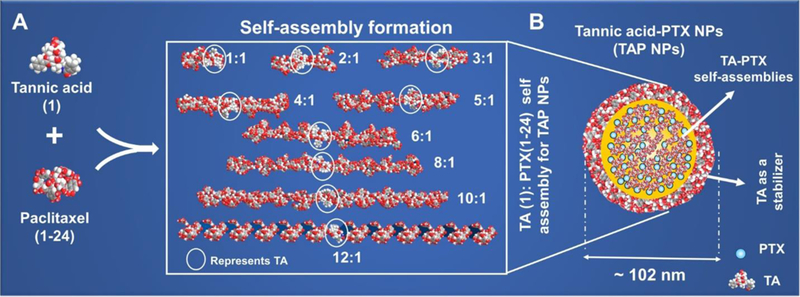
Formation and optimization of TAP NPs: A) Space-filling energy-minimized (MM2) molecular modeling shows generation of thermodynamically stable TA-PTX self-assembly. Various ratios as shown above were employed to generate MM2 models of TA-PTX self-assembly. B) Hypothetical representation of 24:1 ratio of TA: PTX self- assembly, so called Tannic acid Nanoparticles (TAP NPs). For visual clarity, PTX in hypothetical structure is represented as.
Altogether, the screening of various pharmaceutical excipient-based PTX nanoparticles, studied by particle size, zeta potential, PTX binding, cellular uptake, and hemolysis data suggests that tannic acid is considered a safe vehicle for PTX delivery, and thus is considered to be the best candidate for further investigation.
3.2. Characterization of TAP NPs
DLS data demonstrated that TAP NPs measured approximately 102.22±14.05 nm (Fig. 1A). No specific change in particle size was seen for 6 days after storing the nanoformulation at room temperature, except for day 7 (Inset of Fig. 1A), which suggests that TAP NPs are stable at room temperature for at least a week. Although, extended stability study needs to be validated in future studies. The effect of changes in pH with nanoparticle generation was examined by using HEPES buffer (pH range 6–8). Change in size is represented in Fig. 1B. These data further suggested that at all recorded pH values (6, 7, 7.4, 8), TAP NPs demonstrate well-assembled nanoparticles of 154.13, 116, 82.16, 71.55 nm at pH values 6, 7, 7.4 and 8 respectively. TA is a weakly acidic molecule because of phenolic and gallic acid molecules which is capable of donating protons. At higher pH, more phenolate binding sites are available for effective complexation with PTX. This leads to more packed self-assembly formation of TAP NPs with lower particle size at higher pH 8 compared to pH 6 (Fig. 1B). The TAP nanoparticles exhibited spherical morphology as seen in Fig.1C. As seen under the TEM, TAP NPs measure an average of 60.55±3.03 nm.
Figure 1. Physico-chemical characterization of TAP NPs.
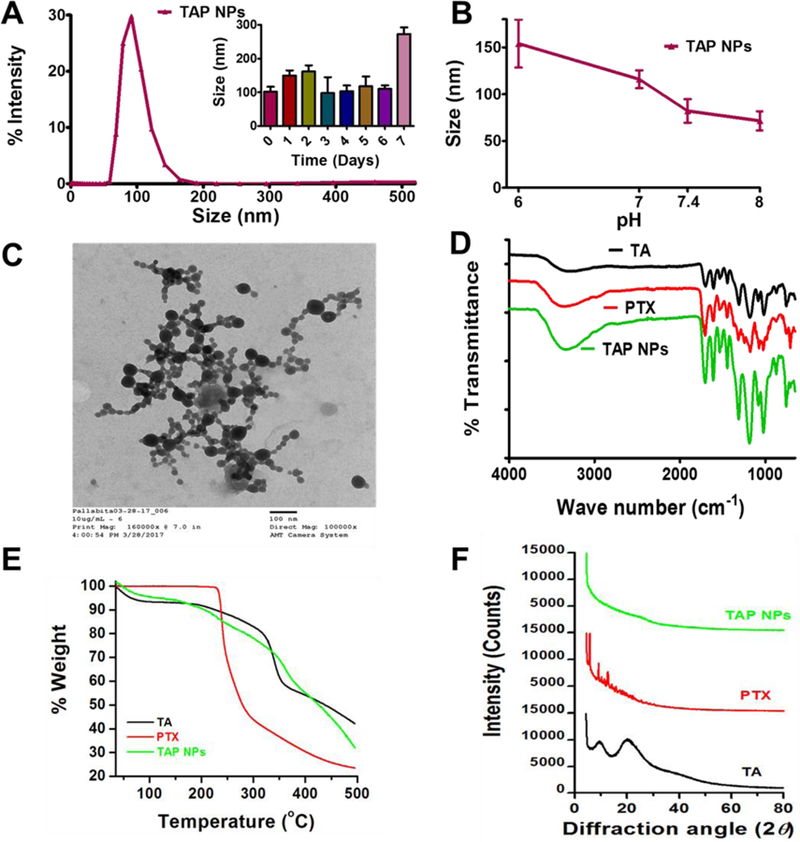
A-B) Dynamic light scattering analysis of TAP NPs: stability over 1-week and in different pH solutions. 50 µL of TAP NPs were added to 1 mL of ultrapure water or pH solutions and probe sonicated for 30 s and particle size was measured using Zetasizer (Nano ZS, Malvern Instruments, Malvern, UK) at 25 °C. A) TAP NPs exhibited particle size of 102.22±14.05 nm. Inset: representative particle size of TAP NPs stored at 25 °C for 1-week, demonstrating stability and no significant change in size. B) Stability of TAP NPs in HEPES buffer solutions (pH 6, 7, 7.4 and 8). Data presented as mean ± standard error of the mean (n = 3). C) A representative transmission electron microscopic (TEM) image of TAP NPs. UranyLess EM Stain solution was used to achieve a better contrast purpose for nanoparticles. Image was acquired by using JEOL 200EX TEM at a direct magnification of 100,000× (scale = 100 nm). D) Fourier-transform Infrared (FTIR) spectral analysis of TA, PTX and TAP NPs acquired on a Universal Attenuated Total Reflectance (UATR) accessory plate by a Spectrum 100 FTIR spectrophotometer (Waltham, MA), between 4000 and 650 cm−1 at a scanning speed of 4 cm−1 for 32 scans. TAP NPs show characteristic TA peaks at 1603 and 1700 cm−1 and PTX peaks at 3350 and 1650 cm–1, confirming the presence of functional moieties of TA and PTX in TAP NPs. E) Thermogravimetric analysis (TGA) was recorded for TA, PTX and TAP NPS from 50 to 500 °C by a Rigaku D/Max-B diffractometer (Rigaku Americas Corp, Woodlands, TX) with cobalt-alpha radiation (k = 1.5 Å). There is no significant change in thermograms of TAP NPs in comparison to TA and PTX. F) X-ray diffraction (XRD) was acquired at 2θ range of 25 – 70 oC suggesting TAP NPs has both TA and PTX present in amorphous or dissolution state.
To confirm the presence of paclitaxel and tannic acid in TAP NPs, molecular composition was investigated by FTIR spectroscopy (Fig. 1D). The characteristic peaks at 1700 cm−1, 1603 cm−1, and 1198 cm−1 belong to C=O stretching, aromatic C=C stretching, and phenolic C-O stretching for tannic acid, whereas characteristic vibrational peaks of paclitaxel include 3350 cm−1 (N-H stretching) and 1703 cm−1 (C=O stretching) [24, 25]. The characteristic peak of phenolic C-O at 1198 cm–1 of TA is shifted to 1100 cm–1 in TAP NPs, while the characteristic band of the aromatic ring at 1603 cm–1 and ester band at 1700 cm−1 are observed in TAP NPs. Also, the main characteristic peaks of paclitaxel at 3350 cm–1 and 1650 cm–1 can be detected in TAP NPs due to N-H and C–C stretching, respectively, indicating the presence of paclitaxel in TAP NPs. Interactions between tannic acid and paclitaxel are mainly through the ester functions, aromatic rings, and hydrogen bonding mediated by the phenolic hydroxyl groups, which suggest attractive forces occur between tannic acid and paclitaxel in TAP NPs, but there is no evidence of covalent bond formation.
The physical state of tannic acid and paclitaxel in TAP NPs may influence various drug delivery properties. Thermogravimetric and XRD analyses were employed to study such interactions and the physical state of TA and PTX complex structure. Thermograms of tannic acid (Fig. 1E, Supplementary Information, Fig. S6) show two major weight loss peaks between 55–100oC due to curing, reformation, and oxidation, while another appears at 300–400°C due to severe degradation of tannin intermolecular bonding. In the case of PTX, it exhibited a strong degradation pattern above 228oC. When PTX is incorporated into TA assemblies, TAP NPs demonstrate degradation patterns very similar to tannic acid, but it retains its PTX degradation phenomenon too. XRD patterns of PTX demonstrate a number of sharp peaks around 5.38, 9.62, 10.74, 11.85, and 12.96° (2θ) (Fig. 1F), while TA shows broad peaks at 9.75 and 20.63o (2θ). However, XRD of TAP NPs does not show such characteristic peaks of either TA or PTX. This suggests that both TA and PTX are present in the form of amorphous or dissolved states in TAP NPs.
3.3. Encapsulation efficiency and intracellular drug uptake of TAP NPs
The aims of drug entrapment are either enhanced delivery or improved uptake in cancer cells, and reduction in off-target toxicity. The encapsulation efficiency of PTX in TAP NPs was determined by LCMS/MS and was > 96.49±0.43%. Drug activity is dependent on crossing the cellular membrane and forming drug depots in cellular compartments. For this reason, qualitative analysis of cellular transport of coumarin 6 loaded in pharmaceutical excipient nanoparticles (PE-NPs) was examined in MDA-MB-231 cells in a time-dependent manner and cellular internalization of coumarin 6 was imaged by EVOS® FL Imaging System at 40X magnification, as seen in Fig. 2A. After confirming uptake of TAP NPs in breast cancer cells, we examined cellular transport of PTX from a plain PTX drug solution vs. TAP NPs in breast cancer cell line MDA-MB-231 in a time-dependent manner. Cellular internalization of drug in cancer cells was analyzed using LC-MS/MS; see chromatogram: standard curve for the LC-MS/MS analysis (inset) (Supplementary Information, Fig. S7). The cellular internalization behavior of free PTX and TAP NPs are shown in Fig. 2B. The maximum PTX concentration measured was 955.24+110.13 ng/mL for 6 hours from TAP NPs in contrast to free PTX, which attained a maximum concentration of 572+33.44 ng/mL after 6 hours treatment. As seen in Fig. 2B, it is evident that the plain PTX concentration was similar at all of the tested time points, suggesting PTX concentration inside breast cancer cells was probably due to efflux by the P-gp transporters on the cell membrane. The drug concentration inside the cells increased over time with TAP NPs treatment, suggesting that significantly higher accumulation of drug was achieved (equivalent to 95.52% of drug internationalization through TAP NPs in 6 hours, whereas free PTX could only achieve a maximum of up to 57.19% in the same amount of time). A plausible mechanism for an enriched amount of PTX in the cellular compartment with TAP NPs is due to the presence of TA, which is reported to inhibit P-gp function by partly inhibiting ATPase [21]. We therefore suggest that TAP NPs provide higher drug concentration at the target, and result in improved therapeutic efficacy over that of the free drug.
Figure 2. Intracellular uptake of TAP NPs in breast cancer MDA-MB-231 cells.
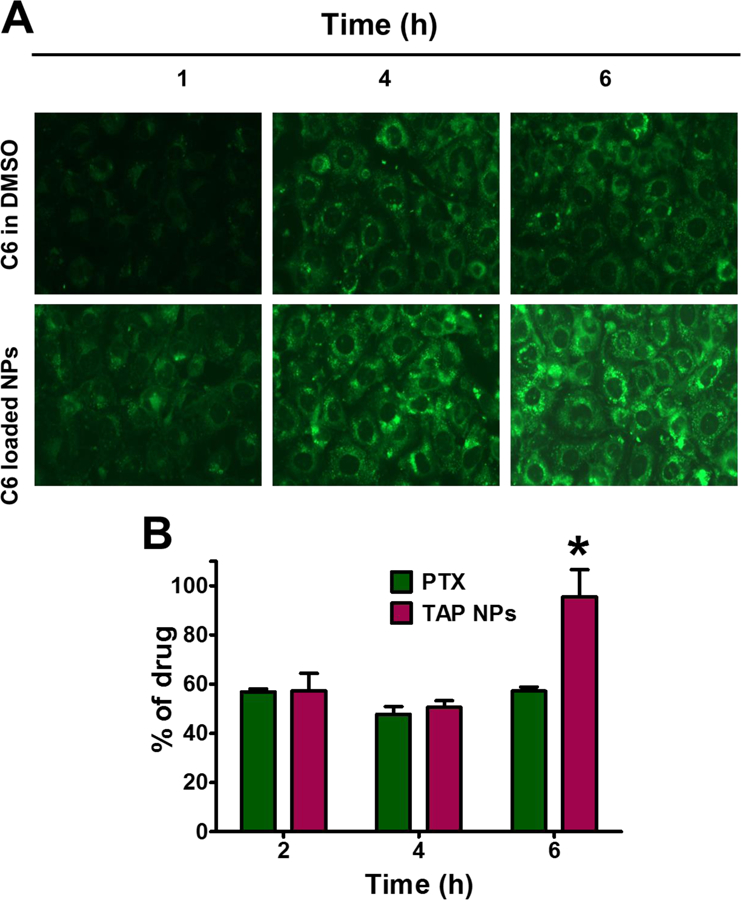
A) Cellular uptake of Coumarin 6 uptake in breast cancer MDA-MB-231 cells were confirmed by fluorescence microscopy an EVOS® 214 FL Imaging System, in a time dependent manner with dye loaded nanoparticles. B) Intracellular uptake of TAP NPs by LC-MS/MS in MDA-MB-231 after treatment with PTX and TAP NPs for 2, 4 and 6 hours. Cells were treated with PTX and TAP NPs (equivalent to 500 ng of PTX) resulting in 95.52% of drug internalization by TAP NPs in 6 hours in contrast to only 57.19% by native drug PTX for the same time. Data presented as mean ± standard error of the mean (n = 3). A Liquid chromatography–tandem mass spectrometry (LC-MS/MS) (Shimadzu Corporation, Kyoto, Japan) connected to Triple Quad 5500 tandem mass spectrometer (AB SCIEX, Framingham, MA, at a flow rate of 0.8 mL/min was used to determine drug concentration(s) in cells.
3.4. TAP NPs inhibit proliferation, clonogenic formation, migration and invasion in breast cancer cells
The MTT assay was used to evaluate in vitro cytotoxicity effects of TAP NPs and PTX (50–1.5 nmol/L equivalent) on MDA-MB-231 and MCF7 breast cancer cells after 48 hours of treatment. Untreated cells served as a positive control for the experiment. As shown in Fig. 3A, both TAP NPs and PTX exhibited a dose-dependent antiproliferative effect. After 48 hours of treatment, there was a significant reduction in IC50 values of TAP NPs compared to the native drug PTX. The IC50 values were 6.29 nmol/L and 14.34 nmol/L for TAP NPs in MDA-MB-231 and MCF7 respectively. A significant reduction in fold change of 2.62 and 1.94 in MDA-MB-231 and MCF7 was observed, respectively. This suggests TAP NPs are more potent in inhibiting the proliferation of breast cancer cells than free PTX. Fig. 3B shows a clear change in morphology of MDA-MB-231 and MCF7 on administration of TAP NPs and PTX (5 nmol/L). To further confirm the superior cell proliferation effect of TAP NPs, the clonogenic potential of MDA-MB-231 and MCF7 were determined for two weeks after treatment with TAP NPs and PTX (Fig. 4). Untreated cells and free PTX served as positive and negative control. As seen in Fig. 4A–B, there was a significant inhibition of clonogenicity with TAP NPs in contrast to PTX at all tested concentrations. To study the migratory and invasive nature of cancer cells and the effect of TAP NPs and plain PTX, we conducted the Boyden migration assay and the Matrigel invasion assay on MDA-MB-231. Cells were treated with TAP NPs and free PTX (5 and 10 nmol/L, PTX equivalent) and allowed to migrate across the Transwell inserts for 24 hours as shown in Fig. 5A–B. No obvious inhibition was seen in control (untreated cells) or blank TA treatment, whereas TAP NPs showed significant migratory inhibition over free PTX at all tested concentrations, with 1.26- and 2.96-fold inhibition at 5 and 10 nmol/L, respectively. Similar results were achieved by the Matrigel invasion assay Fig. 5C-D, where MDA-MB-231 cells were treated with 5 and 10 nmol/L of TAP NPs and PTX (PTX equivalent) for 24 hours. TAP NPs had similar inhibitory effects on invasive breast cancer cells with 46.78% and 16.27 % inhibition of cells in contrast to 64.62% and 49.53% inhibition observed with free PTX treatment at 5 and 10 nmol/L, respectively. These results suggest that TAP NPs not only deliver enhanced therapeutic benefit over the free drug, but also inhibit cell migration and invasion, or possibly limit metastasis-related death for clinical applications.
Figure 3. Anti-proliferative efficacy of TAP NPs in breast cancer cells.
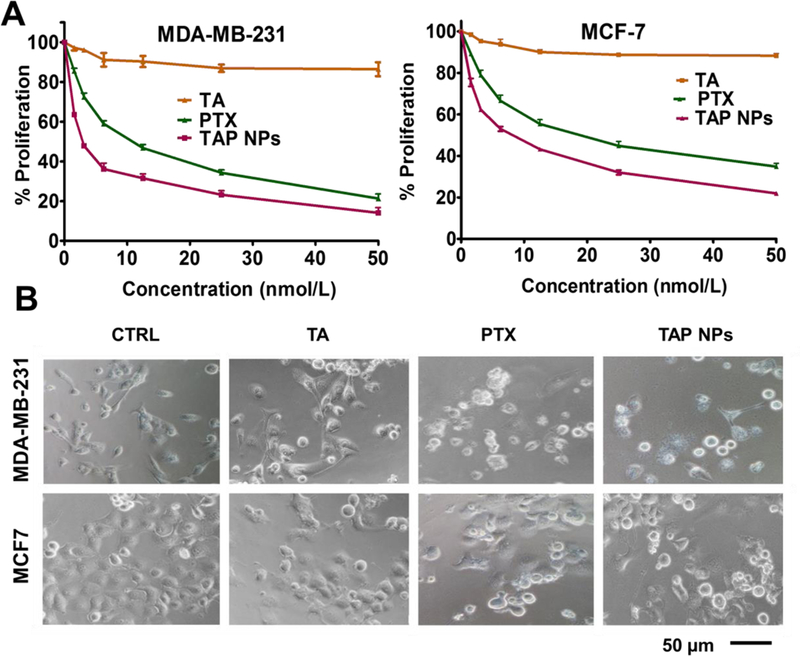
Cell proliferation measured by MTT assay. A) TAP NPs markedly decreased proliferation of breast cancer cells (MDA-MB-231 and MCF7) after treatment with 1–50 nmol/L PTX or TAP NPs (equivalent amount of drug) for 48 hours. Untreated cells were used as control. Effect of TAP NPs and PTX were assessed by MTT reagent and absorbance was recorded by a Microplate Reader (BioTeK Cytation 3, Winooski, VT, USA) at 570 nm. Data presented as mean ± standard error of the mean (n = 3). B) Bright field microscopy images after MTT analysis show significant changes in cell morphology after 48 hours treatment with TAP NPs and PTX. Imaging was done by an EVOS® FL Imaging System (20X magnification, scale = 200 μm).
Figure 4. Anti-clonogenic potency of TAP NPs.
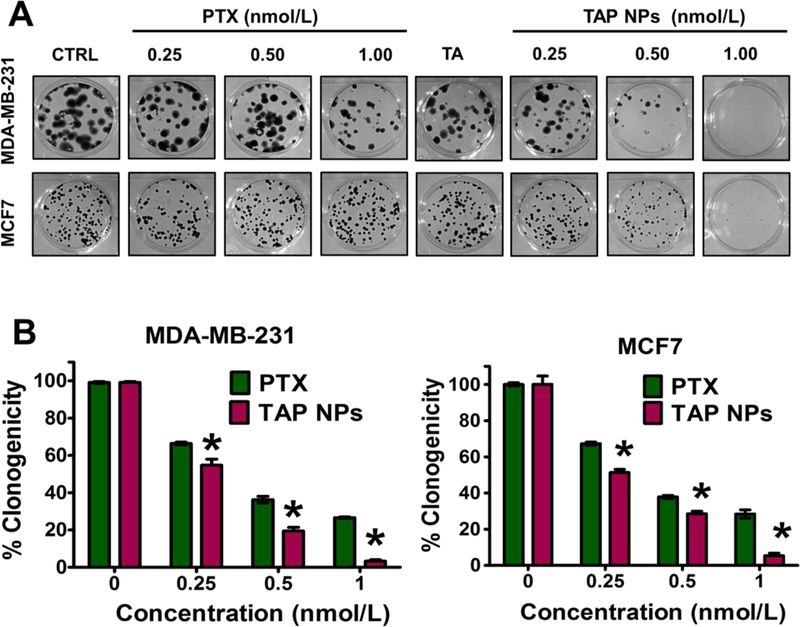
Inhibition of clonogenicity was measured by colony formation assay. A) Effect of TAP NPs and PTX (equivalent to 0.25, 0.5 and 1 nmol/L PTX) on MDA-MB-231 and MCF7 cells for 15 days were observed for the colony forming ability of breast cancer cells. Colonies were stained with hematoxylin and imaged in Multimage™ light cabinet. Data presented as mean ± standard error of the mean (n = 3). B) Number of colonies formed by each treatment groups; untreated cells (control) were considered as 100 % clonogenicity. Data presented as mean ± standard error of the mean (n = 3).
Figure 5. Anti-metastatic potential of TAP NPs.
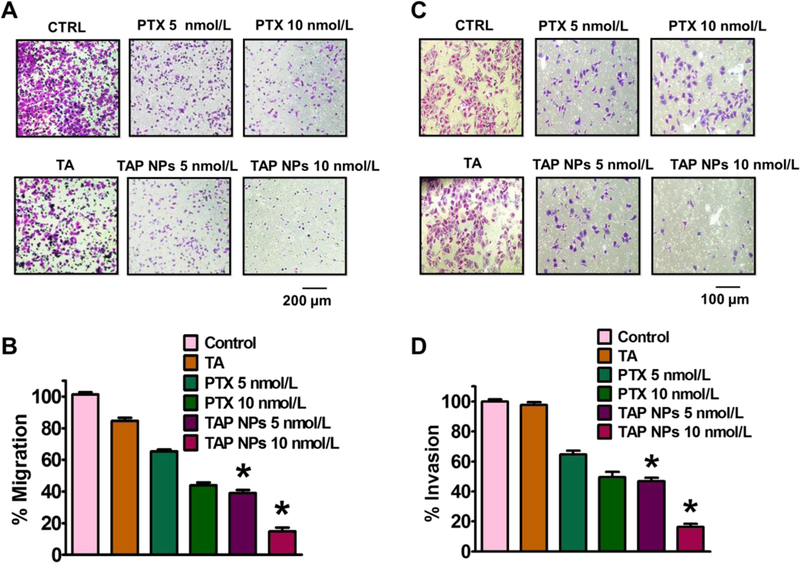
A) Migration assay to determine inhibition potential of breast cancer (MDA-MB-231) cells after exposure to 5 and 10 nmol/L of PTX or TAP NPs (PTX equivalent) for 24 hours. Migratory cells were fixed with 4% formaldehyde and stained with crystal violet and imaged using EVOS® FL Imaging System (scale = 400 µm). Representative bar graphs of the number of migratory cells with each treatment group, where untreated (control) cells served as an experimental control and was considered as 100% and other treatment groups expressed as percentage with respect to the migrated control cells. B) Matrigel Invasion assay showing similar effects, upon treatment with TAP NPs and PTX (5 and 10 nmol/L equivalent to PTX) for 24 hours. Invasive cells following incubation with PTX and TAP NPs were fixed with methanol and stained using crystal violet. Imaged using EVOS® FL Imaging System (scale = 200 μm). Percentage inhibition of invasive breast cancer cells upon treatment and data represented as a bar graph with respect to untreated (control) cells which also served as our experimental control. Data represented as mean ± standard error of the mean (n = 3).
3.5. TAP NPs lower P-gp expression in breast cancer cells
To evaluate P-gp function in cancer cells following treatment with TAP NPs and PTX, P-gp-Glo™ assay and RH123 efflux assay were performed. The P-gp-Glo assay relies on the ATP dependence of the light-generating reaction of firefly luciferase. For this experiment, Na3VO4 is used as a selective inhibitor of P-gp and Verapamil, which is a substrate for P-gp transport, and may inhibit P-gp activity by competitively interfering with the transport of other substrates [22]. Since Na3VO4 inhibits P-gp activity, less ATP is consumed, resulting in brighter signals or higher average light units (RLU). A drop in the RLU between the untreated samples (NT) and Na3VO4 indicates that the ATP consumption is normal for basal P-gp activity. Since verapamil is the substrate for P-gp transport, this process consumes more ATP and stimulates P-gp ATPase activity, evident from the low RLU observed. TA has been previously reported [21, 23] to be involved in the modulation of drug efflux, and shows similar P-gp inhibitory activity. However, higher consumption of ATP was observed, indicating PTX is being effluxed by the P-gp membrane, in contrast to TAP NPs, which are probably effluxed less due to the presence of TA in the formulation (Fig. 6A). RH123 showed an enhanced accumulation of the fluorescent dye, as shown in Figs. 6B–C. RH123 is an established substrate for evaluating the ability to inhibit P-gp mediated transport. As seen in Fig. 6C, lower accumulation occurs with free PTX treatment, probably due to high P-gp expression, which extrudes drug/dye from the cells. As predicted, higher fluorescence was observed with tannic acid, whereas TAP NPs exhibited significantly increased accumulation, suggesting that TAP NPs prevent drug efflux. This is correlated to the fact that tannic acid is known to have a chemosensitizing effect [24] on cancer cells that possess P-gp inhibitory efflux, which explains the enhanced accumulation achieved by TAP NPs. Overall, we can suggest that our TAP NPs developed for this study not only have the potential of providing enhanced therapeutic effects, but also prevent the development of drug resistance by preventing or lowering drug efflux.
Figure 6. Inhibition of drug resistance by TAP NPs.
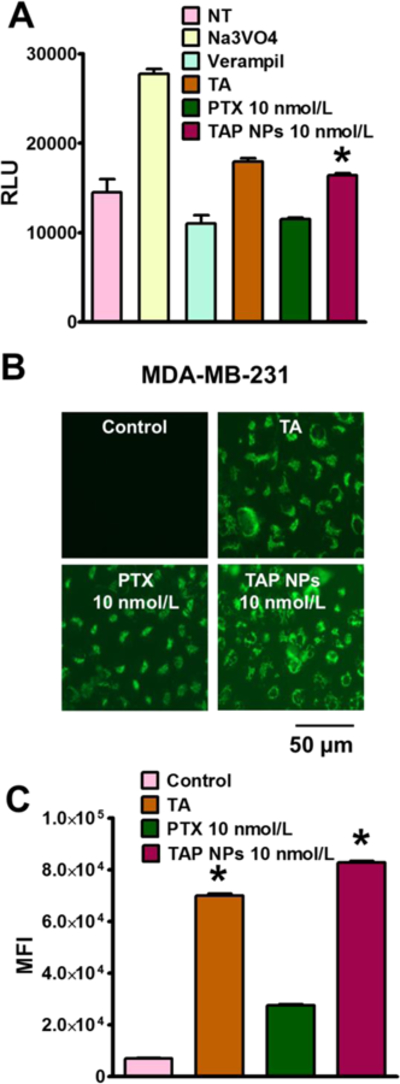
A) P-gp-Glo assay showing ATP consumption by different treatment groups having variation in average light units (RLU). Na3VO4 and Verapamil were negative and positive controls respectively, where higher ATP consumption signifies lower RLU. TAP NPs shows 1.42-fold higher RLU in contrast to native drug PTX, which is more effluxed out by the P-gp membranes. B) RH123 (2.62 µmol/L) dye shows higher accumulation in MDA-MB-231 cells after incubation for 30 min, when cells were treated for 48 hours with TAP NPs in contrast to PTX. TAP NPs exhibited significantly increased accumulation, suggesting TAP NPs prevent drug efflux. C) Mean fluorescence intensity in FL1 channel (488 excitation, Blue laser, 530 + 15 nm, FITC/GFP) was measured for different treatment groups. PTX 10 nmol/L treatment showed 3-fold lower intensity over TAP NPs (equivalent to 10 nmol/L PTX) which is probably because of higher efflux of PTX resulting in lower accumulation of RH123 (scale = 200 μm). Data presented as mean ± standard error of the mean (n = 3).
3.6. Effect of TAP NPs on microtubule stabilization, oncogenic protein expression, and microarray studies
The molecular effects which PTX or the taxane group of drugs exhibit cause the microtubules to stabilize, promoting mitotic arrest and cell death [25]. To ensure that the molecular activity of microtubule stabilization is intact in TAP NPs and to compare the apoptotic ability against PTX, tubulin stabilization assay was conducted by immunostaining and imaging via confocal microscopy. As shown in Fig. 7A, control cells show distinct microtubule bundles, which can undergo regular cellular processes such as cell division. In agreement with previous reports [26, 27], cells treated with TAP NPs and free PTX show distinct thicker microtubule bundles (more distinct at 10 nmol/L treatment). Graphical representation of the changes in fluorescent intensity was quantified using ImageJ software, and significant enhanced Mean Intensity (arbitrary units) was observed for both 5 and 10 nmol/L of TAP NPs in contrast to PTX (Fig. 7B), thus suggesting greater cytotoxic effects that TAP NPs impart on breast cancer cells. This is probably occurring because the majority of the native drug PTX is effluxed out by cancer cells, as demonstrated by the P-gp evaluation assays. This suggests that the tubulin stabilization process can inhibit mitosis, motility, and intracellular transport, eventually resulting in apoptotic cell death [25].
Figure 7. TAP NPs stabilize β-tubulins in breast cancer cells.
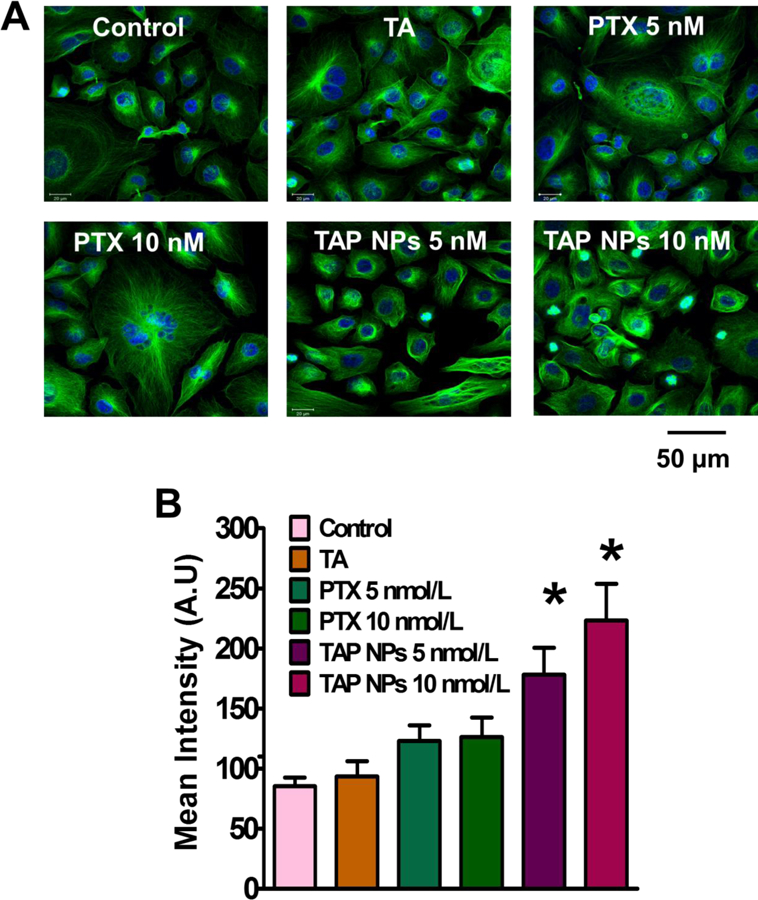
A) β-tubulin stabilization assay representing confocal images after treatment with 5 and 10 nmol/L PTX or PTX equivalent TAP NPs for 8 hours on MDA-MB-231. Distinct bundles of microtubules were seen in control cells suggesting their proliferating nature, which changed to thicker clusters of microtubules after treatment with TAP NPs and PTX, suggesting stabilization of microtubules accounting for the innate nature of the taxane drug (scale = 20 μm). B) Quantitative analysis of the florescent intensity by Image J software shows significant lower Mean Intensity (arbitrary units) in contrast to TAP NPs. Data represented as mean ± standard error of the mean (n = 3).
Further, to evaluate the effect of TAP NPs on the expression of pro-apoptotic, apoptotic, and pro-survival proteins, immunoblot analysis was conducted. As shown in Fig. 8A, the decreased expression of Bcl-xL was observed with TAP NPs treatment, whereas enhanced expression was observed for pro-apoptotic and apoptosis-associated proteins (Bad, Cleaved PARP, and Cleaved Caspase-7). Furthermore, the decreased expression of multidrug resistance (MDR) protein (no resistance developed) and increased expression of p53 (tumor suppressor protein) confirms the activation of apoptosis by TAP NPs, which induce cancerous cell death. Microarray results suggest that TAP NPs promote pro-apoptotic and inhibit anti-apoptotic gene expression validated through a heat map (Fig. 8B). Furthermore, the gene level expression of ABC family, depicting inhibition of MDR/P-gp was confirmed (Fig. 8C).
Figure 8. Molecular mechanism of TAP NPs in inducing apoptosis in breast cancer cells.
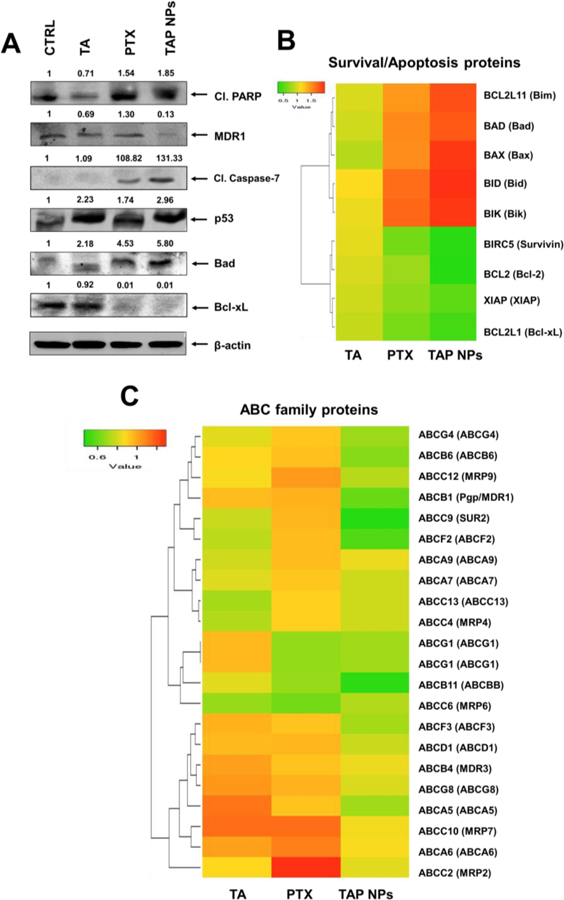
A) Western blot analysis of whole cell lysates of MDA-MB-231 that was treated with 10 nmol/L PTX or 10 nmol/L PTX equivalent TAP NPs and their respective controls for 48 hours and immunoblotted for Cleaved PARP, MDR1/ABCB1, Cleaved Caspase-7, p53, Bad, Bcl-xL and β-actin. The results were consistent in two independent sets of experiments. B) Heat map of differentially regulated gene expression of pro-apoptotic and anti-apoptotic signaling leading to apoptosis in MDA-MB-231 breast cancer cells after exposure to TAP NPs. C) Heat map representing gene expression of ABC family.
4. Discussion
Paclitaxel is a well-known potent anticancer drug used in the treatment of various cancers including breast cancer. Still, there is constant effort made towards achieving better therapeutic benefits of PTX antitumor effects in cancer. Furthermore, there is a paucity of information regarding the PTX mechanisms of action which need to be better understood. Literature evidence demonstrates nanoparticle technology plays a crucial role in the field of medicine. Currently, more than 65 nanomedicine-based formulations are FDA-approved, and enjoy widespread use in clinical applications. In chemotherapy, nanoformulations are often used to 1) minimize toxicity associated with anticancer agents, 2) enhance pharmacokinetics, pharmacodynamics, and the bioavailability of drug molecules, and 3) preferentially target, accumulate, and release drugs at the tumor site, due to the Enhanced Permeation and Retention (EPR) mechanism. Among many nanomedicines, Abraxane® is a frequently used chemotherapy in clinical practice, with about 1 billion-unit sales. This implies that PTX is still a widely used anticancer molecule in current treatment regimens. Therefore, it is apparent that a simple nanoformulation made up of a pharmaceutical excipient that has chemosensitization properties would improve therapeutic outcomes, and could greatly impact the current treatment modality.
The choice of polymer excipient dictates the physicochemical and biological properties of drug nanoformulation. Toward this end, we report in this study the preparation of PTX nanoparticles using eleven structurally different polymer excipients. Our aim is to avoid complex chemistry, and to not use organic solvents, to prevent nonspecific uptake. Self-assembly formation (through favorable particle size generation and zeta potential), efficient excipient-drug complexation (shown by fluorescence dye quenching and evaluating binding efficiency), favorable hemolysis behavior (hemoglobin release from RBC due to toxicity), and cellular uptake by cancer cells (shown by appropriate analytical methods) were successfully utilized to synthesize and choose the best formulation that could be used for a future nanomedicine for PTX drug delivery. Our screening data, from a set of eleven commonly used pharmaceutical excipients for generating PTX nanoparticles, confirmed that tannic acid is highly recommended to achieve an instantaneous self-assembly formation through hydrogen bonding and other attractive forces (Table 1, and Supplementary Figs. S1–S6).
Pharmaceutical excipients are often used to improve the aqueous solubility of various hydrophobic drugs, which can be applied for localized, oral, and parenteral (intraperitoneal or intravenous), and/or device-associated delivery methodologies. Tannic acid has been previously implemented as an anticancer and chemosensitizer [28], also to solubilize various anticancer molecules such as doxorubicin, to prevent adverse side effects of chemotherapy such as cardiotoxicity [29]. In this study, it was found that TA can efficiently bind with PTX molecules in a nanoparticle matrix, giving rise to particle sizes of less than 100 nm as seen under transmission electron microscopy. The TA matrix core allows PTX to encapsulate within the core, allowing a high encapsulation efficiency of 96.49±0.43%. A number of investigations suggest that nanoparticle formulations whose particle size is ~100 nm can be capable of penetrating deeply into tumor tissues via the EPR mechanism [30] and negatively charged nanoparticles are associated with higher cellular uptake [31]Conventional drug delivery approaches have already resulted in FDA approvals for oncology purposes.
Tannic acid is a naturally occurring polyphenol that has other potential benefits, such as being an antioxidant [32], an antiviral [33], an anti-inflammatory, and it also has chemotherapeutic potential. Our strategy of selecting tannic acid relies on the fact that since it is a PARP-1 inhibitor, it can reduce PARP-1 mediated cell death and thus causes NAD+ depletion [29, 34]. Based on this evidence, we developed tannic acid-paclitaxel nanoparticles (TAP NPs) to potentiate chemotherapeutic efficiency. The generated TAP NPs were characterized for particle size in HEPES buffer to mimic the buffering activity in the body and to have clearer insights about the in vitro effects that TAP NPs could encounter (Fig. 1B). TEM (Fig. 1C) confirms that the particle size distribution of TAP NPs is in agreement with DLS measurements (102.22±14.05 nm). To further confirm that TAP NPs maintain the functional integrity of both tannic acid and paclitaxel, spectroscopic (FTIR), thermogravimetric, and X-ray diffraction characterizations were conducted (Fig. 1D–1F), which confirm the coexistence of both components. Furthermore, a time-dependent increase in cellular internalization of dye-loaded nanoparticles (Fig. 2A) and enhanced PTX uptake into the intracellular components of cancer cells (Fig. 2B) were observed, indicating that TAP NPs may overcome P-gp efflux mechanism. This is further supported by P-gp-Glo assay and higher accumulation of RH123 (Figs. 6A–C), both of which confirmed drug efflux was significantly greater in the case of plain drug than with TAP NPs. This confirms tannic acid does have a role in inhibiting efflux by the P-gp transporters located on the surface of the cancer cells, as previously reported [16, 29].
To further demonstrate the superior anticancer ability of TAP NPs, an MTT assay was performed (Fig. 3A). The cytotoxicities of TAP NPs and PTX were compared in both of the breast cancer cell lines. Significant decreases in the IC50 values were observed with TAP NPs (Fig. 3A–B). Similar effects were observed in clonogenic assays (Fig. 4A–B). There is an impressive development in the treatments for breast cancer, yet metastasis-related recurrence is the major impediment and probably the major reason for breast cancer-related deaths. Thus, therapy resulting in inhibition of migratory signaling is an effective strategy to prevent these circumstances. Our study demonstrates that TAP NPs resulted in an enhanced inhibitory effect on both migratory and invasion properties of breast cancer cells (Figs. 5). This confirms that TAP NPs not only extend enhanced drug availability for tumor sites, but also curb metastasis as well, preventing drug resistance.
Paclitaxel causes the stabilization of polymerized microtubules in cancer cells, thus preventing cells from further proliferating. This causes mitotic cell cycle arrest. Paclitaxel is reported to inhibit growth of microtubules in MDA-MB-231, causing cell cycle arrest during mitosis [35]. Our results are consistent with literature reports which clearly show that TAP NPs can prevent drug efflux, which facilitates greater amounts of drugs reaching cancer cells due to the presence of Tannic acid This is shown by suppression of microtubule mass by TAP NPs, causing cell death probably in prophase itself, compared to free PTX, for which cell morphology suggests that cells treated with free PTX have passed prophase and could have proliferated. Our investigation suggested that TAP NPs were efficiently involved in stabilization of β-tubulin (Fig. 7) where mitotic arrest is a direct correlation of apoptotic death. An enhanced microtubule polymer mass was clearly elucidated for TAP NPs 10 nmol/L treatment, suggesting the enhanced effectiveness of TAP NPs over that of PTX. Bad is a proapoptotic protein and Bcl-xL is an anti-apoptotic protein. Bad counteracts the action of Bcl-xL, as evidenced by an immunoblotting assay (Fig. 8A). Cleaved PARP is the hallmark protein that demonstrates apoptosis. Enhanced levels of apoptosis-associated proteins (Cleaved PARP and Cleaved Caspase- 7) lead to the induction of apoptosis as demonstrated with TAP NPs exposure. The comparatively lower expression of Cleaved PARP and Cleaved Caspase-7 with PTX treatment demonstrates the synergistic effect due to the combination therapy of a PARP-1 inhibitor (tannic acid) and paclitaxel. p53 is the tumor suppressor gene that causes cell cycle arrest in the G1 or G2 phase [36]. Literature suggests drug efflux as one of the mechanisms for drug resistance, activating MDR-1 gene due to the drug treatment, which causes an overexpression of P-gp, thus inducing chances of a tumor developing drug resistance [37]. Adoption of therapeutic strategies that overcome the MDR phenomenon remain highly sought after in the clinical setting. The self-assemblies of TA and PTX complexes can alter this phenomenon, facilitating uptake of TAP NPs, which can significantly reduce the drug resistance protein MDR1, as seen in Fig. 8A. Similar results were obtained from the heat maps, showing the inhibition of MDR1 and ABC-related proteins. These results explain the profound activity of TAP NPs in contrast to native drug treatments, demonstrating the chemosensitizing ability of our formulation (Fig. 8B–C). Taken together, the data show that we have developed TAP NPs that have superior anticancer potential, prevent chances of cancer recurrence and drug resistance, and lead to apoptosis.
Altogether, this is a successful feasibility and proof-of-concept study that promises the formulation of a universal anticancer molecule through a simple self-assembly process using tannic acid. Using the polyphenolic tannic acid as a shell for the nanoparticle provides not only a potent anticancer moiety, but can also prevent cancer recurrence. This simple system resulted in an improved therapeutic outcome in cell-based breast cancer cell line models. It should be noted that this formulation is a “first generation” representative and can be further developed and optimized as a targeted nanoparticle formulation for enhanced breast cancer treatments, provided future research identifies suitable antibodies, aptamers, and peptides to modify the TAP NPs into even more active nanotherapy treatments. In our future investigations, these advanced nanoformulations will be implemented in xenograft and orthotopic tumor models.
5. Conclusion
In summary, tannic acid provides improved paclitaxel self-assembly nanoparticle formation via strong hydrogen bonding over that of ten other polymer excipients tested. This self-assembly approach offers an improved alternative strategy to generate nanoparticles using natural or small molecule excipients such as tannic acid which is classified as a Food and Drug Administration-approved pharmaceutical excipient, and is considered safe and can also be utilized to develop a potent yet non-toxic nanoparticle formulation. The TAP NPs efficiently internalized into the cytoplasm of MDA-MB-231 cells. TAP NPs mediated delivery of PTX, resulting in superior anticancer (through proliferation and clonogenic assays) and antimetastatic (through migration and invasion assays) profiles over paclitaxel alone. Additionally, TAP NPs induced greater β-tubulin stabilization in BC cells, ultimately leading to apoptosis. Microarray analysis further suggested a unique superiority of TAP NPs over free PTX in BC treatment that reconfirms our finding of superior activity imparted by TAP NPs. This correlates to the fact that native drug suffer P-glycoprotein mediated drug efflux which is the root cause of development of Multidrug resistance (MDR) [38]. This lay a solid platform for TAP NPs which can further be implemented in improving current treatment modalities for breast cancer that possess not only potent anticancer effects but extends therapeutic benefits by minimizing drug efflux [38] and off target effects. These key findings altogether indicate that tannic acid, when used to formulate effective yet nontoxic anticancer nanoparticles with drugs such as paclitaxel, has an excellent potential for translation from the bench to bedside cancer therapy.
Supplementary Material
Acknowledgments
This work presents results obtained through National Institute of Health/National Cancer Institute’s funding: K22 CA174841 and R15 CA 213232; university funding: CORNET-UTHSC, start-up funding by the College of Pharmacy, and UTHSC grants to Murali M. Yallapu. The authors are also grateful for partial support from the National Institute of Health grants R01 CA210192, R01 CA206069, and R01 CA204552.
Footnotes
Publisher's Disclaimer: This is a PDF file of an unedited manuscript that has been accepted for publication. As a service to our customers we are providing this early version of the manuscript. The manuscript will undergo copyediting, typesetting, and review of the resulting proof before it is published in its final citable form. Please note that during the production process errors may be discovered which could affect the content, and all legal disclaimers that apply to the journal pertain.
References
- [1].McGarrigle D, Shan D, Yang S, Huang X-Y, Role of tyrosine kinase Csk in G protein-coupled receptor-and receptor tyrosine kinase-induced fibroblast cell migration, Journal of Biological Chemistry 281(15) (2006) 10583–10588. [DOI] [PubMed] [Google Scholar]
- [2].Wani MC, Taylor HL, Wall ME, Coggon P, McPhail AT, Plant antitumor agents. VI. Isolation and structure of taxol, a novel antileukemic and antitumor agent from Taxus brevifolia, Journal of the American Chemical Society 93(9) (1971) 2325–2327. [DOI] [PubMed] [Google Scholar]
- [3].Wu J, Li S, Jia W, Su F, Response and prognosis of taxanes and anthracyclines neoadjuvant chemotherapy in patients with triple-negative breast cancer, Journal of cancer research and clinical oncology 137(10) (2011) 1505. [DOI] [PubMed] [Google Scholar]
- [4].Sakuma K, Kurosumi M, Oba H, Kobayashi Y, Takei H, Inoue K, Tabei T, Oyama T, Pathological tumor response to neoadjuvant chemotherapy using anthracycline and taxanes in patients with triple-negative breast cancer, Experimental and therapeutic medicine 2(2) (2011) 257–264. [DOI] [PMC free article] [PubMed] [Google Scholar]
- [5].Nguyen HN, Ha PT, Sao Nguyen A, Nguyen DT, Do HD, Thi QN, Thi MNH, Curcumin as fluorescent probe for directly monitoring in vitro uptake of curcumin combined paclitaxel loaded PLA-TPGS nanoparticles, Advances in Natural Sciences: Nanoscience and Nanotechnology 7(2) (2016) 025001. [Google Scholar]
- [6].Kris-Etherton PM, Hecker KD, Bonanome A, Coval SM, Binkoski AE, Hilpert KF, Griel AE, Etherton TD, Bioactive compounds in foods: their role in the prevention of cardiovascular disease and cancer, The American journal of medicine 113(9) (2002) 71–88. [DOI] [PubMed] [Google Scholar]
- [7].Parzel C, Tannic Acid Crosslinked Collagens and Potential for Breast Tissue Engineering, (2006). [Google Scholar]
- [8].Jackson JK, Letchford K, The Effective Solubilization of Hydrophobic Drugs Using Epigallocatechin Gallate or Tannic Acid-Based Formulations, Journal of pharmaceutical sciences 105(10) (2016) 3143–3152. [DOI] [PubMed] [Google Scholar]
- [9].Yallapu MM, Chauhan N, Othman SF, Khalilzad-Sharghi V, Ebeling MC, Khan S, Jaggi M, Chauhan SC, Implications of protein corona on physico-chemical and biological properties of magc nanoparticles, Biomaterials 46 (2015) 1–12. [DOI] [PMC free article] [PubMed] [Google Scholar]
- [10].Kumar BP, Puvvada N, Rajput S, Sarkar S, Das SK, Emdad L, Sarkar D, Venkatesan P, Pal I, Dey G, Sequential release of drugs from hollow manganese ferrite nanocarriers for breast cancer therapy, Journal of Materials Chemistry B 3(1) (2015) 90–101. [DOI] [PubMed] [Google Scholar]
- [11].Chowdhury P, Nagesh PK, Khan S, Hafeez BB, Chauhan SC, Jaggi M, Yallapu MM, Development of polyvinylpyrrolidone/paclitaxel self-assemblies for breast cancer, Acta Pharmaceutica Sinica B (2017). [DOI] [PMC free article] [PubMed]
- [12].MacCallum DK, Lillie JH, Scaletta LJ, Occhino JC, Frederick WG, Ledbetter SR, Bovine corneal endothelium in vitro: elaboration and organization of a basement membrane, Experimental cell research 139(1) (1982) 1–13. [DOI] [PubMed] [Google Scholar]
- [13].Hafeez BB, Ganju A, Sikander M, Kashyap VK, Hafeez ZB, Chauhan N, Malik S, Massey AE, Tripathi MK, Halaweish FT, Zafar N, Singh MM, Yallapu MM, Chauhan SC,Jaggi, Ormeloxifene Suppresses Prostate Tumor Growth and Metastatic Phenotypes via Inhibition of Oncogenic beta-catenin Signaling and EMT Progression, Molecular cancer therapeutics 16(10) (2017) 2267–2280. [DOI] [PMC free article] [PubMed] [Google Scholar]
- [14].Nadakavukaren KK, Nadakavukaren JJ, Chen LB, Increased rhodamine 123 uptake by carcinoma cells, Cancer research 45(12 Part 1) (1985) 6093–6099. [PubMed] [Google Scholar]
- [15].Karthik S, Kumar BP, Gangopadhyay M, Mandal M, Singh NP, A targeted, image-guided and dually locked photoresponsive drug delivery system, Journal of Materials Chemistry B 3(5) (2015) 728–732. [DOI] [PubMed] [Google Scholar]
- [16].Jaggi M, Rao PS, Smith DJ, Wheelock MJ, Johnson KR, Hemstreet GP, Balaji K, E-cadherin phosphorylation by protein kinase D1/protein kinase Cμ is associated with altered cellular aggregation and motility in prostate cancer, Cancer research 65(2) (2005) 483–492. [PubMed] [Google Scholar]
- [17].Bharti R, Dey G, Banerjee I, Dey KK, Parida S, Kumar BP, Das CK, Pal I, Mukherjee M, Misra M, Somatostatin receptor targeted liposomes with Diacerein inhibit IL-6 for breast cancer therapy, Cancer letters 388 (2017) 292–302. [DOI] [PubMed] [Google Scholar]
- [18].Nagesh PK, Hatami E, Chowdhury P, Kashyap VK, Khan S, Hafeez BB, Chauhan SC, Jaggi M, Yallapu MM, Tannic Acid Induces Endoplasmic Reticulum Stress-Mediated Apoptosis in Prostate Cancer, Cancers 10(3) (2018) 68. [DOI] [PMC free article] [PubMed] [Google Scholar]
- [19].Khan S, Chauhan N, Yallapu MM, Ebeling MC, Balakrishna S, Ellis RT, Thompson PA, Balabathula P, Behrman SW, Zafar N, Nanoparticle formulation of ormeloxifene for pancreatic cancer, Biomaterials 53 (2015) 731–743. [DOI] [PMC free article] [PubMed] [Google Scholar]
- [20].Aromal SA, Philip D, Facile one-pot synthesis of gold nanoparticles using tannic acid and its application in catalysis, Physica E: Low-dimensional Systems and Nanostructures 44(7–8) (2012) 1692–1696. [Google Scholar]
- [21].Kitagawa S, Nabekura T, Nakamura Y, Takahashi T, Kashiwada Y, Inhibition of P‐ glycoprotein function by tannic acid and pentagalloylglucose, Journal of pharmacy and pharmacology 59(7) (2007) 965–969. [DOI] [PubMed] [Google Scholar]
- [22].Litman T, Zeuthen T, Skovsgaard T, Stein WD, Competitive, non-competitive and cooperative interactions between substrates of P-glycoprotein as measured by its ATPase activity, Biochimica et Biophysica Acta (BBA)-Molecular Basis of Disease 1361(2) (1997) 169–176. [DOI] [PubMed] [Google Scholar]
- [23].Naus PJ, Henson R, Bleeker G, Wehbe H, Meng F, Patel T, Tannic acid synergizes the cytotoxicity of chemotherapeutic drugs in human cholangiocarcinoma by modulating drug efflux pathways, Journal of hepatology 46(2) (2007) 222–229. [DOI] [PMC free article] [PubMed] [Google Scholar]
- [24].Shen M, Hang Chan T, Ping Dou Q, Targeting tumor ubiquitin-proteasome pathway with polyphenols for chemosensitization, Anti-Cancer Agents in Medicinal Chemistry (Formerly Current Medicinal Chemistry-Anti-Cancer Agents) 12(8) (2012) 891–901. [DOI] [PMC free article] [PubMed] [Google Scholar]
- [25].Bollag DM, McQueney PA, Zhu J, Hensens O, Koupal L, Liesch J, Goetz M, Lazarides E, Woods CM, Epothilones, a new class of microtubule-stabilizing agents with a taxol-like mechanism of action, Cancer research 55(11) (1995) 2325–2333. [PubMed] [Google Scholar]
- [26].Su W-P, Cheng F-Y, Shieh D-B, Yeh C-S, Su W-C, PLGA nanoparticles codeliver paclitaxel and Stat3 siRNA to overcome cellular resistance in lung cancer cells, International journal of nanomedicine 7 (2012) 4269. [DOI] [PMC free article] [PubMed] [Google Scholar]
- [27].Geldenhuys W, Mbimba T, Bui T, Harrison K, Sutariya V, Brain-targeted delivery of paclitaxel using glutathione-coated nanoparticles for brain cancers, Journal of drug targeting 19(9) (2011) 837–845. [DOI] [PubMed] [Google Scholar]
- [28].Galati G, O’brien PJ, Potential toxicity of flavonoids and other dietary phenolics: significance for their chemopreventive and anticancer properties, Free Radical Biology and Medicine 37(3) (2004) 287–303. [DOI] [PubMed] [Google Scholar]
- [29].Tikoo K, Sane MS, Gupta C, Tannic acid ameliorates doxorubicin-induced cardiotoxicity and potentiates its anti-cancer activity: potential role of tannins in cancer chemotherapy, Toxicology and applied pharmacology 251(3) (2011) 191–200. [DOI] [PubMed] [Google Scholar]
- [30].Huo S, Ma H, Huang K, Liu J, Wei T, Jin S, Zhang J, He S, Liang X-J, Superior penetration and retention behavior of 50 nm gold nanoparticles in tumors, Cancer research (2012). [DOI] [PubMed]
- [31].Fröhlich E, The role of surface charge in cellular uptake and cytotoxicity of medical nanoparticles, International journal of nanomedicine 7 (2012) 5577. [DOI] [PMC free article] [PubMed] [Google Scholar]
- [32].Varanka Z, Rojik I, Varanka I, Nemcsók J, Ábrahám M, Biochemical and morphological changes in carp (Cyprinus carpio L.) liver following exposure to copper sulfate and tannic acid, Comparative Biochemistry and Physiology Part C: Toxicology & Pharmacology 128(3) (2001) 467–477. [DOI] [PubMed] [Google Scholar]
- [33].Zhao X, Sun H, Hou A, Zhao Q, Wei T, Xin W, Antioxidant properties of two gallotannins isolated from the leaves of Pistacia weinmannifolia, Biochimica et Biophysica Acta (BBA)-General Subjects 1725(1) (2005) 103–110. [DOI] [PubMed] [Google Scholar]
- [34].Formentini L, Arapistas P, Pittelli M, Jacomelli M, Pitozzi V, Menichetti S, Romani A, Giovannelli L, Moroni F, Chiarugi A, Mono‐galloyl glucose derivatives are potent poly (ADP‐ribose) glycohydrolase (PARG) inhibitors and partially reduce PARP‐1‐dependent cell death, British journal of pharmacology 155(8) (2008) 1235–1249. [DOI] [PMC free article] [PubMed] [Google Scholar]
- [35].Zasadil LM, Andersen KA, Yeum D, Rocque GB, Wilke LG, Tevaarwerk AJ, Raines RT, Burkard ME, Weaver BA, Cytotoxicity of paclitaxel in breast cancer is due to chromosome missegregation on multipolar spindles, Science translational medicine 6(229) (2014) 229ra43–229ra43. [DOI] [PMC free article] [PubMed] [Google Scholar]
- [36].Sankala HM, Hait NC, Paugh SW, Shida D, Lépine S, Elmore LW, Dent P, Milstien S,Spiegel S, Involvement of sphingosine kinase 2 in p53-independent induction of p21 by the chemotherapeutic drug doxorubicin, Cancer research 67(21) (2007) 10466–10474. [DOI] [PubMed] [Google Scholar]
- [37].Holohan C, Van Schaeybroeck S, Longley DB, Johnston PG, Cancer drug resistance: an evolving paradigm, Nature Reviews Cancer 13(10) (2013) 714. [DOI] [PubMed] [Google Scholar]
- [38].Chavanpatil MD, Patil Y, Panyam J, Susceptibility of nanoparticle-encapsulated paclitaxel to P-glycoprotein-mediated drug efflux, International journal of pharmaceutics 320(1–2) (2006) 150–156. [DOI] [PubMed] [Google Scholar]
Associated Data
This section collects any data citations, data availability statements, or supplementary materials included in this article.