FIG 3.
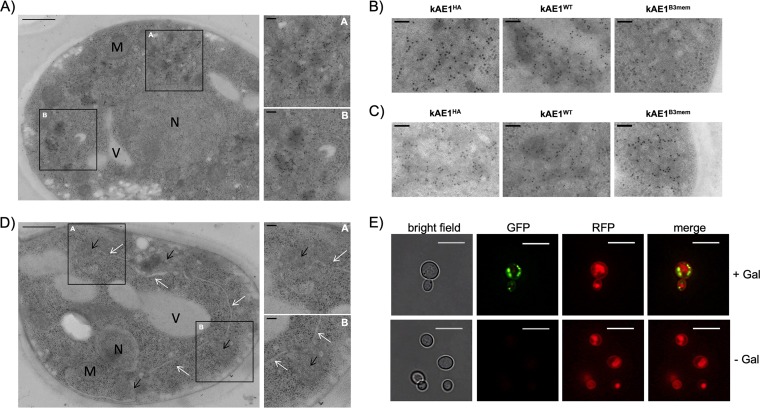
kAE1 accumulates in intracellular membrane/vesicle-like structures. (A) TEM-immunogold labeling of kAE1 protein. The TEM images show typical MV-like structures induced by kAE1HA expression in Δend3 cells. Bar, 500 nm. Insets A and B show a magnified area of the marked regions (black box). Bar, 100 nm. M, membrane; N, nucleus; V, vacuole. (B and C) Accumulation of various kAE1 fusion proteins in Δend3 (B) and Δpep4 (C) cells. Bar, 100 nm. (D) MV-like structures (black arrows) are directly associated with typical ER structures (white arrows). Bar, 500 nm. Insets A and B show magnified areas of the marked regions (black box). Bar, 100 nm. (E) Fluorescence microscopy images of wild-type cells expressing N-terminal GFP-tagged kAE1 together with RFP-tagged Pma1p. GFP signals mainly localized in intracellular structures and did not colocalize with the red Pma1p signals located in the PM and vacuole (note that internalized Pma1p-RFP is transported to the vacuole, which allows vacuole staining). Bar, 10 μm.

