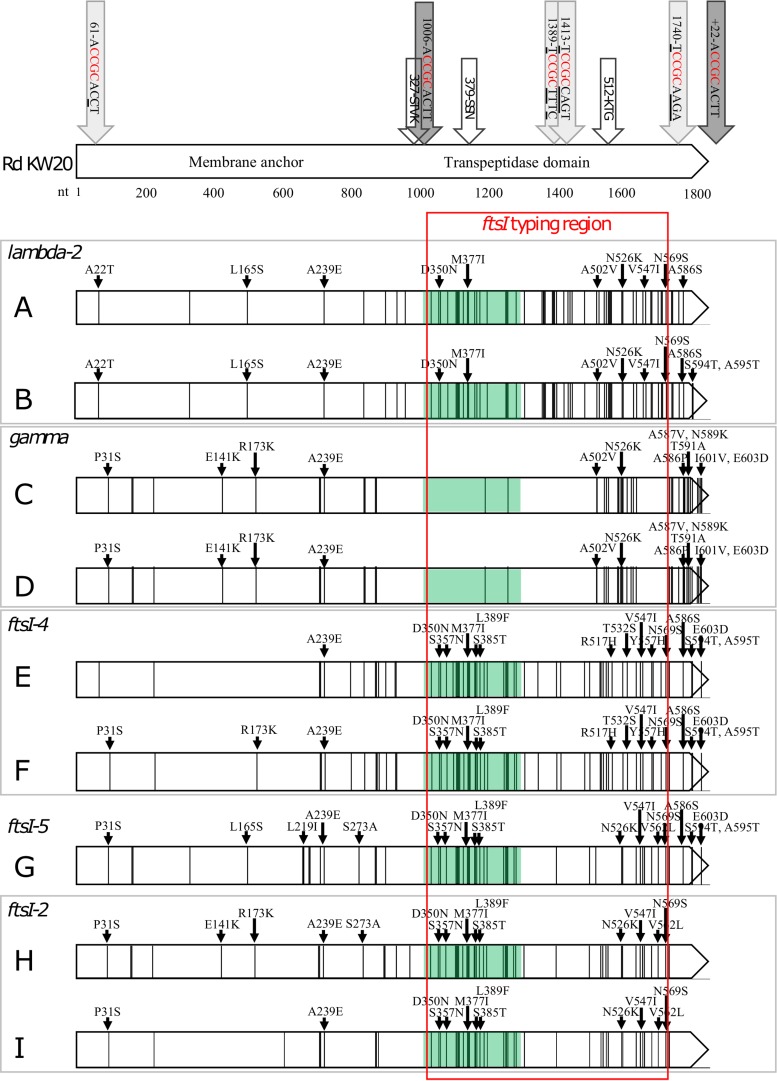
FIG 5.
DNA mutations and amino acid substitutions in the ftsI gene (nt 1 to 1833) of strains A to I compared to Rd KW20. Isolates G2 and G3 share identical ftsI genes with strain G and are therefore not included in the figure. Each vertical line represents a SNP. Black small arrows point to where amino acid differences occur. The light gray arrows pointing at the Rd KW20 gene represent USS variants with minor mismatches compared to the USS consensus sequence (dark gray arrows) (27). White arrows indicate the conserved STVK, SSN, and KTG motifs. The ftsI typing region (nt 1010 to 1719) and SSN-near region (nt 1006 to 1295) are shown by red frame and green shading, respectively. Strains with identical ftsI types are framed in gray. For a more detailed presentation of the SSN-near region, see Table S1 and Fig. S2 to S4 in the supplemental material.

