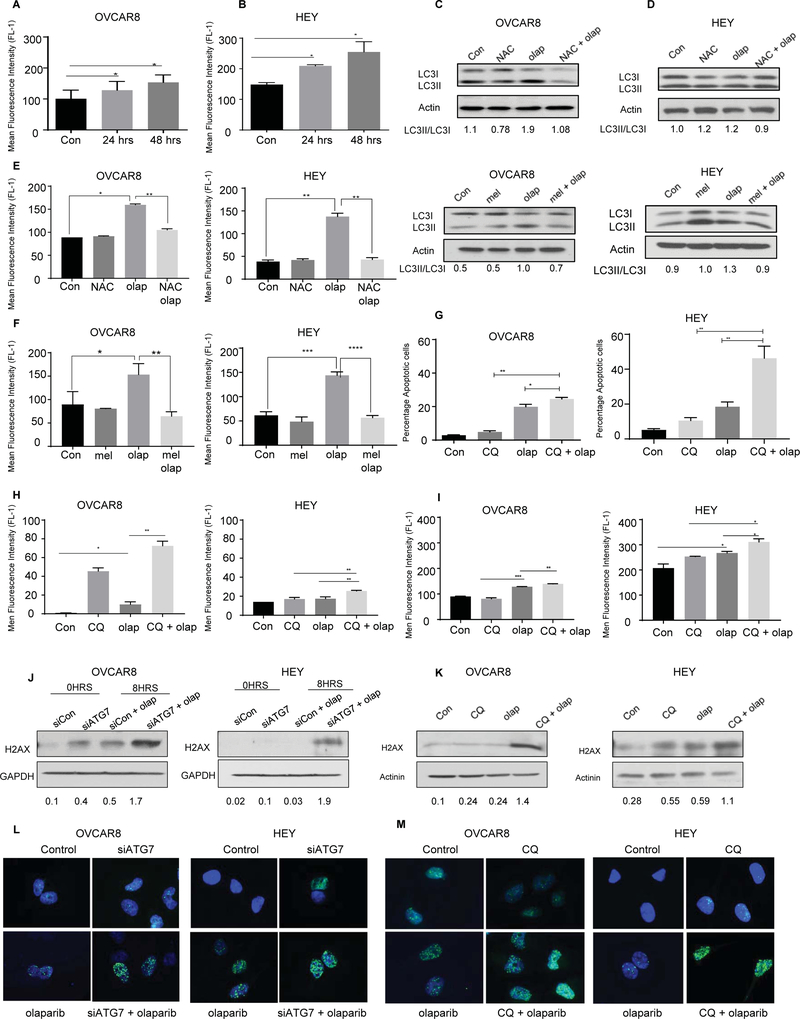
Figure 5. Olaparib Induces formation of ROS.
A and B. OVCAR 8 and HEY ovarian cancer cells were treated with olaparib (5 uM) for 24 and 48 hours and assayed for ROS production. The attached cells were stained with 5 mM H2DCFDA, collected and analyzed by flow cytometry. C and D. Western blot for conversion of LC3-I to LC3II after treatment with NAC (10 mM), or melatonin (MEL) (10 μM) or in combination with olaparib (5 μM). E and F. Flow cytometry analysis of ROS after treatment with NAC or melatonin in combination with olaparib. G and H. Cells were treated with olaparib alone, CQ alone, or CQ combined with olaparib for 96 hours. After incubation with Annexin V-FITC in a buffer containing propidium iodide or H2DCFDA, cells were analyzed using flow cytometry for Apoptosis or ROS. I. Evaluation of apoptosis after Knockdown of ATG7. Western blot (J-K) and fluorescence staining (L-M) were performed to evaluate expression of ɣ-H2AX after ATG5/7 knockdown or CQ treatment. Data represents results from at least three experiments.

