Abstract.
The focus of this work is toward the development of a point-of-care (POC) handheld technology for the noninvasive early detection of salivary biomarkers. The initial of focus was the detection and quantification of S100 calcium-binding protein P (S100P) mRNA found in whole saliva for use as a potential biomarker for oral cancer. Specifically, a surface-enhanced Raman spectroscopy (SERS)-based approach and assay were designed, developed, and tested for sensitive and rapid detection of S100P mRNA. Gold nanoparticles (AuNPs) were conjugated with oligonucleotides and malachite green isothiocyanate was then used as a Raman reporter molecule. The hybridization of S100P target to DNA-conjugated AuNPs in sandwich assay format in both free solution and a vertical flow chip (VFC) was confirmed using a handheld SERS system. The detection limit of the SERS-based assay in free solution was determined to be 1.1 nM, whereas on the VFC the detection limit was observed to be 10 nM. SERS-based VFCs were also used to quantify the S100P mRNA from saliva samples of oral cancer patients and a healthy group. The result indicated that the amount of S100P mRNA detected for the oral cancer patients is three times higher than that of a healthy group.
Keywords: S100P mRNA, surface-enhanced Raman spectroscopy, vertical flow assay, oral cancer
1. Introduction
Oral cancer, of which more than 90% is oral squamous cell carcinoma (OSCC), is the world’s sixth most common cancer.1 According to the World Health Organization, it has been estimated that each year the number of new cases of oral cancer is 529,000 with more than 300,000 deaths.2 OSCC survival rates are strongly dependent on the stage at diagnosis. When the disease is at stages III and IV, OSCC can be metastasized and the 5-year survival rate for the patients remains at to 64% despite an aggressive therapy of chemotherapeutic agents with radiation.3 Thus, early diagnosis of oral cancer is important to improve the therapy.4 The most common way to diagnose OSCC is through regular check-up by a dentist; if something is detected, then oral tissue biopsy is performed followed by a lab test. However, systematic review and meta-analysis have revealed that clinical examination alone may not be sufficient for the clinician to perform a biopsy or refer for biopsy for early detection of OSCC.5,6
The use of salivary biomarkers is a promising noninvasive approach for prescreening of early OSCC due to its advantages, including noninvasive and easy sample collection, compared to blood samples.7 Although many salivary biomarker candidates for OSCC have been reported, most of them have not been validated, and it remains unclear whether common chronic oral inflammatory diseases such as periodontitis (gum disease) may affect the levels of these potential OSCC salivary biomarkers, which can cause a false-positive result. Cheng et al.8 have found that salivary S100 calcium-binding protein P (S100P) mRNA is a reliable biomarker for OSCC regardless of the presence of chronic periodontitis, and the level of S100P mRNA is about 2.5-fold higher in saliva for OSCC patients than for healthy controls and chronic periodontitis patients (smokers and nonsmokers). Therefore, a noninvasive early detection technology based on this salivary biomarker could potentially provide a prescreening diagnostic value for OSCC at the point-of-care (POC), facilitating better detection and potentially reducing the number of biopsies.
Existing gold standards for detecting mRNA are northern blots, quantitative nuclease protection assay, enzyme-linked immunosorbent assay, and reverse transcription polymerase chain reaction (RT-PCR).9,10 They have been widely used in various areas. However, these approaches have limitations for POC devices, due to time-consuming sample preparation, laboratory-based testing requiring skillful operators, and lower sensitivity. RT-PCR with preamplification mode has been used for quantitative detection of S100P mRNA from patient saliva.11–13 Although high amplification has been employed to overcome the low-sensitivity issue, the amplification mode is not always available in real samples.14 Paper-based fluidics are a useful tool in rapid diagnostics at the POC, owing to the simplicity of the sample preparation, ability to employ rapid analysis, and its low-cost fabrication method. For example, the most common paper fluidic POC devices are at-home pregnancy testing, influenza, and HIV tests.15–17 They are based on a colorimetric technique that results in a yes/no diagnosis based on the color changes from the small paper strip using visual inspection. However, since colorimetric-based paper fluidics are designed to produce semiquantitative information, they are not desirable for detecting low-concentration targets. To resolve this problem, optical reader systems need to be adopted. One of the most common optical readers uses a fluorescence technique for measuring color intensities on the test strip. Unfortunately, it still often has a lack of sensitivity.18
Surface-enhanced Raman spectroscopy (SERS) has received a lot of attention as a promising analytical technique for detection of biomarkers due to its high sensitivity.19,20 When a Raman active molecule (i.e., reporter molecule) is absorbed on or is within 3 nm from a metal surface (i.e., silver, gold, copper, etc.), its Raman signal is significantly enhanced due to the electromagnetic and chemical effects. This signal can be further enhanced by the aggregation of these colloidal nanoparticles; which produce regions of high-localized electromagnetism known as “hot spots.” SERS can produce strong intensities up to 6 to 14 orders of magnitude higher than that of Raman scattering.21,22 The dramatic enhancement of SERS signal makes it useful for detecting low-target concentrations. This potential for high sensitivity has driven SERS to be used for potential applications to biosensing, diagnostics, and medical imaging.23–25 This rapid growth of SERS in the biomedical area has also resulted from the advancements in lower cost lasers and optics yielding smaller sized, handheld systems that can include a range of laser wavelengths that cover the biological red to nearinfrared optic window (600 to 1200 nm), which can be used to penetrate deeper into tissue but also minimize the autoflorescence background signal inherent in biological samples that would need to be measured in a POC device. Further, based on the accepted criteria for a POC device (“ASSURED”-affordable, sensitive, specific, user-friendly, rapid, equipment-free, and deliverable) provided by the World Health Organization, SERS has the potential for use as a diagnosis tool when coupled with a paper-based immunoassay that can be configured for repeatability.14,26,27 For example, SERS-based lateral flow immunoassays have been developed for the quantitative detection of biomarkers including hormones, DNA, and protein.28–30 To achieve high sensitivity, they used Raman reporter-embedded gold nanoparticles (AuNPs) conjugated with DNA aptamers or antibodies to recognize the biomarkers in a sandwich formation. Furthermore, Choo’s group published a paper on the use of a SERS-based immunoassay for HIV-1 DNA detection and reported that the assay sensitivity is at least 1000 times higher than colorimetric or fluorescent detection methods.29
To detect S100p mRNA using a SERS-based paper fluidic approach at the POC, a rapid platform to filter, concentrate, and capture the analyte from the complex media (i.e., saliva) is desired. In this research, AuNPs were employed as a SERS substrate due to their high SERS enhancement effect, easy preparation, and straightforward surface modification.31,32 AuNPs were conjugated with two separate DNA oligonucleotides (i.e., “left” and “right” probes) for the interaction with S100P mRNA as a sandwich assay since oligonucleotides showed easy conjugation and stability on the surface of AuNPs, strong affinity to the target, and high specificity.33,34 Malachite green isothiocynate (MGITC) was used as the Raman reporter molecule (RRM) and attached on the AuNPs “left” probes. DNA oligomer-conjugated AuNPs were employed on the vertical flow (VF) assay for quantification of S100P mRNA using the SERS measurement.
2. Materials and Method
2.1. Materials
MGITC RRM was purchased from Life Technologies®. Gold (III) chloride trihydrate (), trisodium citrate, tris (2-carboxyethyl) phosphine hydrochloride (TCEP), sodium chloride (NaCl), Tris–HCl buffer (pH 7.5), phosphate buffer saline (PBS), and sodium phosphate () were purchased from Sigma Aldrich. The 3K Da nanoseps were purchased from Pall Corporation and the ultrapure distilled water from Invitrogen. The DNA oligonucleotide probes and target mRNA were purchased from IDT-DNA (St. Luis, Missouri) and had the following sequences: the “left” DNA strand, “5ThioMC6-D/iSp9/GCCAGTGGGACATTTTCTCGGCCC”; the “right” strand, “TGCCAGCCCCCAGGAGGAAGGTGG/iSp9/5ThioMC6-D”; the corresponding target S100P mRNA, 5′-CCA CCU UCC UCC UGG GGG CUG GCA GGG CCG AGA AAA UGU CCC ACU GGC-3′; noncomplimentary target, 5′-GAG UCC UGC CUU CTC AAA GUA CUU GUG ACA GGC AGA CGU GAU UGC AGC-3′; and Cy5-tagged “left” DNA strand “5ThioMC6-D/iSp9/GCCAGTGGGACATTTTCTCGGCCCCy5.”
A Tecan Infinite® M200 PRO microplate reader (Switzerland) was used to measure the localized surface plasmon resonance (LSPR) for the size and concentration of the synthesized particles with a scan range of 240 to 800 nm and fluorescence for quantification of DNA oligomers on AuNPs. SERS measurements were collected using a handheld Raman spectroscopy instrument (IDRaman mini 2.0) equipped with a laser wavelength of 638 nm (Ocean Optics).
2.2. Saliva Sample Collection
Patients who had newly diagnosed OSCC and healthy controls were recruited during the period from August 1, 2013 to March 30, 2015, from the dental clinics at the Texas A&M University College of Dentistry (TAMUCOD) in Dallas. Groups were defined as follows:
-
1.
Group M, OSCC: patients with newly diagnosed OSCC, saliva collected before any treatment was started.
-
2.
Group T, healthy controls: individuals who had no moderate or severe periodontitis and no oral mucosal disease or lesions (such as, oral lichen planus, geographic tongue, candidiasis, or aphthous ulcers).
The inclusion and exclusion criteria for each group of participants and the rationale for these criteria have been delineated in our previous work.8 The recruitment protocol used was approved by the Institutional Review Board of TAMUCOD, and informed consent was obtained from each participant prior to saliva collection.
Unstimulated whole saliva samples were collected between 6 am and 12 am, using previously described methods.35 Briefly, subjects were asked to not eat, drink, or perform any kind of oral hygiene procedures prior to saliva collection. Just before saliva collection, a cup of water was given to participants for rinsing. Five minutes after rinsing, participants were asked to spit into a 50-ml sterile plastic tube kept in ice. A maximum of 8 ml of saliva was collected within 30 min.
Saliva samples were processed immediately after collection according to a previously published method.13 Briefly, the saliva samples were centrifuged at 2600g (2.6 k rcf) for 15 min, at 4°C. The supernatant was separated from the pellet, and the RNase inhibitor (Superase-In, Ambion Inc., Austin, Texas) was added to the supernatant at a concentration of Superase-In/ml of supernatant. All samples were stored at in aliquots until further use.
2.3. Synthesis of Gold Nanoparticles
AuNPs were synthesized using the method reported by Puntes.36 49 ml of deionized water was allowed to be heated during vigorous stirring. When the solution reached 100°C, 1 ml of 110 mM trisodium citrate was injected into the flask and the solution temperature was maintained at 100°C for 2 min, followed by the addition of of 25 mM . After 15 min, the temperature was set to 90°C and the reaction occurred for 1 h. The color of the solution transitioned from translucent to pale red to dark red. If size is small, of 60 mM trisodium citrate was added. After 2 min, of 25 mM was injected to the same reaction vessel. This seeded growth step was completed after 1 h. This process was repeated as necessary. The AuNPs solution was then allowed to cool to room temperature and later stored at 4°C prior to further use.
The concentration of AuNPs was estimated using a UV–vis measurement to be 1.7 nM. Transition electron microscopy (TEM) images were also taken using JEOL JEM-2010 TEM to confirm the AuNPs’ size.
2.4. Oligonucleotide/RRM Conjugation
of DNA strand solutions were treated with of 20 mM TCEP in Tris–HCl buffer (pH 7.5) for an hour at room temperature and were purified to remove residual TCEP via a 3k Da Nanoseps® desalting centrifuge column. The solution were redispersed in PBS (pH 7.4) and stored at 4°C.
Both left and right strands were added to AuNPs at a molar ratio of 130:1 and 250:1, respectively. They were incubated overnight and the concentration of NaCl is increased to 0.2 M of NaCl. The solutions were further incubated for 24 h. The probes were then washed three times by centrifuging. The supernatant was replaced with 1 ml of PBS (pH 7.4).
After conjugation of the DNA probes, MGITC was added at a molar ratio of 250:1 (MGITC to AuNPs) to the left DNA-conjugated probes. The mixture was incubated for 1 h via shaking and was then washed via centrifugation three times and stored in PBS buffer solution (pH 7.4). The amount of DNA probes was quantified using Cy5-tagged left DNA probes. After incubating Cy5-tagged DNA with AuNPs (130:1 ratio to DNA:AuNP), loading DNA on AuNPs was determined by using a 30K Da molecular weight cutoff spin column to separate the Cy5-DNA-conjugated AuNPs from free Cy5-tagged DNA since DNA-conjugated AuNPs are too large to pass through the column while the free DNA is collected on the bottom of the column. Both of the free Cy5-DNA probes collected and their standard solutions of free Cy5-DNA oligomers were measured using fluorescence spectroscopy (633-nm excitation laser and 662 emission) to quantify free DNA probes. To investigate the amount of MGITC to DNA-conjugated AuNPs, the free MGITC molecules were separated from MGITC-DNA-AuNPs using 30K Da molecular weight spin column. The free MGITC collected was mixed with 1.5 nM AuNPs. SERS spectra of the free MGITC solution and their standard solution were recorded using the handheld Raman spectrometer with a 638-nm excitation laser.
2.5. Vertical Flow Assay Assembly
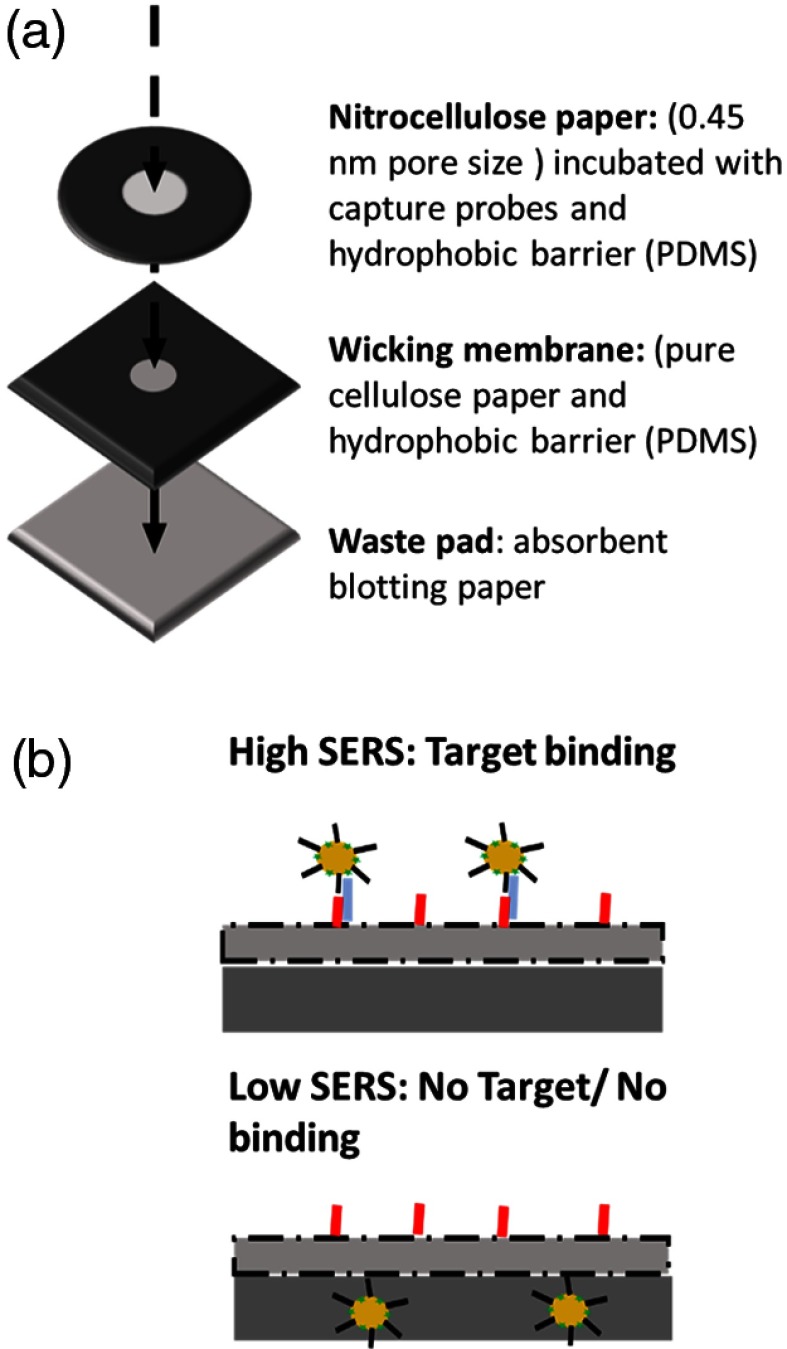
The VF assay was designed with the use of three paper fluidic layers as shown in Fig. 1(a). First, of streptavidin solution was dropped inside of hydrophobic barrier of the nitrocellulose membrane followed by adding of biotin-right DNA oligomer strand in PBS buffer (1:4 ratio of streptavidin and biotin-right DNA). This membrane was then allowed to dry at room temperature for an hour followed by PBS wash and an additional hour of drying following the wash. While the nitrocellulose paper was drying, the other layers were assembled as follows: (1) the second layer (i.e., the wicking membrane) was designed to be diameter circle surrounded by PDMS boundaries. (2) The last layer (i.e., the waste pad) consisted of an absorbent blotting paper; which was used to collect all unbound waste material. Finally, all three layers were attached together using 3M double-sided adhesive tape (#444).
Fig. 1.
Schematic illustration of (a) VFA composing of three paper layers and (b) VFA biosensor for S100P mRNA detection.
2.6. SERS Measurements for Free Solution and VF Assay Analysis of Saliva Samples for S100P mRNA Detection
To measure SERS signals for S100P mRNA in free solution, the same concentrations (1.5 nM) of left and right DNA-conjugated AuNPs were mixed and incubated in PBS containing 0.3M NaCl with S100P mRNA for 1 h at room temperature. SERS spectra of the samples were collected using the handheld Raman instrument (IDRaman mini 2.0) equipped with a laser wavelength of 638 nm (Ocean Optics) in raster scanning mode, with five-level laser power, and laser spot size of 2 mm.
To record the SERS signals of VF assay, 1:1 volume ratio of mixture solution containing both S100P mRNA or saliva sample and the left DNA-conjugated AuNPs in PBS containing 0.3M NaCl were then loaded in the reaction area. The solution flowed vertically through the VF chips within 19 min. As described in Fig. 1(b), PBS solution was dropped on the reaction zone to wash out DNA oligo-conjugated AuNPs that were not bound to right DNA oligo and the VFA was allowed to dry at room temperature before SERS measurement. The raster scanning mode of the handheld Raman instrument (638 nm excitation laser, 30 mW laser power, 1 s acquisition time, and 2 mm laser spot size) was employed to record an average spectrum. Measurements were conducted at three times on each of the samples.
3. Results and Discussion
3.1. Characterization of Bare AuNP and DNA Oligomer-Conjugated AuNPs
To determine the size of the bare AuNPs, TEM images were taken. Results in Fig. 2(a) indicated that the particles’ mean hydrodynamic diameter was . To confirm the conjugation of both 250:1 right and 130:1 molar ratio left DNA probes to each of AuNPs, the LSPR of AuNPs was slightly redshifted to 527 nm from 522 nm as shown in Fig. 2(b), which demonstrated a change in the particles’ dielectric constant due to the presence of the oligomers. These results displayed that DNA probes were successfully conjugated to AuNPs and that the probes were stable. Since the amount of DNA conjugated on the AuNPs is related to the stability and hybridization rate of the DNA-conjugated AuNPs, highly DNA-packed AuNPs produce strong stability under high salt conditions, but the efficiency of the hybridization is low.37 Thus, to get a good balance between stability and hybridization of DNA-AuNPs, placing the least amount of DNA oligomers onto the AuNPs that produces stability in PBS is desirable. The concentrations (molar ratios) of DNA oligomers and MGITC molecules used here for the surface modification of AuNPs were the least concentrations of DNA. Their stability was confirmed using UV–vis spectroscopy and observation during the conjugation step using the salt aging method. Actual loading of DNA on AuNPs was estimated using DNA oligomer tagging of a Cy5 dye at the terminal of the left DNA base sequence. After conjugation of Cy5-tagged DNA oligomers with AuNPs (130:1 molar ratio to Cy5-tagged DNA/AuNP), they were centrifuged to collect free Cy5-tagged DNA oligomers and fluorescence measurements were conducted for quantification of the amount of Cy5-tagged DNA on AuNPs. Figure 2(c) shows fluorescence spectra of both a series of Cy5 DNA oligomer standard solutions from 130:1 to 0 ratios and the free Cy5-tagged DNA collected after incubation. The fluorescence spectrum that corresponds to the free Cy5-taged DNA is the green line shown in Fig. 2(c). Its fluorescence intensity at 662 nm is located at approximately half of the intensity of the 130:1 Cy5 DNA oligomer standard solution, which means that only about half of DNA oligomers were actually conjugated on the AuNPs under the current incubation conditions. Based on a calibration curve, not presented here, it was determined that 49% of the DNA probes were immobilized on AuNPs and the actual binding ratio of DNA to AuNP was a 64:1 molar ratio. Also, the amount of MGITC molecules absorbed on DNA oligomer–AuNPs was investigated. Left DNA-conjugated AuNPs was incubated with MGITC molecules of 250:1 molar ratio to AuNPs. They were centrifuged to collect the supernatant from MGITC-DNA-conjugated AuNPs. When MGITC molecules are not completely attached to DNA-conjugated Au NPs, the supernatant contains free MGITC molecules, which produces SERS spectrum of MGITC with addition of Au NP solution. As shown in Fig. 2(d), SERS measurements were taken on both the supernatant (MGITC free) and for a series of MGITC dye volumes that varied in ratio to AuNPS (at 1.5 nM) from 120:1 to 20:1. SERS bands assigned to MGITC were not observed for the supernatant, which means most of MGITC is immobilized on the left DNA-conjugated AuNPs.
Fig. 2.
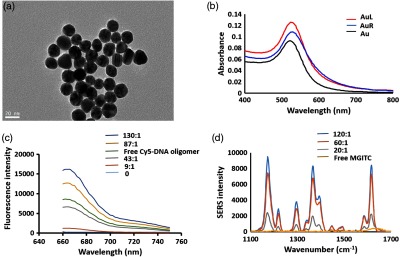
(a) TEM image of AuNPs. (b) UV–-vis spectra for bare AuNP and DNA oligomer (left and right) conjugated AuNPs in PBS. (c) Fluorescence spectra of free Cy5-tagged-left DNA oligomers (green line) and the standard solutions of five different molar ratios of Cy5-tagged-left DNA oligomer to Au NPs (blue 130:1, yellow 87:1, gray 43:1, red 9:1, and sky 0). (d) SERS spectra of free MGITC (yellow line) and their standard solutions of MGITC dye ratio to AuNPs from 120:1 to 20:1.
3.2. SERS Study of S100P mRNA Assay
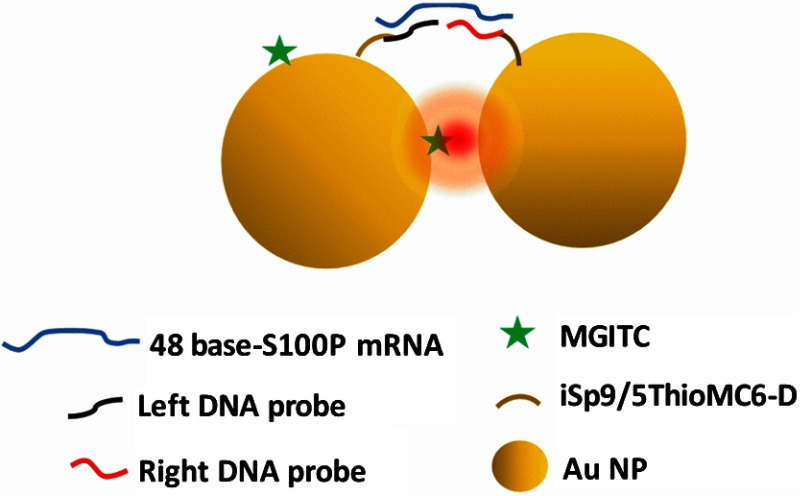
The schematic of the SERS-based assay for S100P mRNA detection is shown in Fig. 3. The assay was designed to be a sandwich formation. MGITC was used as the RRM.
Fig. 3.
Schematic illustration of SERS-based assay for S100P mRNA detection.
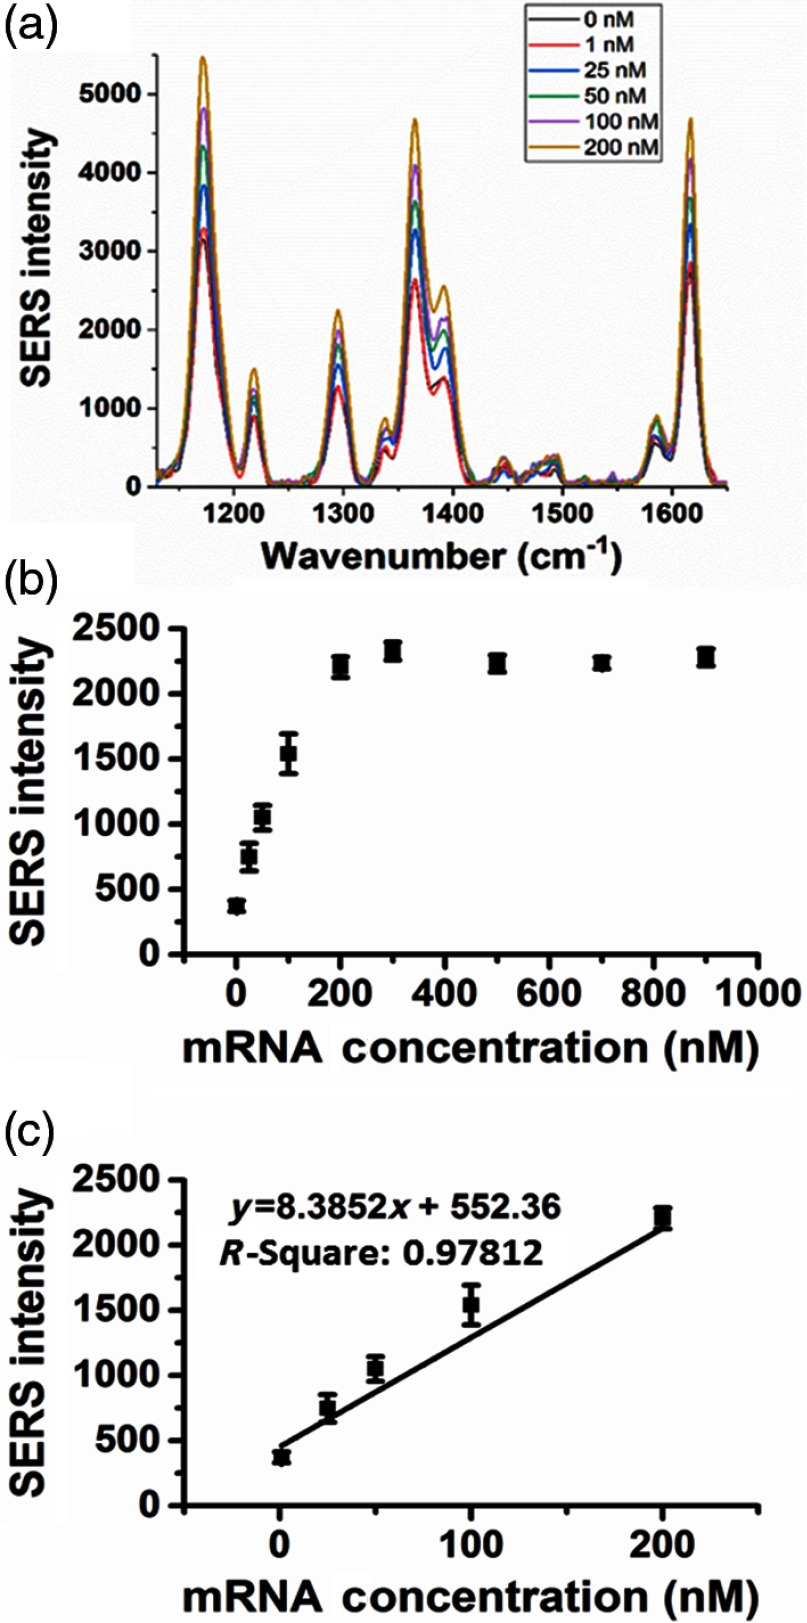
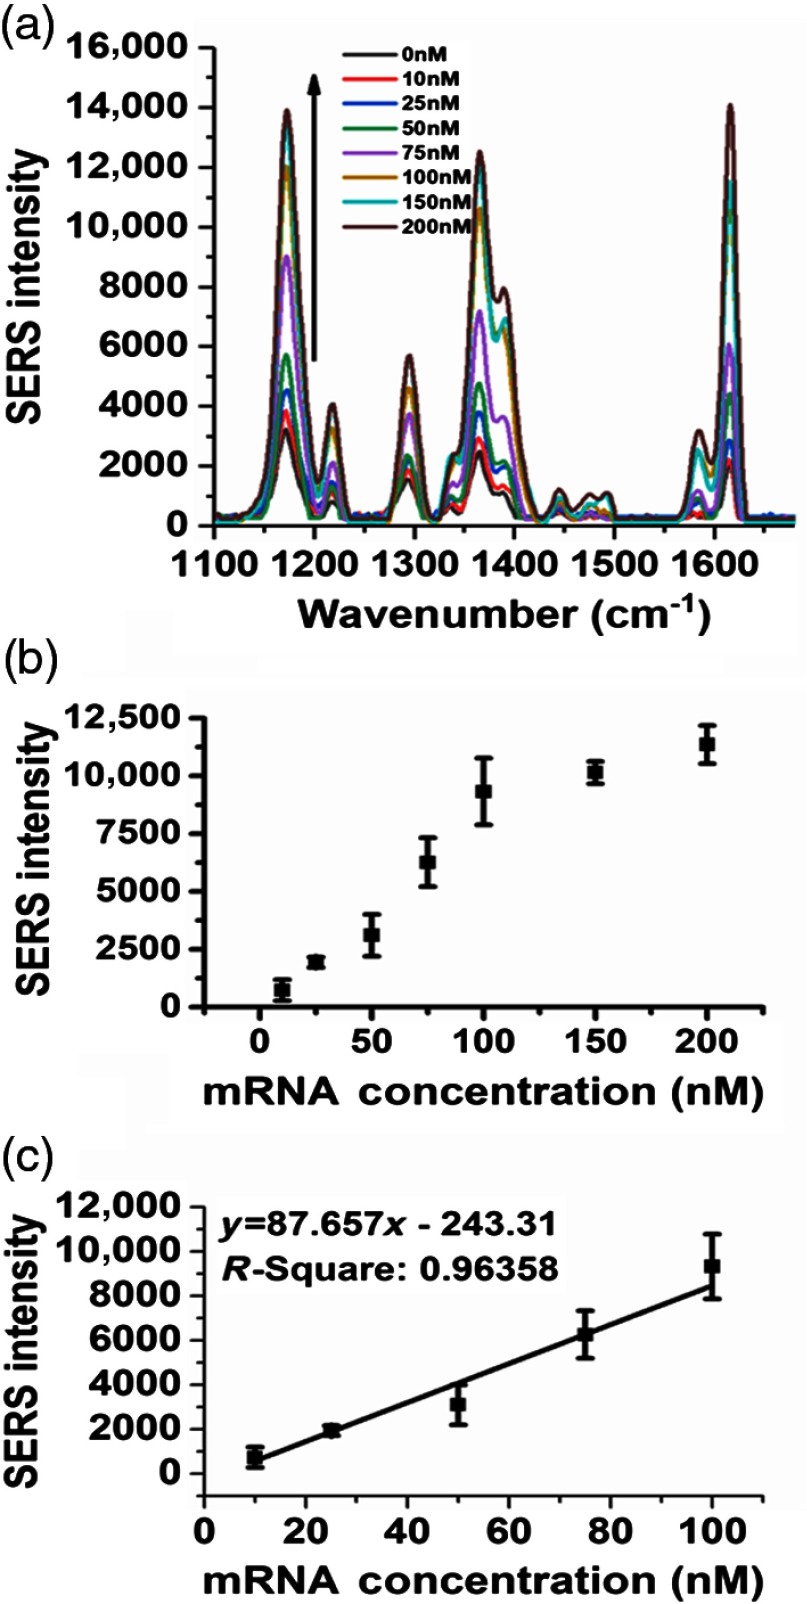
The assay without S100P mRNA produces SERS intensity of MGITC bound on the left probe as shown in Fig. 4(a). This is due to the resonance effect of the MGITC with the excitation laser and single gold particles resulting in an intrinsic enhancement.38 However, further enhancement is observed in the presence of increasing concentrations of S100P mRNA. MGITC molecules on the surface of left DNA-conjugated-AuNPs are close to the other AuNPs conjugated with right DNA oligomer in the presence of target molecule S100P mRNA. Thus, strong surface plasmons were generated at the junction of two AuNPs (i.e., “hot spot”). Figure 4(a) shows characteristic Raman bands of MGITC on AuNPs were observed at 1170, 1297, 1366, and , and these intensities increased as S100P mRNA concentration increased from 0 to 200 nM, which agrees with our previous work.39 Among four Raman peaks, the strongest peak at was used to quantify the amount of S100P mRNA. A quantitative analysis of the assay for S100P mRNA detection was performed using a calibration curve and a wide range of S100P mRNA concentrations from 0.01 to 900 nM. The resulting plot of SERS intensity versus the target concentration is shown in Fig. 4(b).
Fig. 4.
(a) SERS spectra of the RRM for S100P mRNA hybridization to DNA oligo-conjugated AuNPs, and (b) the corresponding calibration curve with (c) the determined dynamic range.
In this plot, the intensity of MGITC Raman band in the absence of the target S100P mRNA (control) at was used as a baseline to correct the normalized Raman intensities of the different concentrations of S100P mRNA by subtracting the control intensity value from that of each of the different target concentrations. In Fig. 4(b), the SERS intensity increased from 0.01 to 200 nM and then reached saturation at 200 nM. The error bars are standard deviations from three measurements of each sample. The limit of detection (LOD) was calculated by the standard method:
where is the averaged Raman intensity of the control and is the standard deviation of the control measurement. The LOD was determined to be 1.1 nM. The working dynamic range of the assay was estimated to be from 1.2 to 200 nM in Fig. 4(c).
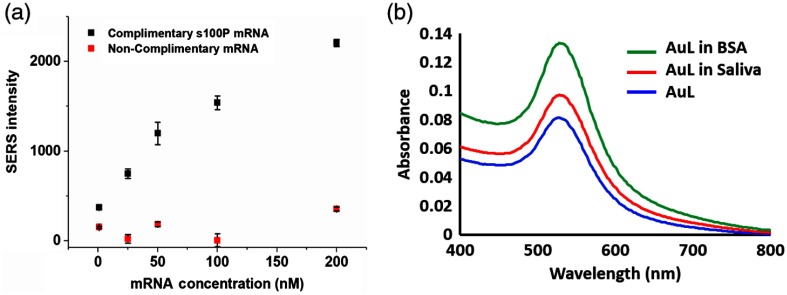
The binding specificity of the SERS-based S100P mRNA assay was evaluated as shown in Fig. 5. A noncomplementary 48 base mRNA (5′-GAG UCC UGC CUU CTC AAA GUA CUU GUG ACA GGC AGA CGU GAU UGC AGC-3′) was used. This compliment is within the 329 to 376 region of the 510 bases saliva S100P mRNA target as oppose to the current target that was generated from the 31 to 78 region. As shown in Fig. 5, in the presence of this noncomplementary mRNA (1, 25, 50, 100, and 200 nM), the SERS intensities are much lower than that of corresponding concentrations of the complimentary target S100P mRNA, which indicates a higher affinity of the assay to S100P mRNA rather than the noncomplimentary mRNA. To investigate nonspecific binding of proteins to DNA-conjugated AuNPs, UV–vis measurements can be employed to indicate adsorption of proteins onto AuNPs since the surface plasmon resonance (SPR) band of nanoparticles are shifted to the longer wavelength region with protein absorption on the surface of the AuNPs.40 We incubated left DNA-conjugated AuNPs with bovine serum albumin and a saliva sample (1:1 volume ratio to AuNPs) of a healthy volunteer for 1 h at room temperature and centrifuged the sample to remove unbounded proteins. As shown in Fig. 5(b), the UV–vis spectra showed that there is no SPR band shift compared to the control (left DNA-conjugated AuNPs) and all SPR bands were located at 527 nm. These results illustrated that the SERS-based assay has strong specificity toward the designed area of the original target S100P mRNA.
Fig. 5.
(a) Normalized SERS intensity for S100P mRNA and noncomplimentary mRNA and (b) UV–vis spectra of left-conjugated AuNPs (AuL) incubated with BSA and saliva of healthy volunteers for the specificity test of the assay.
3.3. SERS-Based Vertical Flow Assay for S100P mRNA Detection
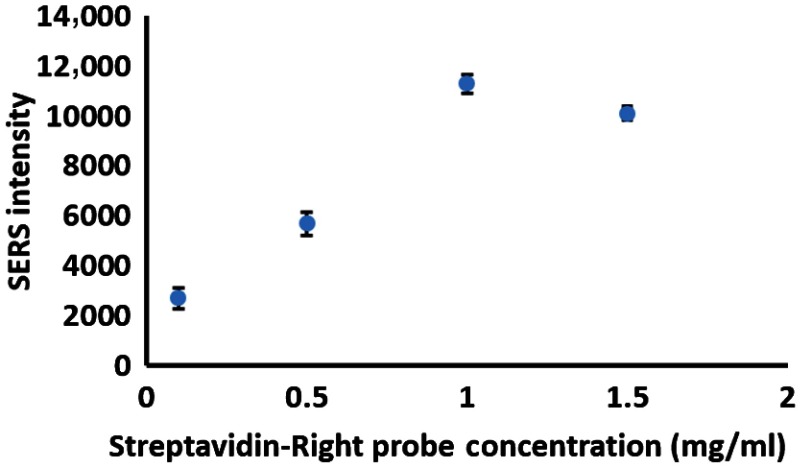
To apply this assay for S100P mRNA detection to a POC biosensor, a VF paper fluidic was employed due to its simplicity, rapid analysis, relatively low interference, user friendly capability, and low costs. The SERS signal relies on the formation of nanoparticle hot spots on the nitrocellulose membrane. It is expected that closely packed capture probes decrease the variation of the distance between nanoparticles hybridized with S100P mRNA on nitrocellulose membrane, which can, in turn, produce strong and reproducible signals. To obtain strong and reproducible signals on VFA-chip with the formation of hot spots, the concentration of capture DNA oligomers (streptavidin-right oligomers) on the paper needed to be optimized. Herein, the concentrations of streptavidin-bound capture DNA complexes were tested in Fig. 6. Since streptavidin has four binding pockets for biotin molecules, their binding ratio of biotin tagged capture DNA oligomers to streptavidin (4:1) was kept the same as the streptavidin concentration increased. Changes in SERS intensity were monitored using various concentration ranges of capture probes at a fixed concentration of DNA-conjugated AuNPs (1.5 nM). 200-nM S100P mRNA was introduced. It was observed that the SERS intensity of MGITC at increases as the capture probe concentrations increase and finally levels out at of the streptavidin-right probes. Thus, the appropriate concentration of streptavidin-right oligomer is roughly for optimal S100P mRNA detection on VFA-chip.
Fig. 6.
Concentration effect of streptavidin-right DNA (capture) probe on nitrocellulose membrane with 200 nM S100P mRNA.
Figure 7(a) shows the images of VFA-chips for various concentrations of S100P mRNA under optimized conditions. As the target concentration increased, it was observed that more AuNPs were captured on the reaction zone and the color became darker red. To evaluate the intensity variation across test spots of a single VFA-chip, SERS spectra were collected from three different spots within a single VFA chip. As shown in Fig. 7(b), VFA-chips corresponding to 25, 100, and 200 nM S100P mRNA were representatively selected to show variations across three different spots. These measurements were repeated on three VFA chips. The low standard deviations of SERS intensities collected from three spots of a single VFA-chip across three chips suggest that the distributions of hot spots are uniform on the nitrocellulose membranes. This result is also enhanced from the use of the raster scanning mode of Raman instrument.
Fig. 7.
Corresponding photographic image (a) of VFA-chips for varying concentration of S100P mRNA and (b) the variation plot of the SERS intensity at of three VFA-chips collected from three different spots on each chip (red-25 nM, blue-100 nM, and green-200 nM of S100P mRNA).
Figure 8(a) shows SERS spectra versus various target S100P mRNA concentration ranges from 0 to 200 nM on the VF chips. This indicated that the left DNA-conjugated AuNPs and the right oligomers were hybridized with target mRNA at the reaction zone of membrane. The quantitative analysis of S100P mRNA was conducted by monitoring SERS signals of MGITC molecules bound on the AuNPs from three sets of VF chips: a set of VF chips included eight different target concentration ranges. It was observed that SERS intensity on the absence of S100P mRNA increased. This observation may occur because a few of AuNPs were physically absorbed on the reaction zone, although the target S100P mRNA was absent.
Fig. 8.
(a) Raman spectra on the reaction zone of VFA for increasing S100P mRNA concentrations, (b) corresponding calibration curve of Raman intensity on the reaction zone of three VFAs as a function of S100P mRNA, and (c) the determined dynamic range of the VF assay.
As depicted, the SERS intensity was much higher for the paper fluidic compared to the assay in solution. When the VF chip dries due to evaporation of the solution, the fibers of the nitrocellulose membrane are brought in very close proximity to each other.41 This leads to a reduction in the distance between AuNPs bound on VF chip resulting in a higher SERS enhancement. The intensity value for the control solution in Fig. 4(a) is almost the same as that of control of the VF chip assay since relatively small amount of AuNPs are spaciously absorbed over VF chip, allowing for a larger distance between AuNPs.
However, when more AuNPs were captured in the nitrocellulose membrane of VF chip as the S100P mRNA concentration increases, the SERS intensity of VF chip is higher than that of the assay in solution [Fig. 4(a)] since the drying of the membrane bring the interparticle distance closer than those in the solution. Figure 8(b) shows that the average and standard error bars of the SERS peak from three sets of VFAs. In this plot, SERS intensities of the different concentrations of S100P mRNA from 10 to 200 nM were normalized by subtracting the control intensity value from that of each of the different target concentrations. The intensity variations of Raman bands are small. These results demonstrated that this SERS based-VF chips has a good performance as POC biosensor with high reproducibility. The calibration curve of SERS intensity versus the target concentration, ranged from 10 to 100 nM, was exhibited in Fig. 8(c). The detection limits of the VF chip assay were estimated to be 10 nM based on the calibration curve.
3.4. SERS-Based Vertical Flow Assay for S100P mRNA Detection with Saliva Samples
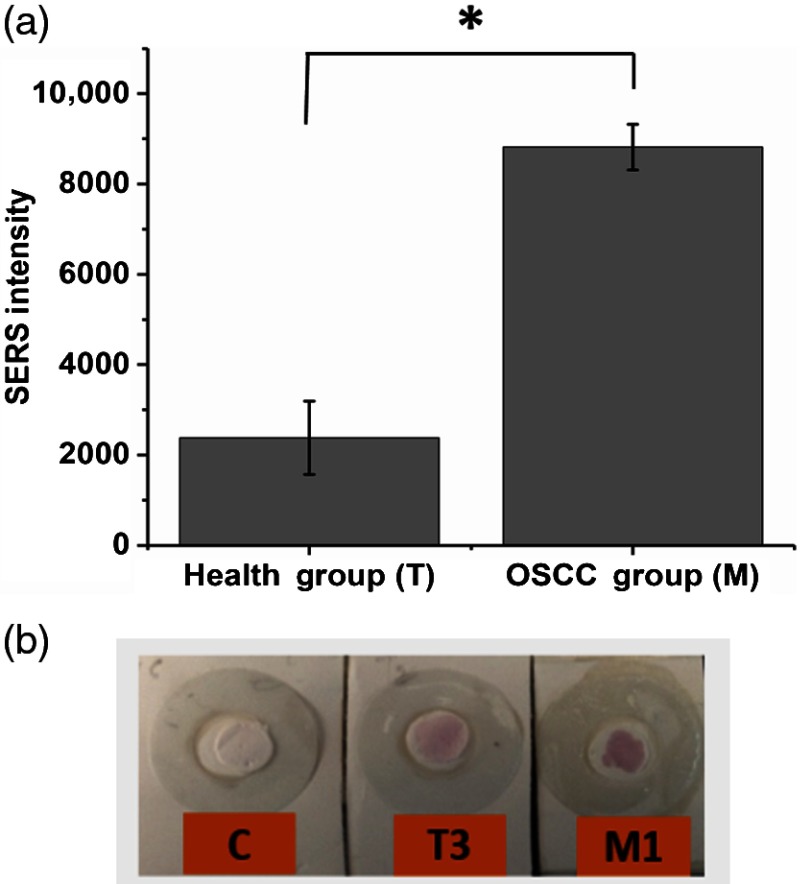
The SERS-based VF sensing for S100P mRNA was performed with saliva samples including both OSCC patient and healthy groups. Specifically, the SERS measurements were recorded for VF chips with three OSCC patients (M1, M5, and M7) and three healthy volunteers (T1, T3, and T21) as shown in Fig. 9. It was observed that the healthy groups also produced SERS signals and light red color on the VF chips. This result can be explained since there is expected to be the presence of S100P mRNA in medically healthy persons.8 However, in the case of OSCC patients, the SERS intensity is higher than that of healthy group and the color on the VFA is darker red than that of healthy groups, as shown in Figs. 9(a) and 9(b). This indicates that the concentration of S100P mRNA of OSCC patients is higher than that of healthy group. The “C” on VF chip in Fig. 9(b) indicates the control that is absent of any saliva sample as the color is mostly white, indicating most of left DNA oligomers-conjugated AuNPs passed through the reaction zone. Based on the calibration curve of Fig. 8(c), the average concentration of S100P mRNA from the saliva samples was tested and estimated to be around 200 nM range for OSCC and 65 nM for healthy group. Due to the limitation of three sample sizes per group, a statistical analysis was performed using a nonparametric test (The Wilcoxon–Mann–Whitney test). The value was evaluated to be 0.049. This result suggests that there is significant difference between the two groups (healthy volunteers and patients). Further, according to the study by Cheng et al. the amount of S100P mRNA of OSCC patient is almost 2.5 times higher than that of healthy people. In this study, the averaged Raman intensity of the three OSCC patients tested were about three times higher than that of three healthy people, which is in general agreement with the previous research of Cheng et al.8 The whole process for this VFA, from loading patients’ saliva sample on the vertical flow chip (VFC) to analyzing SERS spectra, took roughly 53 min: 19 min for the VF of the saliva sample solution and another 19 min for the PBS washing solution, 10 min for drying the VFC, and about 5 min for SERS measurement.
Fig. 9.
(a) SERS measurement of saliva samples on VFA-T1, T3, and T21 for health groups as well as M1, M5, and M7 for OSCC patients (*Mann–Whitney test: ) and (b) corresponding photographic image of VFA-chip for the absence of saliva sample.
4. Conclusions
A SERS-based assay for S100P mRNA detection was developed and characterized. The SERS-based assay was able to quantifiably detect low concentrations of S100P mRNA in solution down to 1.1 nM with high specificity toward the target. Toward development of a POC system, a VFC was designed and developed for use with the SERS-based assay for S100P mRNA detection on saliva samples. The results showed the ability to quantify the S100P biomarker and the SERS-based VF chips were successful in quantifying the level of S100P mRNA from OSCC patients and distinguishing them from healthy groups. The concentration of S100P mRNA in OSCC patients was three times higher than that in healthy groups, which agrees with previous data by Cheng et al.8 This work shows the potential feasibility of a SERS-based VFA biosensor for POC biomarker detection.
Biographies
Sungyub Han is a postdoctoral researcher with Professor Gerard L. Coté’s group, Biomedical Engineering Department, Texas A&M University. He earned his PhD in 2015 from the University of South Florida. His current research focuses on developments of biosensors using surface-enhanced Raman scattering in a point-of-care device. He has experience in synthesis of different types of nanoparticles, such as silver, gold, silica core silver shell, and magnetic nanomaterials as well as surface modification of nanoparticles with DNA oligomers.
Andrea K. Locke is a postdoctoral assistant research engineer with the Center for Remote Health Technologies and Systems and the Optical BioSensing Lab at Texas A&M University. She received her PhD in biomedical engineering from Texas A&M University in 2016. Her current research interest is in developing point-of-care technologies, particularly within low resource settings by investing the use of different optical spectroscopies with various nanoparticle assays for the design of lab-on-a-chip biosensors.
Luke A. Oaks is a Beckman scholar, NAE Grand Challenges scholar, and PATHS-UP ERC fellow at Texas A&M University. His research focuses on engineering improved health systems through biomedical sensing and human factors approaches. He utilizes computer science to improve biomarker detection as well as data collection. He currently performs human subjects research for the PATHS-UP Engineering Research Center.
Yi-Shing Lisa Cheng is a professor and the director of the Oral Pathology and Advanced Education Program of the Department of Diagnostic Sciences, Texas A&M University College of Dentistry. She is a board-certified oral and maxillofacial pathologist and a clinical researcher. Her research current is focused on salivary biomarkers for oral cancer detection and early intervention for oral premalignant lesions. Her research has been funded by the National Institutes of Health, the Cancer Prevention and Research Institute of Texas (CPRIT) and the Texas A&M Health Science Center.
Gerard L. Coté is the director of the Center for Remote Health Technologies and Systems, director of the NSF PATHS-UP ERC, and holder of the James J. Cain Professorship I in Biomedical Engineering at Texas A&M University. His research focuses on biomedical sensing for diagnostic and monitoring applications. Specifically, he develops innovative hand-held and wearable point-of-care technologies and systems using optics, electronics, microfluidics, paper fluidics, nanoparticles, and assays. Applications include detection and diagnosis of chronic diseases (diabetes, cardiovascular, cancer), blood toxicants (BPA, PCBs), and infectious disease (malaria) with a recent focus on medical devices for underserved populations. He also performs translational research and contributes to the innovation ecosystem.
Disclosures
The authors have no relevant financial interests in this article and no potential conflicts of interest to disclose.
References
- 1.Saman D. M., “A review of the epidemiology of oral and pharyngeal carcinoma: update,” Head Neck Oncol. 4, 1 (2012). 10.1186/1758-3284-4-1 [DOI] [PMC free article] [PubMed] [Google Scholar]
- 2.Ferlay J.et al. , “Cancer incidence and mortality worldwide: sources, methods and major patterns in GLOBOCAN 2012,” Int. J. Cancer 136(5), E359–E386 (2015). [DOI] [PubMed] [Google Scholar]
- 3.Gavish A., Krayzler E., Nagler R., “Tumor growth and cell proliferation rate in human oral cancer,” Arch. Med. Res. 47(4), 271–274 (2016). [DOI] [PubMed] [Google Scholar]
- 4.Sciubba J. J., “Oral cancer. The importance of early diagnosis and treatment,” Am. J. Clin. Dermatol. 2(4), 239–251 (2001). [DOI] [PubMed] [Google Scholar]
- 5.Epstein J. B., et al. , “The limitations of the clinical oral examination in detecting dysplastic oral lesions and oral squamous cell carcinoma,” J. Am. Dent. Assoc. 143(12), 1332–1342 (2012). 10.14219/jada.archive.2012.0096 [DOI] [PubMed] [Google Scholar]
- 6.Cleveland J. L., Robison V. A., “Clinical oral examinations may not be predictive of dysplasia or oral squamous cell carcinoma,” J. Evidence Based Dent. Pract. 13(4), 151–154 (2013). 10.1016/j.jebdp.2013.10.006 [DOI] [PMC free article] [PubMed] [Google Scholar]
- 7.Panta P., Venna V. R., “Salivary RNA signatures in oral cancer detection,” Anal. Cell Pathol. (Amst.) 2014, 450629 (2014). 10.1155/2014/450629 [DOI] [PMC free article] [PubMed] [Google Scholar]
- 8.Cheng Y. L., et al. , “Chronic periodontitis can affect the levels of potential oral cancer salivary mRNA biomarkers,” J. Periodontal Res. 52(3), 428–437 (2017). 10.1111/jre.2017.52.issue-3 [DOI] [PMC free article] [PubMed] [Google Scholar]
- 9.Dvořáka Z., Pascussib J.-M., Modrianský M., “Approaches to mRNA detection using PCR Northernbolt,” Biomed. Papers 147(2), 131–135 (2003). [DOI] [PubMed] [Google Scholar]
- 10.Tominaga K., et al. , “Colorimetric ELISA measurement of specific mRNA on immobilized-oligonucleotide-coated microtiter plates by reverse transcription with biotinylated mononucleotides,” Clin. Chem. 42(11), 1750–1757 (1996). [PubMed] [Google Scholar]
- 11.Li Y., et al. , “Salivary transcriptome diagnositics for oral cancer detection,” Clin. Cancer Res. 10, 8442–8450 (2004). 10.1158/1078-0432.CCR-04-1167 [DOI] [PubMed] [Google Scholar]
- 12.Brinkmann O., et al. , “Oral squamous cell carcinoma detection by salivary biomarkers in a Serbian population,” Oral Oncol. 47(1), 51–55 (2011). 10.1016/j.oraloncology.2010.10.009 [DOI] [PMC free article] [PubMed] [Google Scholar]
- 13.Cheng Y. S., et al. , “Levels of potential oral cancer salivary mRNA biomarkers in oral cancer patients in remission and oral lichen planus patients,” Clin. Oral Invest. 18(3), 985–993 (2014). 10.1007/s00784-013-1041-0 [DOI] [PMC free article] [PubMed] [Google Scholar]
- 14.Lin Y. J., et al. , “A rapid and sensitive early diagnosis of influenza virus subtype via surface enhanced Raman scattering,” J. Biosens. Bioelectron. 5, 150 (2014). 10.4172/2155-6210.1000150 [DOI] [Google Scholar]
- 15.Weitzel T., et al. , “Evaluation of a new point-of-care test for influenza A and B virus in travellers with influenza-like symptoms,” Clin. Microbiol. Infect. 13(7), 665–669 (2007). 10.1111/j.1469-0691.2007.01739.x [DOI] [PubMed] [Google Scholar]
- 16.Butler S. A., Khanlian S. A., Cole L. A., “Detection of early pregnancy forms of human chorionic gonadotropin by home pregnancy test devices,” Clin. Chem. 47(12), 2131–2136 (2001). [PubMed] [Google Scholar]
- 17.Rosenberg N. E., et al. , “Detection of acute HIV infection: a field evaluation of the determine(R) HIV-1/2 Ag/Ab combo test,” J. Infect. Dis. 205(4), 528–534 (2012). 10.1093/infdis/jir789 [DOI] [PMC free article] [PubMed] [Google Scholar]
- 18.Li Z., et al. , “Rapid and sensitive detection of protein biomarker using a portable fluorescence biosensor based on quantum dots and a lateral flow test strip,” Anal. Chem. 82, 7008–7014 (2010). 10.1021/ac101405a [DOI] [PubMed] [Google Scholar]
- 19.Zheng P., et al. , “A gold nanohole array based surface-enhanced Raman scattering biosensor for detection of silver(I) and mercury(II) in human saliva,” Nanoscale 7(25), 11005–11012 (2015). 10.1039/C5NR02142A [DOI] [PMC free article] [PubMed] [Google Scholar]
- 20.Srivastava S. K., et al. , “SERS biosensor using metallic nano-sculptured thin films for the detection of endocrine disrupting compound biomarker vitellogenin,” Small 10(17), 3579–3587 (2014). 10.1002/smll.v10.17 [DOI] [PubMed] [Google Scholar]
- 21.Wang Y., Tang L. J., Jiang J. H., “Surface-enhanced Raman spectroscopy-based, homogeneous, multiplexed immunoassay with antibody-fragments-decorated gold nanoparticles,” Anal. Chem. 85(19), 9213–9220 (2013). 10.1021/ac4019439 [DOI] [PubMed] [Google Scholar]
- 22.Yoon J., et al. , “Highly sensitive detection of thrombin using SERS-based magnetic aptasensors,” Biosens. Bioelectron. 47, 62–67 (2013). 10.1016/j.bios.2013.03.003 [DOI] [PubMed] [Google Scholar]
- 23.Alvarez-Puebla R. A., Liz-Marzan L. M., “SERS-based diagnosis and biodetection,” Small 6(5), 604–610 (2010). 10.1002/smll.v6:5 [DOI] [PubMed] [Google Scholar]
- 24.Fabris L., “Gold-based SERS tags for biomedical imaging,” J. Opt. 17(11), 114002 (2015). 10.1088/2040-8978/17/11/114002 [DOI] [Google Scholar]
- 25.Vendrell M., et al. , “Surface-enhanced Raman scattering in cancer detection and imaging,” Trends Biotechnol. 31(4), 249–257 (2013). 10.1016/j.tibtech.2013.01.013 [DOI] [PubMed] [Google Scholar]
- 26.Wee E. J., et al. , “Simple, sensitive and accurate multiplex detection of clinically important melanoma DNA mutations in circulating tumour DNA with SERS nanotags,” Theranostics 6(10), 1506–1513 (2016). 10.7150/thno.15871 [DOI] [PMC free article] [PubMed] [Google Scholar]
- 27.Marks H., et al. , “Surface enhanced Raman spectroscopy (SERS) for in vitro diagnostic testing at the point of care,” Nanophotonics 6(4), 180 (2017). 10.1515/nanoph-2016-0180 [DOI] [Google Scholar]
- 28.Choi S., et al. , “Quantitative analysis of thyroid-stimulating hormone (TSH) using SERS-based lateral flow immunoassay,” Sens. Actuators B Chem. 240, 358–364 (2017). 10.1016/j.snb.2016.08.178 [DOI] [Google Scholar]
- 29.Fu X., et al. , “A SERS-based lateral flow assay biosensor for highly sensitive detection of HIV-1 DNA,” Biosens. Bioelectron. 78, 530–537 (2016). 10.1016/j.bios.2015.11.099 [DOI] [PubMed] [Google Scholar]
- 30.Rong Z., et al. , “SERS-based lateral flow assay for quantitative detection of C-reactive protein as an early bio-indicator of a radiation-induced inflammatory response in nonhuman primates,” Analyst 143(9), 2115–2121 (2018). 10.1039/C8AN00160J [DOI] [PubMed] [Google Scholar]
- 31.Chapman R., et al. , “Multivalent nanoparticle networks enable point-of-care detection of human phospholipase-A2 in serum,” ACS Nano 9(3), 2565–2573 (2015). 10.1021/nn5057595 [DOI] [PMC free article] [PubMed] [Google Scholar]
- 32.Wu Z., et al. , “A simple and universal ‘turn-on’ detection platform for proteases based on surface enhanced Raman scattering (SERS),” Biosens. Bioelectron. 65, 375–381 (2015). 10.1016/j.bios.2014.10.065 [DOI] [PubMed] [Google Scholar]
- 33.Kim N. H., Lee S. J., Moskovits M., “Aptamer-mediated surface-enhanced Raman spectroscopy intensity amplification,” Nano Lett. 10(10), 4181–4185 (2010). 10.1021/nl102495j [DOI] [PubMed] [Google Scholar]
- 34.Peng Y., et al. , “Aptamer-gold nanoparticle-based colorimetric assay for the sensitive detection of thrombin,” Sens. Actuators B Chem. 177, 818–825 (2013). 10.1016/j.snb.2012.12.004 [DOI] [Google Scholar]
- 35.Navazesh M., “Method for collecting saliva,” Ann. N. Y. Acad. Sci. 694(1), 72–77 (1993). 10.1111/nyas.1993.694.issue-1 [DOI] [PubMed] [Google Scholar]
- 36.Bastus N. G., Comenge J., Puntes V., “Kinetically controlled seeded growth synthesis of citrate-stabilized gold nanoparticles of up to 200 nm: size focusing versus Ostwald ripening,” Langmuir 27(17), 11098–11105 (2011). 10.1021/la201938u [DOI] [PubMed] [Google Scholar]
- 37.Oh J. H., Lee J. S., “Designed hybridization properties of DNA-gold nanoparticle conjugates for the ultraselective detection of a single-base mutation in the breast cancer gene BRCA1,” Anal. Chem. 83(19), 7364–7370 (2011). 10.1021/ac201291y [DOI] [PubMed] [Google Scholar]
- 38.Israelsen N. D., Hanson C., Vargis E., “Nanoparticle properties and synthesis effects on surface-enhanced Raman scattering enhancement factor: an introduction,” ScientificWorldJournal 2015, 1–12 (2015). 10.1155/2015/124582 [DOI] [PMC free article] [PubMed] [Google Scholar]
- 39.Han S., et al. , “Development of a free-solution SERS-based assay for point-of-care oral cancer biomarker detection using DNA-conjugated gold nanoparticles,” Proc. SPIE 10501, 1050104 (2018). 10.1117/12.2290516 [DOI] [Google Scholar]
- 40.Thobhani S., et al. , “Bioconjugation and characterisation of gold colloid-labelled proteins,” J. Immunol. Methods 356(1–2), 60–69 (2010). 10.1016/j.jim.2010.02.007 [DOI] [PubMed] [Google Scholar]
- 41.Cheng M. L., Tsai B. C., Yang J., “Silver nanoparticle-treated filter paper as a highly sensitive surface-enhanced Raman scattering (SERS) substrate for detection of tyrosine in aqueous solution,” Anal. Chim. Acta 708(1–2), 89–96 (2011). 10.1016/j.aca.2011.10.013 [DOI] [PubMed] [Google Scholar]


