Abstract.
Cytotoxic T lymphocytes (CTLs) play a key role in adoptive cell therapy (ACT) by destroying tumor cells. Although some mechanisms of CTLs killing tumor cells have already been revealed, the precise dynamic information of CTLs’ interaction with tumor cells is still not known. Here, we used confocal microscopy to visualize the whole process of how CTLs kill tumor cells in vitro. According to imaging data, CTLs destroyed the target tumor cells rapidly and efficiently. Several CTLs surrounded one or more tumor cells, and the average time for CTLs destroying one or more tumor cells in vitro is dozens of minutes only. Our study displayed the temporal events of CTLs’ interaction with tumor cells at the beginning up to the point of killing them. Furthermore, the imaging data presented strong cytotoxicity of CTLs toward the specific tumor cells. These results could help us to well understand the mechanism of CTLs’ elimination of tumor cells and improve the efficacy of ACT in cancer immunotherapy.
Keywords: cytotoxic T lymphocytes, tumor cells, optical imaging, dynamic visualization, adoptive cell therapy, cancer immunotherapy
1. Introduction
Cancer immunotherapy, including the use of monoclonal antibodies, tumor vaccines, checkpoint blockade therapy, and adoptive cell therapy (ACT), is considered a breakthrough in cancer therapy.1–3 ACT is reportedly one of the most efficient therapeutic strategies for melanoma treatments.4 Cytotoxic T lymphocytes (CTLs, also called tumor-specific cytotoxic T cells) play an important role in ACT by eliciting strong antitumor immune response due to their abilities to recognize and destroy tumor cells. When meeting a tumor cell, T-cell receptors (TCRs) expressed on the CTLs could recognize specific tumor antigens on the tumor cell and induce its cytotoxic response.5 The mechanisms of CTLs killing tumor cells unfold in several ways: through the secretion of perforin and granzyme B, through the interaction of FasL and Fas on the cell surface, and through the NKG2D pathway.6–10 Before ACT, the activity and cytotoxicity of CTLs against target tumor cells need to be evaluated in vitro. Some methods—such as flow cytometry, immunohistochemistry, real-time PCR, western blot, and a few others—have already analyzed the functions of CTLs. Even though these methods revealed some important facts about CTLs’ killing abilities, other dynamic details, especially the special interaction between CTLs and target tumor cells and the whole process of CTLs successfully killing tumor cells are still not well understood.7–9,11–13
The confocal imaging enables tracking several cellular or molecular events dynamically at high resolution in real time via multichannel parallel detections.14–17 In order to visualize the quick changing interactions between tumor cells and CTLs, fluorescent proteins (FPs) and fluorochromes are used to label tumor cells18–20 and CTLs.8,21,22 Recent studies have studied the kinetics of individual CTL sequentially killing multiple target tumor cells in vitro through microscopy-based methods.7,12,13 Other researchers studied important molecule events during the interactions between CTLs and tumor cells, such as granule mobilization13 and secretion in the CTLs,8 lysosome secretion in the melanoma tumor cells,9 and the formation of immunological synapse between them.8,9 The migration behavior of CTLs in tumor microenvironments during ACT in vivo also has been observed by intravital imaging.14,18,22–24 Despite that there are some studies presenting the dynamic information of CTLs and tumor cells both in vitro and in vivo, the whole process of CTLs’ destruction of tumor cells in vitro, especially how the CTLs specifically kill the target melanoma tumor cells has not yet been clearly revealed.
In this study, with the help of multicolor time-lapse confocal microscopy and a fluorescent labeling technique, we directly visualized the whole process of how CTLs kill tumor cells in vitro and captured some critical stages during this process. The dynamic imaging data presented the rapid, efficient, and specific killing process of CTLs on the target melanoma tumor cells. The average time taken by a group of CTLs to sequentially destroy multiple tumor cells in vitro was about dozens of minutes. Furthermore, the study demonstrated that the multicolor dynamic imaging of CTLs and tumor cells could become an effective and easy-to-operate method to assess the abilities of CTLs before ACT immunotherapy for cancer treatment.
2. Materials and Methods
2.1. Mice
C57BL/6 female mice (6 to 12 weeks old) were obtained from Hunan Slack King of Laboratory Animal Co., Ltd. (Hunan, China). All of the mice were maintained in a specific pathogen-free barrier facility at Animal Center of Wuhan National Laboratory for Optoelectronics. All animal studies were approved by the Hubei Provincial Animal Care and Use Committee and followed the experimental guidelines of the Animal Experimentation Ethics Committee of Huazhong University of Science and Technology.
2.2. Cell Cultures
Cyan fluorescent protein (CFP)-B16,22 tetrameric far-red fluorescent protein (tfRFP)-B1620 and CFP-Hela cells were maintained in our lab, and the cells were cultured in Roswell Park Memorial Institute-1640 (RPMI-1640) medium (HyClone, Beijing, China) containing 1% penicillin–streptomycin (HyClone, Beijing, China) and 10% fetal bovine serum (FBS, HyClone). The cells were grown at 37°C in a humidified incubator with 5% .
2.3. Generation of CFP-B16 or tfRFP-B16 Reactive CTLs In Vitro
C57BL/6 mice were immunized subcutaneously in both flanks with CFP-B16 (or tfRFP-B16) cells [pretreated with mitomycin C (Sigma-Aldrich) for 2 h at 37°C]. Seven days after the first immunization, the mice were immunized again, in the same way as the first time. Seven days after the second immunization, the mice were euthanized, and their spleens were dissected to prepare immunocytes. The spleen-derived cells (1 to per ml) were cultured in 24-well plates (Corning, Suzhou, China) with RPMI-1640 medium (HyClone), 10% FBS (HyClone), Interleukin (IL)-2 (50 U/ml, Peprotech), and CFP-B16 or (tfRFP-B16) whole-cell antigen (, supernatant from freeze-thawed tumor-cell lysate). Three days later, when the CTLs became confluent, the cells were split in the ratio of 1:2 to 1:4 into new 24-well plates using fresh complete medium with whole-cell antigen and IL-2.
2.4. Confocal Imaging
To image CTLs’ reaction with B16 tumor cells, CFP-B16 (or tfRFP) cells ( per well) were seeded into 35-mm culture dishes with cover glass bottoms (NEST Biotechnology Co. Ltd., Shanghai, China) and were incubated for 18 h at 37°C in a humidified incubator with 5% . Subsequently, 5 days in vitro-cultured and primed CTLs (or freshly separated splenocytes) were added to the dishes containing CFP-B16 (or tfRFP-B16 and CFP-Hela) cells. Prior to adding to the dishes, the CTLs or splenocytes were stained with 5-(and-6)-carboxyfluorescein diacetate succinimidyl ester, CFDA SE (CFSE) following instructions in the standard protocol. After the addition of CTLs (or splenocytes), tumor cells were cocultured for 10 min or 4 h and the fluorescent signals were detected using a confocal laser scanning microscopy (Zeiss 710, Carl Zeiss MicroImaging, Inc., Germany, and Olympus FV1000, Japan) at excitation wavelengths of 405 nm for CFP-B16 (or CFP-Hela), 488 nm for CFSE-labeled CTLs or splenocytes, and 561 nm for tfRFP-B16. The large field images () were captured using a 0.8 NA objective and the sequential imaging was captured using a 1.4 NA oil objective.
2.5. Flow Cytometry
CTLs were collected from cultured lymphocytes by centrifugation in Histopaque®-1.083 (Sigma-Aldrich) and then labeled with CFSE (Invitrogen) for 15 min at 37°C. The CFSE fluorescent signal of the CTLs was analyzed using a FACS-Calibur flow cytometer (Guava EasyCyte 8HT, EMD Millipore Corporation, Germany).
2.6. Data Analysis
Confocal imaging data were presented and analyzed with a ZEN blue (Carl Zeiss MicroImaging, Inc., Germany), a FV10-ASW (Olympus, Japan), an Image J (National Institutes of Health) or an Imaris 7.6 (Bitplane) software.
2.7. Statistical Analysis
Statistical analysis was performed using GraphPad Prism 5 (GraphPad Software, Inc.). For comparisons within three or more groups, the Kruskal-Wallis test was performed and followed by Dunn’s multiple comparison tests. For comparisons of two groups, the two-tailed unpaired -test was performed. Differences between or within groups are denoted as ns for nonsignificant, * for , ** for , and *** for .
3. Results
3.1. Confocal Imaging of CFP-B16 and tfRFP-B16 and Flow Cytometry Analysis of CFSE-Labeled CTLs
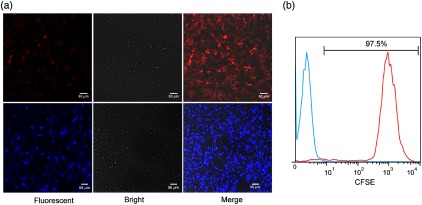
We used a confocal microscopy and a flow cytometer to detect the fluorescent signals of the CFP-B16 and tfRFP-B16 tumor cells and CFSE-labeled CTLs. The imaging results showed that more than 90% of the B16 tumor cells expressed CFP or tfRFP stably [Fig. 1(a)]. The flow cytometry results further confirmed that more than 95% of the CFSE-labeled CTLs had CFSE fluorescent signals [Fig. 1(b)].
Fig. 1.
Confocal imaging of tfRFP-B16 and CFP-B16 and flow cytometry analysis of CFSE-labeled CTLs. (a) Confocal imaging detected the fluorescent signals of tfRFP-B16 (red) and CFP-B16 (blue) tumor cells. Scale bar: . (b) Flow cytometry detected the fluorescent signals of the CFSE-labeled CTLs, the data are representative of three independent experiments.
3.2. Large Field Imaging of CTLs’ Reactions with CFP-B16 In Vitro
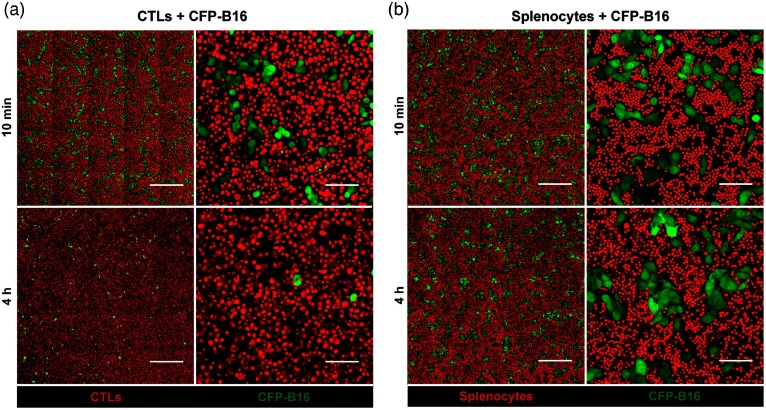
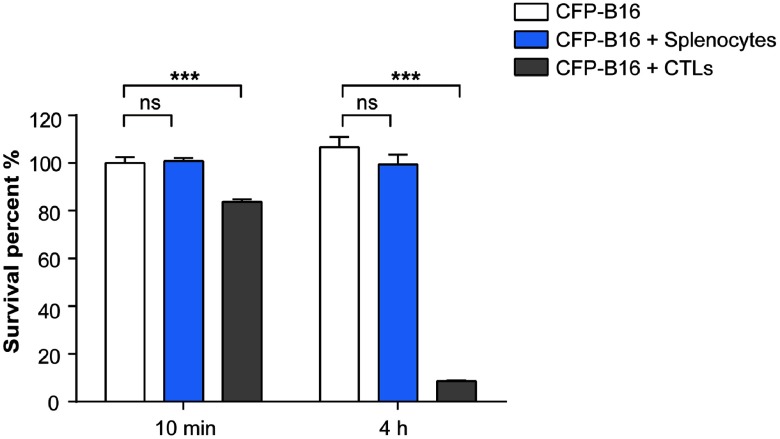
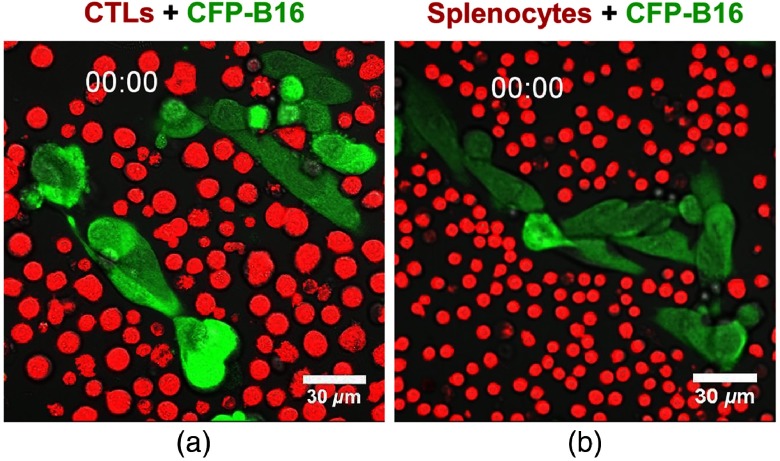
After adding CFSE-labeled CTLs (or splenocytes) to CFP-B16 tumor cells (CTLs: CFP-B16 = 25:1) for 10 min, we used a confocal microscopy to image both the tumor cells and CTLs (or splenocytes). To get more information about the CTLs’ interactions with tumor cells, we chose a large field image method () to observe more cells [Figs. 2(a) and 2(b)]. Through large-field imaging, CTLs were seen to kill the CFP-B16 tumor cells quickly at the beginning (adding CTLs 10 min later). The survival percentage of CFP-B16 after the addition of CTLs was significantly different compared with the addition of splenocytes or the control group (83.8% versus 100.8% or 100.0%, Figs. 2 and 3). Four hours later, the CTLs successfully killed most of the CFP-B16 tumor cells, and the survival percentage of CFP-B16 decreased to 8.5%. Compared with the group adding CTLs, the survival percentage of CFP-B16 in the group adding splenocytes and the control group remained high (89.5% and 101.0%, Fig. 3). The results suggested that CTLs could quickly and efficiently kill the CFP-B16 tumor cells in vitro.
Fig. 2.
In vitro large field imaging of CTLs (or splenocytes) reacting with CFP-B16. (a) and (b) Large field images of 10 min or 4 h after CTLs (a, red, CFSE-labeled) or splenocytes (b, red, CFSE-labeled) being added to CFP-B16 tumor cells (green), the effective cells/target cells ratio is 25/1. (a) Large field images. Scale bar: . (b) One visual field for large field image. Scale bar: .
Fig. 3.
Quantification of the survival percentage of CFP-B16, CFP-B16 + CTLs, and CFP-B16 + splenocytes 10 min or 4 h after addition. Results are mean ± SEM of 10 to 16 fields () from three independent experiments. ***; ns: no significant.
3.3. Dynamic Visualization of How CTLs Attack CFP-B16 Tumor Cells In Vitro
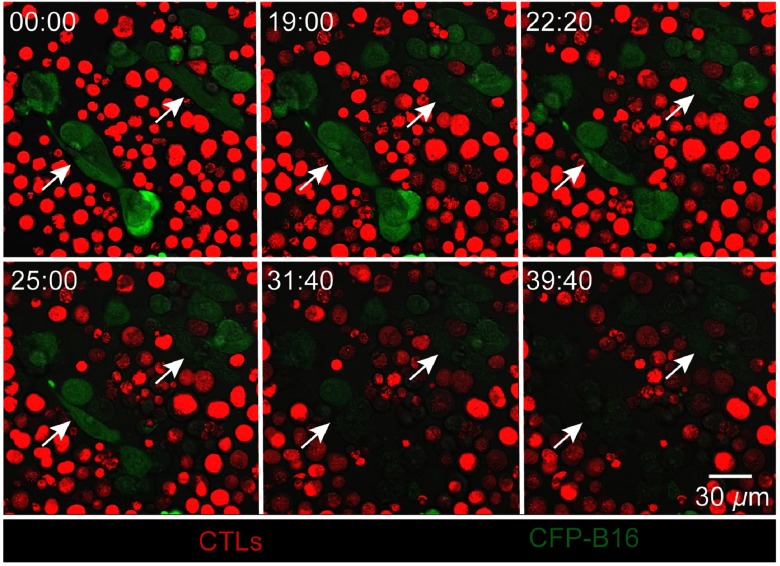
The whole process of CTLs’ interaction with CFP-B16 tumor cells and later killing them was imaged with real-time sequential confocal microscopy. As shown in Fig. 4 (and Video 1), a cluster of CTLs around some CFP-B16 tumor cells (CTLs: CFP-B16 = 10:1) interacted with them for about 10 min, then the fluorescent signals of the tumor cells gradually decreased, and finally, the CFP fluorescent signals completely disappeared from the tumor cells, the whole process lasting dozens of minutes. In the previous research, the loss of fluorescent signal of FPs which were stably expressed in the cell could represent the cell death.22,25,26 Compared with CTLs, the addition of splenocytes to CFP-B16 tumor cells did not cause the CFP signals of tumor cells to disappear during the entire observation period (; Fig. 5, Video 1). The results suggest that the cytotoxicity of CTLs during the process of destroying tumor cells is strong. Furthermore, imaging data provided a clear picture of the quick and efficient killing process of tumor cells by CTLs through direct visualization.
Fig. 4.
Dynamic visualization of how CTLs (red) attack CFP-B16 tumor cells (green) in vitro by real-time confocal microscopy (from Video 1), the CTLs/CFP-B16 ratio is 10/1. Scale bar: .
Fig. 5.
In vitro dynamic imaging of how CTLs kill CFP-B16 tumor cells and splenocytes interaction with CFP-B16. (a) The CTLs are shown in red (CFSE-labeled), the CFP-B16 tumor cells are shown in green, and (b) the CTLs (or splenocytes)/CFP-B16 ratio is 10/1. Scale bar: (Video 1, MPEG, 7.2 MB[URL: https://doi.org/10.1117/1.JBO.24.5.051413.1]).
3.4. Dynamic Imaging of How CTLs Specifically Attack tfRFP-B16 Tumor Cells In Vitro
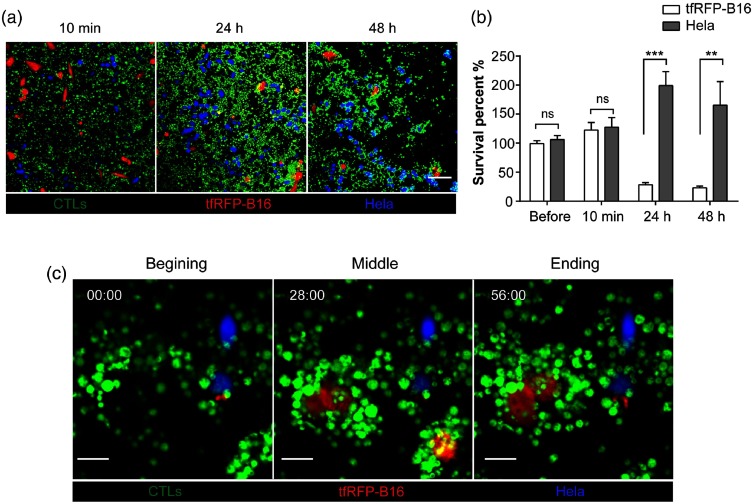
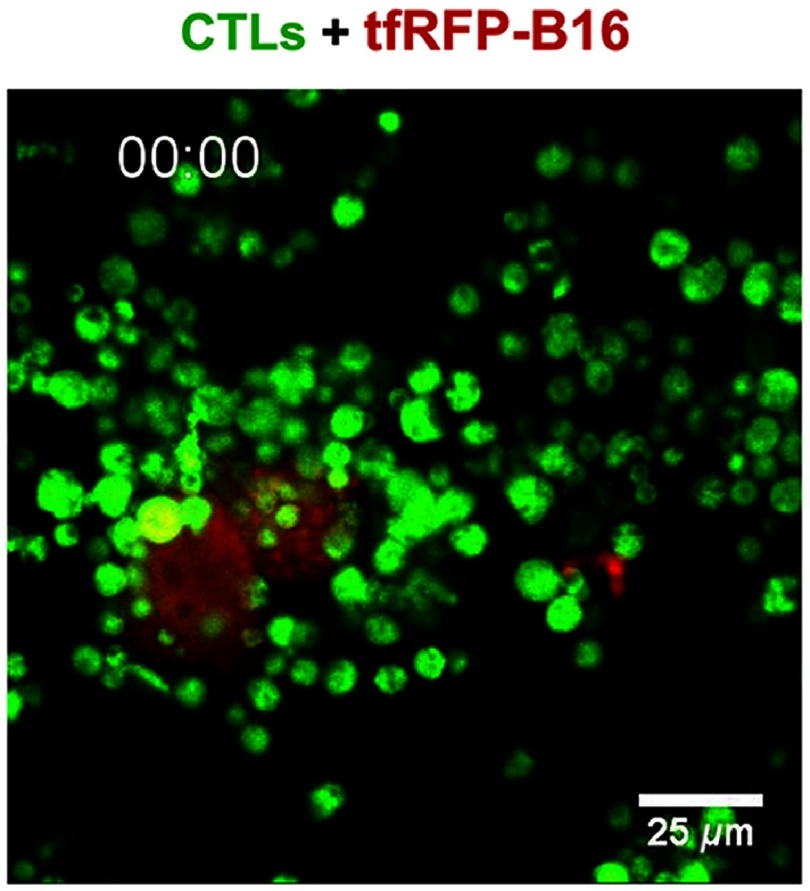
We also wanted to study the ability of CTLs to specifically attack tfRFP-B16 tumor cells in vitro. So, we used CFP-Hela cells as the negative control tumor cells, which were cocultured with tfRFP-B16 in glass-bottomed dishes; CFSE-labeled tfRFP-B16 tumor cells specific CTLs (CTLs: tfRFP-B16/CFP-Hela = 10:1) were added to the culture. We used confocal microscopy to observe and analyze the fluorescent signals of tfRFP-B16 and CFP-Hela cells at different times (including before adding CTLs, 10 min, 24 h, and 48 h after adding CTLs). The imaging data showed that there was no difference in survival percentages between the tfRFP-B16 and CFP-Hela before or 10 min after adding CTLs [Figs. 6(a) and 6(b)]. The survival percentage of tfRFP-B16 significantly decreased to 28%, 24 h after adding CTLs; and further decreased to 23%, 48 h after adding CTLs [Figs. 6(a) and 6(b)]. Compared with tfRFP-B16, the survival percentage of CFP-Hela markedly increased [199%, 24 h after, and 165%, 48 h after adding CTLs, Figs. 6(a) and 6(b)]. We also observed how in vitro primed CTLs specifically attacked tfRFP-B16 tumor cells and then successfully eliminated them [Figs. 6(c) and 7, Video 2]. Meanwhile, some CFP-Hela cells that were proximate to the killed tfRFP-B16 cells were not attacked by CTLs and emitted stable fluorescent signals during the whole process of CTLs killing tfRFP-B16 tumor cells [Fig. 6(c)]. All these results suggest that the whole-tumor-cell vaccine we used was able to induce tumor-antigen specific CTLs that had the ability to specifically reorganize and efficiently destroy the target tumor cells.
Fig. 6.
Confocal imaging of tfRFP-B16, CFP-Hela and CTLs in vitro. The CTLs/tfRFP-B16 (or CFP-Hela) ratio is 10/1. (a) Visualization of tfRFP-B16 (red), CFP-Hela (blue), and CTLs (green) at different times (10 min, 24 h, and 48 h) after adding CTLs. Scale bar: 100 μm. (b) Quantification of the survival percentage of tfRFP-B16 and CFP-Hela before or 10 min, 24 h, and 48 h after adding CTLs. Results are mean ± SEM of 6 to 10 fields from two independent experiments. **, ***, ns: no significant. (c) Confocal imaging of tfRFP-B16, CFP-Hela, and CTLs. Scale bar: .
Fig. 7.
In vitro dynamic imaging of how CTLs kill tfRFP-B16 tumor cells. The CTLs are shown in green (CFSE-labeled), the tfRFP-B16 tumor cells are shown in red, and the CTLs/tfRFP-B16 ratio is 10/1. Scale bar: (Video 2, MPEG, 8.68 MB[URL: https://doi.org/10.1117/1.JBO.24.5.051413.2]).
4. Discussion
In the ACT treatment, the adoptive CTLs play the most important role of successfully eliminating tumor cells. To optimize ACT immunotherapy, it is very important to understand the effector mechanisms of CTLs on the cancer cells in vivo. The molecular mechanisms of CTLs attacking target tumor cells comprise specific antigens of tumor cells that were recognized by TCRs of CTLs, and then (1) the Fas ligand (FasL) of CTLs binding to the FAS receptors of tumor cells and initiation of activation of procaspase-8/10 to induce the apoptosis of tumor cells; (2) the CTLs secretion of perforin to form transient pores on the membrane of target tumor cells to promote quick access of granzymes and then induce apoptosis of tumor cells.27,28 Although these molecular mechanisms of how CTLs recognize and kill tumor cells have been characterized in vitro, but little is known about these processes in the living organism especially in the tumor environment. Besides these molecular properties of CTLs, there are various parameters that affect the efficiency of CTLs to eliminate the cancer cells in the complex tumor microenvironment, including the immune suppression environment blocking CTLs to sufficiently infiltrate into the tumor areas and causing CTLs dysfunction,18,22,29,30 the maximal killing rate of the CTLs in different tissues,18,23,26,31,32 as well as recognition abilities of CTLs for the target tumor cells.22,33 Although some correlations have been observed between tumor microenvironment and efficiency of CTLs, the accurate mechanisms of complex parameters that affect the CTLs to induce regression of tumors in vivo are still not known clearly. To obtain in vitro primed and activated CTLs that successfully kill tumor cells after ACT treatment, without undesirable or unexpected effectors, it is necessary to assess the activity and cytotoxicity of CTLs on the target tumor cells in vitro before transferred the CTLs.
The characteristics of killing capability of CTLs include cytotoxicity, efficiency, and specificity. First, we analyzed the cytotoxicity and efficiency by large field imaging and dynamic time-lapse imaging to observe the whole process of how CTLs kill the B16 tumor cells (Figs. 4 and 5, Video 1), including three stages: (1) “binding and scanning,” dozens of CTLs simultaneously binding some CFP-B16 cells at the beginning; (2) “recognition,” the prolonged interactions (lasting for dozens of minutes) between CTLs and tumor cells (the CTLs recognition of the specific antigens on the tumor cells); and (3) “serial burst killing,” the CFP-B16 cells sequentially losing their fluorescent signals and morphologies and then burst and death in a very short time (for a few minutes). At “serial burst killing” stage, the perforin of CTLs rapidly formed pores on the tumor cell membrane to facilitate the granzymes of CTLs enter the tumor cell to induce apoptosis. This stage lasts for a few minutes.28,34 The large pores formed by perforin on the cell membrane, also allowed the “leakage” of FP of the tumor cell. It might be the reason for the tumor cells quickly losing their fluorescent signals in a short time. It is worth noting that, according to our result, the efficient killing ability of CTLs required the CTLs forming “combat groups” to destroy the target tumor cells. The accumulated CTLs in the tumor areas have been proved to be associated with antitumor efficacy and good survival outcomes.35–38 The mechanisms of a positive correlation between increased CTLs infiltration in various cancer and enhanced antitumor responses have not been elucidated clearly. Here, we give a possible reason that is CTLs sufficiently infiltrate to the tumor areas and form “combat groups” to improve the killing rate to successfully eliminate the tumor cells. Therefore, before ACT, it is necessary to use drugs or other methods to abrogate immunosuppression cells in the tumor areas to promote the infiltration of adoptive CTLs. Prior lymphodepletion has been used before the ACT treatment and proved to effectively enhance the curative effects of ACT.1,4,22
Although some studies presented the serial killing of CTLs on the tumor cells, the dynamic information of specific killing of CTLs on the tumor cells were not clearly revealed. Our study also presented the CTLs specifically recognizing and killing the target tfRFP-B16 tumor cells but not CFP-Hela cells. The imaging data presented that, the CTLs bind and scan with CFP-Hela cells [Figs. 6(a) and 6(c)], but do not go to the second (recognition) and third stages (serial burst killing) when they around the CFP-Hela cells. This result was different with our assumption and suggested that the recognition ability might be the most important parameter for the CTLs successfully eliminating the target tumor cells. Enhancing the recognition abilities of target tumor cells of CTLs in vivo could lead to successfully eliminate the tumor cells and be a good way to improve the efficiency of ACT. It is might be another reason for positive correlations between increased CTLs infiltration in tumor areas and good antitumor responses.
In this study, we also quantified the efficiency of CTLs’ destruction of B16 tumor cells (Fig. 3), which was similar to the results obtained by traditional CFSE and PI dual staining cytotoxicity assays by flow cytometry in our previous research.22 This finding suggested that this dynamic imaging method could be another useful and easy-to-operate method for evaluation of the activity, efficiency, and specific cytotoxicity of CTLs before ACT treatment. Up to now, although extensive studies focus on the apoptosis of tumor cells death induced by CTLs, nonapoptotic cell death pathways have been considered to exist, such as pyroptosis, necroptosis, or autophagy.27 It is very important to learn more about heterogeneous modalities of tumor cell death induced by CTLs and figure out their roles in the immunotherapy. Direct visualization results potentially help us to well understand the cytotoxic mechanism of CTLs on the target tumor cells and to develop ACT immunotherapy based on CTLs.
5. Conclusions
In this paper, we directly visualized the whole process of how CTLs kill tumor cells in vitro by large-field and real-time imaging methods. The imaging data presented the rapid, efficient, and specific killing process. The dynamic imaging results showed that the average time taken by CTLs to destroy some tumor cells in vitro was about dozens of minutes, which is much faster than CTLs’ destruction of tumor cells in vivo.23 According to our specific killing imaging data, CTLs’ recognizing the target tumor cells is the most important step for the CTLs efficient serial killing. Furthermore, the multicolor dynamic imaging of CTLs and tumor cells proved that it could become another effective and easy-to-operate method to assess the abilities of CTLs before ACT.
Supplementary Material
Acknowledgments
We thank Dr. Xiuli Liu and Xiangning Li of the Optical Bioimaging Core Facility of WNLO-HUST for the support in data acquisition. This work was supported by the National Natural Science Foundation of China (Grant Nos. 91442201 and 31700808), the China Postdoctoral Science Foundation funded Project (Grant No. 2017M612466), and the fundamental research funds for the Central Universities (Grant No. HUST: 2018KFYXKJC040).
Biographies
Shuhong Qi is a postdoc of Britton Chance Center for Biomedical Photonics, Wuhan National Laboratory for Optoelectronics, Huazhong University of Science and Technology. Her research interests are intravital imaging of immunotherapy for melanoma, optical imaging of neuroimmunology, and spatial transcriptomics. She received her PhD degree of biomedical engineering from Huazhong University of Science and Technology.
Hua Shi received her BE degree of pharmaceutics from China Pharmaceutical University, her MSc degree of bioinformatics from Wageningen University in the Netherlands, and her PhD degree of biomedical engineering from Huazhong University of Science and Technology. Her research interest is optical imaging in neuroscience and immunology.
Lei Liu is a PhD candidate in biomedical engineering at Huazhong University of Science and Technology. After completing his bachelor’s degree in biology science from Huazhong University of Science and Technology, he joined Britton Chance Center for Biomedical Photonics in 2012 and he has been working to develop an intravital molecular imaging technique. His research interest includes tumor immunology, dynamic imaging of CTLs and tumor cells, and intravital imaging.
Lili Zhou is a researcher in Biotechnology Company. After completing her bachelor’s degree in biotechnology from Northern University for Nationalities, she joined Britton Chance Center for Biomedical Photonics in 2011 and obtained her master’s degree in 2014. Her research interest included tumor immunology, adoptive cell therapy, and intravital imaging.
Zhihong Zhang is the director of Division of Biomedical Photonics, Wuhan National Laboratory for Optoelectronics, Huazhong University of Science and Technology (HUST) in China. She is the awardee of National Science Fund for Distinguished Young Scholars of China. Her current research focuses on (1) intravital optical molecular imaging for tumor immune, (2) multifunctional lipid nanoparticle for tumor imaging and therapeutics, and (3) fluorescent protein probes and multievent synchronization imaging in living cells.
Disclosure
The authors have no conflicts of interest to declare.
References
- 1.Restifo N. P., Dudley M. E., Rosenberg S. A., “Adoptive immunotherapy for cancer: harnessing the T cell response,” Nat. Rev. Immunol. 12(4), 269–281 (2012). 10.1038/nri3191 [DOI] [PMC free article] [PubMed] [Google Scholar]
- 2.Couzin-Frankel J., “Breakthrough of the year 2013. Cancer immunotherapy,” Science 342(6165), 1432–1433 (2013). 10.1126/science.342.6165.1432 [DOI] [PubMed] [Google Scholar]
- 3.Sharma P., Allison J. P., “The future of immune checkpoint therapy,” Science 348(6230), 56–61 (2015). 10.1126/science.aaa8172 [DOI] [PubMed] [Google Scholar]
- 4.Rosenberg S. A., et al. , “Adoptive cell transfer: a clinical path to effective cancer immunotherapy,” Nat. Rev. Cancer 8(4), 299–308 (2008). 10.1038/nrc2355 [DOI] [PMC free article] [PubMed] [Google Scholar]
- 5.Milstein O., et al. , “CTLs respond with activation and granule secretion when serving as targets for T-cell recognition,” Blood 117(3), 1042–1052 (2011). 10.1182/blood-2010-05-283770 [DOI] [PMC free article] [PubMed] [Google Scholar]
- 6.Berke G., “Killing mechanisms of cytotoxic lymphocytes,” Curr. Opin. Hematol. 4(1), 32–40 (1997). 10.1097/00062752-199704010-00006 [DOI] [PubMed] [Google Scholar]
- 7.Davenport A. J., et al. , “CAR-T cells inflict sequential killing of multiple tumor target cells,” Cancer Immunol. Res. 3(5), 483–494 (2015). 10.1158/2326-6066.CIR-15-0048 [DOI] [PubMed] [Google Scholar]
- 8.Ritter A. T., et al. , “Actin depletion initiates events leading to granule secretion at the immunological synapse,” Immunity 42(5), 864–876 (2015). 10.1016/j.immuni.2015.04.013 [DOI] [PMC free article] [PubMed] [Google Scholar]
- 9.Khazen R., et al. , “Melanoma cell lysosome secretory burst neutralizes the CTL-mediated cytotoxicity at the lytic synapse,” Nat. Commun. 7, 10823 (2016). 10.1038/ncomms10823 [DOI] [PMC free article] [PubMed] [Google Scholar]
- 10.Prajapati K., et al. , “Functions of NKG2D in CD8+ T cells: an opportunity for immunotherapy,” Cell. Mol. Immunol. 15(5), 470–479 (2018). 10.1038/cmi.2017.161 [DOI] [PMC free article] [PubMed] [Google Scholar]
- 11.Poenie M., Kuhn J., Combs J., “Real-time visualization of the cytoskeleton and effector functions in T cells,” Curr. Opin. Immunol. 16(4), 428–438 (2004). 10.1016/j.coi.2004.05.016 [DOI] [PubMed] [Google Scholar]
- 12.Vasconcelos Z., et al. , “Individual human cytotoxic T lymphocytes exhibit intraclonal heterogeneity during sustained killing,” Cell Rep. 11(9), 1474–1485 (2015). 10.1016/j.celrep.2015.05.002 [DOI] [PubMed] [Google Scholar]
- 13.Frick M., et al. , “Distinct patterns of cytolytic T-cell activation by different tumour cells revealed by Ca2+ signalling and granule mobilization,” Immunology 150(2), 199–212 (2017). 10.1111/imm.2017.150.issue-2 [DOI] [PMC free article] [PubMed] [Google Scholar]
- 14.Ng L. G., et al. , “Two-photon imaging of effector T-cell behavior: lessons from a tumor model,” Immunol. Rev. 221, 147–162 (2008). 10.1111/j.1600-065X.2008.00596.x [DOI] [PubMed] [Google Scholar]
- 15.Germain R. N., Robey E. A., Cahalan M. D., “A decade of imaging cellular motility and interaction dynamics in the immune system,” Science 336(6089), 1676–1681 (2012). 10.1126/science.1221063 [DOI] [PMC free article] [PubMed] [Google Scholar]
- 16.Riikka C. L., Pastila K., Lin C. P., “Label-free imaging immune cells and collagen in atherosclerosis with two-photon and second harmonic generation microscopy,” J. Innovative Opt. Health Sci. 09(1), 1640003 (2016). 10.1142/S1793545816400034 [DOI] [Google Scholar]
- 17.Bourzac K., “Medical imaging: removing the blindfold,” Nature 504(7480), S10–S12 (2013). 10.1038/504S10a [DOI] [PubMed] [Google Scholar]
- 18.Boissonnas A., et al. , “In vivo imaging of cytotoxic T cell infiltration and elimination of a solid tumor,” J. Exp. Med. 204(2), 345–356 (2007). 10.1084/jem.20061890 [DOI] [PMC free article] [PubMed] [Google Scholar]
- 19.Lin Q., et al. , “KillerRed protein based in vivo photodynamic therapy and corresponding tumor metabolic imaging,” J. Innovative Opt. Health Sci. 9(1), 1640001 (2016). 10.1142/S1793545816400010 [DOI] [Google Scholar]
- 20.Yang F., et al. , “In vivo visualization of tumor antigen-containing microparticles generated in fluorescent-protein-elicited immunity,” Theranostics 6(9), 1453–1466 (2016). 10.7150/thno.14145 [DOI] [PMC free article] [PubMed] [Google Scholar]
- 21.Qi S. H., Zhang Z. H., “Dynamic visualization the whole process of cytotoxic T lymphocytes killing the B16 tumor cells in vitro,” Proc. SPIE 9709, 970908 (2016). 10.1117/12.2214268 [DOI] [PMC free article] [PubMed] [Google Scholar]
- 22.Qi S., et al. , “Long-term intravital imaging of the multicolor-coded tumor microenvironment during combination immunotherapy,” eLife 5, e14756 (2016). 10.7554/eLife.14756.073 [DOI] [PMC free article] [PubMed] [Google Scholar]
- 23.Breart B., et al. , “Two-photon imaging of intratumoral CD8+ T cell cytotoxic activity during adoptive T cell therapy in mice,” J. Clin. Invest. 118(4), 1390–1397 (2008). 10.1172/JCI34388 [DOI] [PMC free article] [PubMed] [Google Scholar]
- 24.Li H., et al. , “Zigzag generalized levy walk: the in vivo search strategy of immunocytes,” Theranostics 5(11), 1275–1290 (2015). 10.7150/thno.12989 [DOI] [PMC free article] [PubMed] [Google Scholar]
- 25.Huang C., et al. , “Hybrid melittin cytolytic peptide-driven ultrasmall lipid nanoparticles block melanoma growth in vivo,” ACS Nano 7(7), 5791–5800 (2013). 10.1021/nn400683s [DOI] [PubMed] [Google Scholar]
- 26.Halle S., et al. , “In vivo killing capacity of cytotoxic T cells is limited and involves dynamic interactions and T cell cooperativity,” Immunity 44(2), 233–245 (2016). 10.1016/j.immuni.2016.01.010 [DOI] [PMC free article] [PubMed] [Google Scholar]
- 27.Martinez-Lostao L., Anel A., Pardo J., “How do cytotoxic lymphocytes kill cancer cells?” Clin. Cancer Res. 21(22), 5047–5056 (2015). 10.1158/1078-0432.CCR-15-0685 [DOI] [PubMed] [Google Scholar]
- 28.Halle S., Halle O., Forster R., “Mechanisms and dynamics of T cell-mediated cytotoxicity in vivo,” Trends Immunol. 38(6), 432–443 (2017). 10.1016/j.it.2017.04.002 [DOI] [PubMed] [Google Scholar]
- 29.Boissonnas A., et al. , “CD8+ tumor-infiltrating T cells are trapped in the tumor-dendritic cell network,” Neoplasia 15(1), 85–94 (2013). 10.1593/neo.121572 [DOI] [PMC free article] [PubMed] [Google Scholar]
- 30.Bauer C. A., et al. , “Dynamic Treg interactions with intratumoral APCs promote local CTL dysfunction,” J. Clin. Invest. 124(6), 2425–2440 (2014). 10.1172/JCI66375 [DOI] [PMC free article] [PubMed] [Google Scholar]
- 31.Gropper Y., et al. , “Culturing CTLs under hypoxic conditions enhances their cytolysis and improves their anti-tumor function,” Cell Rep. 20(11), 2547–2555 (2017). 10.1016/j.celrep.2017.08.071 [DOI] [PubMed] [Google Scholar]
- 32.Mrass P., et al. , “Random migration precedes stable target cell interactions of tumor-infiltrating T cells,” J. Exp. Med. 203(12), 2749–2761 (2006). 10.1084/jem.20060710 [DOI] [PMC free article] [PubMed] [Google Scholar]
- 33.Dudley M. E., et al. , “Cancer regression and autoimmunity in patients after clonal repopulation with antitumor lymphocytes,” Science 298(5594), 850–854 (2002). 10.1126/science.1076514 [DOI] [PMC free article] [PubMed] [Google Scholar]
- 34.Lopez J. A., et al. , “Perforin forms transient pores on the target cell plasma membrane to facilitate rapid access of granzymes during killer cell attack,” Blood 121(14), 2659–2668 (2013). 10.1182/blood-2012-07-446146 [DOI] [PubMed] [Google Scholar]
- 35.Galon J., et al. , “Type, density, and location of immune cells within human colorectal tumors predict clinical outcome,” Science 313(5795), 1960–1964 (2006). 10.1126/science.1129139 [DOI] [PubMed] [Google Scholar]
- 36.Piersma S. J., et al. , “High number of intraepithelial CD8+ tumor-infiltrating lymphocytes is associated with the absence of lymph node metastases in patients with large early-stage cervical cancer,” Cancer Res. 67(1), 354–361 (2007). 10.1158/0008-5472.CAN-06-3388 [DOI] [PubMed] [Google Scholar]
- 37.Kmiecik J., et al. , “Elevated CD3+ and CD8+ tumor-infiltrating immune cells correlate with prolonged survival in glioblastoma patients despite integrated immunosuppressive mechanisms in the tumor microenvironment and at the systemic level,” J. Neuroimmunol. 264(1–2), 71–83 (2013). 10.1016/j.jneuroim.2013.08.013 [DOI] [PubMed] [Google Scholar]
- 38.Galon J., et al. , “The continuum of cancer immunosurveillance: prognostic, predictive, and mechanistic signatures,” Immunity 39(1), 11–26 (2013). 10.1016/j.immuni.2013.07.008 [DOI] [PubMed] [Google Scholar]
Associated Data
This section collects any data citations, data availability statements, or supplementary materials included in this article.


