

Abstract
Recent advances in three-dimensional electron microscopy provide remarkable tools to image the interior of bacterial cells. Glimpses of cells at resolutions that are 1–2 orders of magnitude higher than those currently attained with light microscopy can now be obtained with cryo-electron tomography, especially when used in combination with new tools for image averaging. This Review highlights recent advances in this area and provides an assessment of the general applicability, current limitations and type of structural information that can be obtained about the organization of intact cells using tomography. Possible future directions for whole cell imaging are also discussed.
The visualization challenge
Deciphering the structure, function and spatial organization of multi-component molecular machines inside the fluid architecture of cells is an emerging frontier in cell biology. However, the importance of this problem has been recognized for a long time. Nearly two decades ago, Goodsell, who popularized scale drawings of cells and viruses in numerous scientific journals, made the following statement1: “A clear picture of the interior of a living cell that shows the average distribution of molecules at the proper scale, the proper concentration and with no missing parts, seems to me to be central to the understanding of the workings of life. However, this type of picture is virtually absent from the popular literature. There is no single experimental method to determine the information needed for their construction. Electron microscopy gives a view that is too coarse: subcellular structure is studied but the individual molecules are not seen”.
The problem that Goodsell identified is at the heart of modern cell biology and reflects the growing interest in deciphering the connection between structure and function in the context of an intact cell. Fortunately, Goodsell’s categorization of electron microscopy as a tool incapable of providing a view of individual molecules in cells is no longer valid. Methods in three-dimensional (3D) electron microscopy such as electron tomography2–4 now provide powerful new tools to bridge the gap in knowledge between cellular architecture as revealed by light microscopy, and the molecular structures of individual protein assemblies studied by X-ray crystallography, nuclear magnetic resonance (NMR) spectroscopy and cryo-electron microscopy5–9. These new imaging technologies, coupled with powerful genetic tools for the manipulation of cell function and computational tools for the analysis of complex data, provide new and exciting opportunities to understand bacterial physiology at a molecular level.
Despite the great potential of electron tomography, many fundamental questions in structural microbiology also currently lie beyond its reach. Useful images cannot be obtained at present from many commonly studied bacteria, and for those bacteria that can be analysed, there is considerable variation in the quality of information that can be obtained from different regions of the cell and from different types of macromolecular complexes in the cell. Yet, in at least some cases, molecular resolution can be attained and, with the use of advanced methods for image averaging, structure and conformational changes in specific membrane proteins can be described in the context of the native cell membrane. The Review highlights recent successes of bacterial electron tomography and assesses the unique features of the bacteria that have been most amenable to this technology. Challenges that lie ahead are described and an overview of other emerging technologies that may become available in the near future for high-resolution imaging of whole bacterial cells is provided.
Introduction to electron tomography
The principles underlying 3D imaging of a whole bacterial cell by electron tomography are the same as those developed decades ago for computerized axial tomography. A series of projection images are recorded from the specimen by varying its orientation relative to the incident electron beam. Each of these images contains information about the 3D structure of the cell collapsed onto a single plane, and the actual 3D arrangement of components in the specimen can be recovered by computationally combining the information in the images. FIG. 1 outlines the practical steps that precede the generation of a 3D image of a single cell by electron tomography.
Figure 1 |. From cell to tomogram.

Schematic diagram illustrating the sequence of steps involved in obtaining a three-dimensional image of a plunge-frozen cell using cryo-electron tomography. a | A small volume (typically ~ 3–5 μl) of a suspension of cells in culture is deposited on a holey carbon grid and then plunge-frozen in liquid ethane cooled to temperatures of ~ 100 K by liquid nitrogen. b | The grid is then transferred into the column of an electron microscope for collection of a series of images at varying tilts. c | The series of tilted images is then converted to a three-dimensional volume (tomogram) that provides a representation of the distribution of densities of cellular components.
The first and crucial step in specimen preparation is ‘vitrification’ of the cell suspension by rapidly plunging a thin film of the bacterial culture into a cryogen such as liquid ethane that is cooled by liquid nitrogen to temperatures of ~ 100 K. The bacterial suspension is typically deposited on an electron microscope grid covered by a carbon film with holes; bacteria that end up in a hole are embedded in a thin layer of ice and can be imaged without interference from the carbon film. The speed of plunge-freezing is such that it results in the formation of vitreous ice capturing the cells in their native state at the instant of freezing. Although there have been improvements in automation of plunge-freeze techniques over the years10,11, the original ideas and methods pioneered by Dubochet and colleagues over two decades ago12 have remained largely unchanged. The frozen grid is loaded at liquid nitrogen temperature onto a specimen holder that is then transferred onto the specimen stage of the microscope, which is maintained throughout the imaging process at temperatures of ~ 100 K or lower.
Almost all current bacterial tomography uses microscope specimen stages that are cooled by liquid nitrogen. Commercial instruments with specimen stages that are cooled by liquid helium and which can operate at temperatures below 10 K are also available. Although this capacity has been available for many years, advances in cryo-electron tomography to date have come with the use of instruments that operate at liquid nitrogen temperatures. Initial studies assessing cryogen performance suggest that the tomographic data obtained at helium temperatures may not be better than that collected at liquid nitrogen temperatures13, but it is conceivable that the methods needed to obtain data of similar or better quality at liquid helium temperatures remain to be developed. Over the past decade, automation of tomographic data collection has arguably been the most important advance in the development of hardware for electron microscopy. Automation allows great precision and reproducibility in data acquisition and is perhaps the single biggest factor that has led to the increase in tomography of prokaryotic and eukaryotic cells14 alike.
There are numerous strategies for converting the series of images obtained at different tilts from an electron microscope into a 3D volume that is referred to as a ‘tomogram’. The underlying principle is to carry out the inverse of the process that generates each projection image by re-projecting the image back along the direction of the projection. Electron microscopes record projection images, and each image contains information from all heights of the specimen collapsed onto a single plane. However, by recording a series of images in which the orientation of the specimen is varied relative to the incident beam over a wide angular range, information required to describe the 3D structure of the imaged object can be obtained. The density of each image in the tilt series is first smeared back evenly along the direction of the electron beam into an imaginary box, the height of which is approximately equal to the thickness of the specimen. This procedure is repeated for each of the tilted images. When these serial back projection profiles are combined, the spatial distribution of density in the superimposed reconstruction is proportional to the original density of the object. Programs that implement these methods are available both as commercial packages and in freely distributed academic software packages such as IMOD15 or those based on the package ImageJ developed at the National Institutes of Health (NIH), USA16,17.
The raw tomograms contain information from all regions of the specimen that scatter the incident electrons, including regions inside and outside the cell. The images and tomograms are generally rather noisy, in part because of the need to use low electron doses in order to minimize radiation damage to the specimen during data collection. To improve image contrast, tomograms are often ‘denoised’ to facilitate object recognition by suppressing higher frequencies in the image. Following denoising, tomograms can be ‘segmented’ to highlight selected regions of the volume such as ribosomes, membranes or filaments using manual or automated procedures to appreciate the broad organizational features of the cell. Data interpretation by segmentation is largely qualitative, but efforts to obtain a better assessment of the fidelity of recovering the information in the images using algorithms such as non-linear anisotropic diffusion are underway18,19.
Imaging intact bacterial architecture
Cryo-electron tomography has enabled determination of the 3D architectures of several types of intact bacterial cells in the frozen state. Rapid freezing of thin aqueous films of bacterial cells, typically at rates exceeding 105 K per second12, leads to rapid vitrification, which therefore preserves the spatial arrangement of cellular components present at the moment of freezing. Imaging these intact frozen cells under conditions that minimize radiation-induced damage (that is, preserving structure close to the native physiological state) has yielded insights into the internal organization of many commonly studied Gram-negative bacteria, archaebacteria, cyanobacteria, mycobacteria and mycoplasma cells20–35. Gram-positive bacteria are a notable exception, in part because the peptidoglycan layer36 is a significant addition to the overall thickness of the cell, making acquisition of high-quality transmission electron microscopic images through the cell difficult. In TABLE 1, we list published examples (up to 2008) of whole bacterial cells that have been imaged by cryo-electron tomography (see Supplementary information S1 (figure)), and in FIG. 2, we show selected images from a few of these publications that capture key highlights of the work. Several common themes have emerged from the analyses so far, as discussed in the following section.
Table 1 |.
Cryo-electron tomography of intact bacterial cells
| Cell type | Main features identified | Microscope location | Year | Refs |
|---|---|---|---|---|
| Archaea | ||||
| Pyrobaculum aerophilum, Sulfolobus spp | S-layer | Martinsried, Germany | 1998 | 24 |
| Pyrodictium cannulae | Cannulae, vesicles | Martinsried, Germany | 2003 | 33,39 |
| ARMAN | Tubular internal structures | Berkeley, USA | 2008 | 23 |
| Nanoarchaeum equitans | Cytoplasmic fibres | Martinsried, Germany | 2008 | 29 |
| Gram-negative bacteria (rod-shaped) | ||||
| Bdellovibrio bacteriovorus | Nucleoid, cytoplasmic filaments | NCI/NIH, USA | 2008 | 20 |
| Caulobacter crescentus | Cytoplasmic filaments, chemotaxis receptors, dense granules | Caltech, (USA; NCI/NIH, USA; Berkeley, USA | 2006–2008 | 21,45, 42,46 |
| Escherichia coli | Chemotaxis receptors | NCI/NIH, USA | 2007, 2008 | 35,87 |
| Flavobacterium johnsoniae | Surface filaments | NCI/NIH, USA | 2007 | 32 |
| Rhodopseudomonas viridis | Photosynthetic membranes | Weizmann, Israel | 2008 | 31 |
| Magnetospirillum magneticum and Magnetospirillum gryphiswaldense (magnetotactic bacteria) | Magnetosomes | Caltech, USA; Martinsried, Germany | 2006 | 30,43 |
| Gram-negative bacteria (spirochetes) | ||||
| Spiroplasma melliferum | Cytoplasmic filaments, ribosome distribution | Martinsried, Germany | 2005, 2006 | 37,86 |
| Treponema primitia | Flagellar motor, cell surface components | Caltech, USA | 2006, 2008 | 28,38 |
| Treponema denticola | Periplasmic and cytoplasmic filaments | Albany, USA | 2008 | 27 |
| Borrelia burgdorferi | Periplasmic filaments | Albany, USA | 2008 | 22 |
| Miscellaneous | ||||
| Prochlorococcus spp (cyanobacterium) | Photosynthetic lamellae | Albany, USA | 2007 | 34 |
| Mycobacterium bovis bacille Calmette-Guérin and Mycobacterium smegmatis | Membrane bilayer structure | Martinsried, Germany | 2008 | 26 |
| Mycoplasma pneumoniae | Attachment organelle | Heidelberg, Germany; Caltech, USA | 2006 | 25,41 |
ARMAN, archaeal Richmond Mine acidophilic nanoorganisms; NCI, National Cancer Institute; NIH, National Institutes of Health.
Figure 2 |. Selected examples of findings from cryo-electron tomography of bacterial cells.
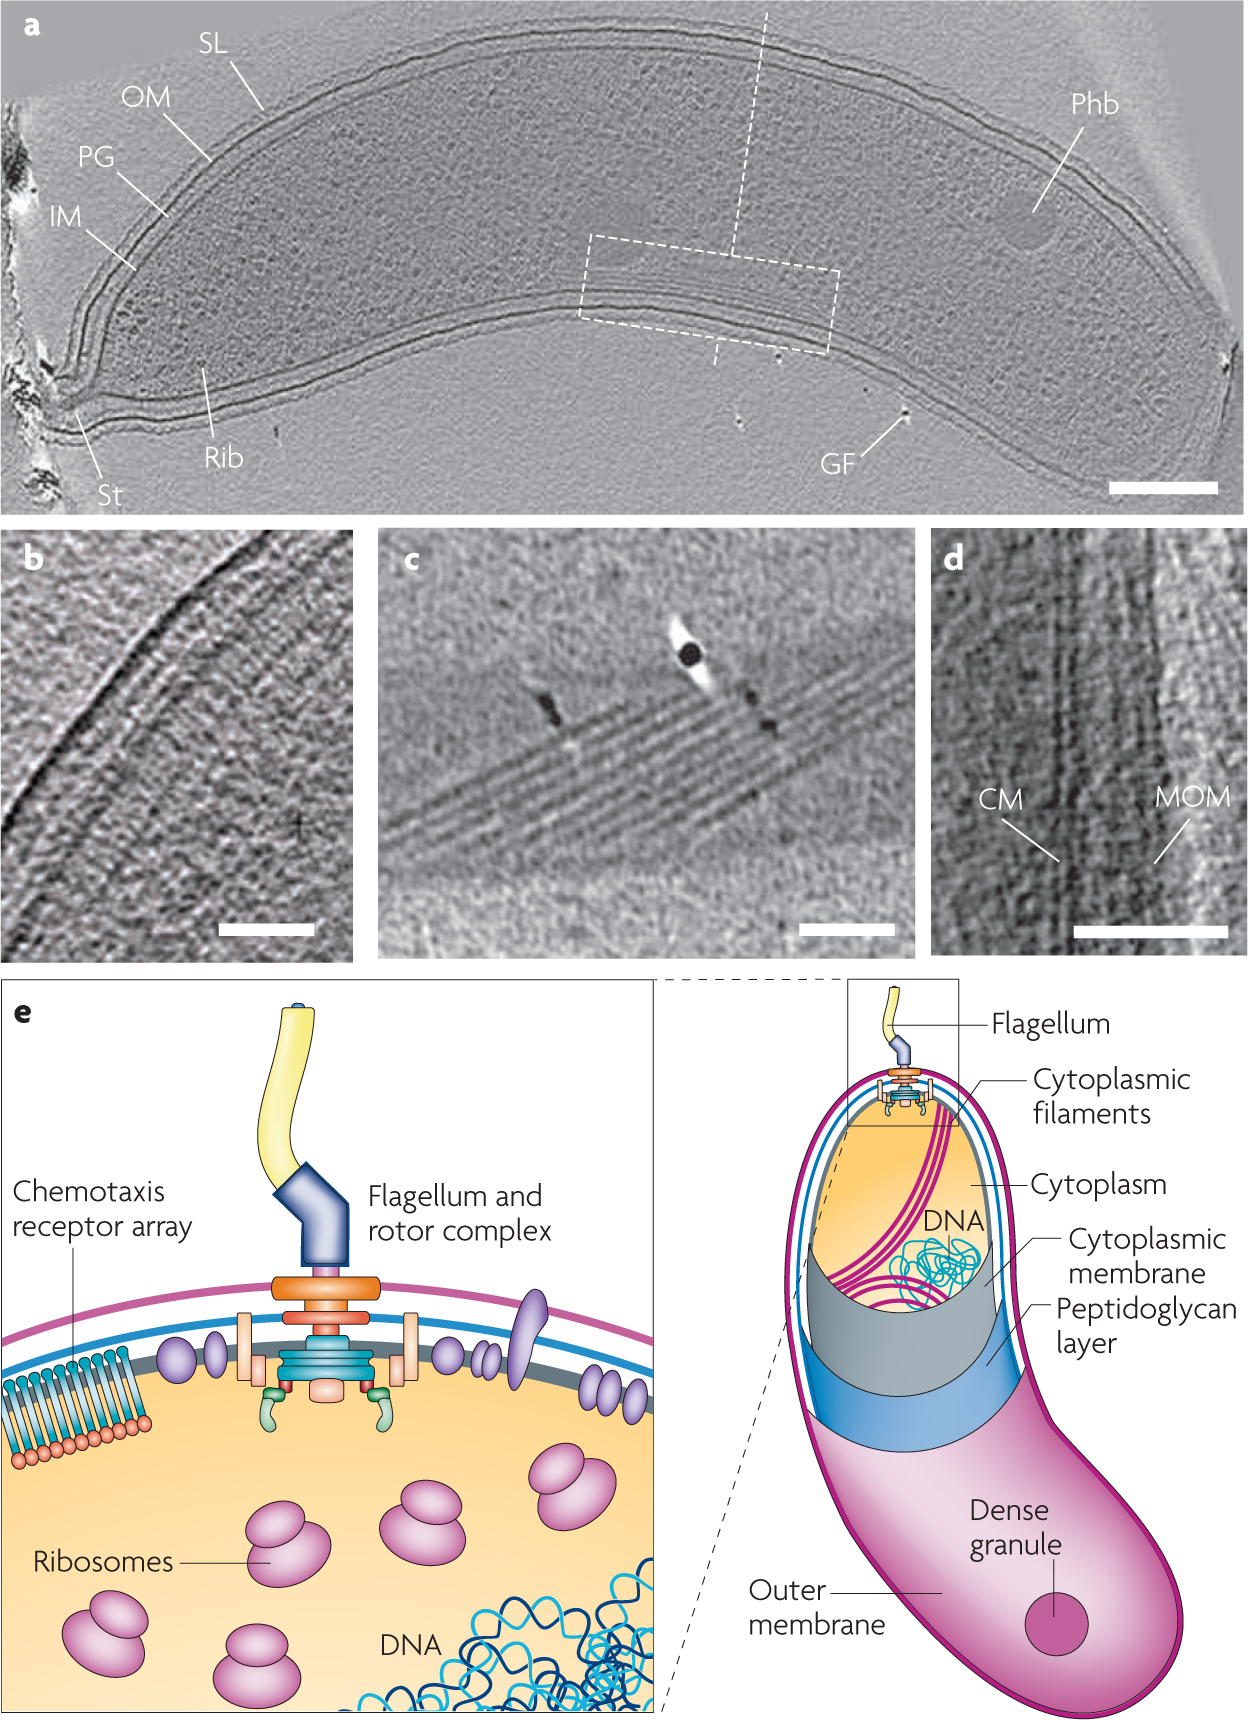
(see TABLE 1 and Supplementary information S1 (figure) for complementary information). a | 19 nm tomographic slice from the tomogram of a Caulobacter crescentus cell highlighting multiple features including filaments adjacent to the inner membrane (dashed white box). Scale bar 200 nm. b | 5 nm tomographic slice from a wild-type Escherichia coli cell showing the polar region of the cell and delineation of inner and outer membranes which contain a chemotaxis receptor array composed of chemoreceptor, CheA and CheW molecules. Scale bar 50 nm. c | 1.8 nm longitudinal slice from tomogram of a Borrelia burgdorferi cell highlighting a ribbon of nine periplasmic flagella that forms a right-handed arch in the cytoplasm at the bottom of the cell, as viewed from the top. Scale bar 200 nm. d | x–y tomographic slice from tomogram of a Mycobacterium bovis bacille Calmette-Guérin cell illustrating the cytoplasmic membrane (CM), and the mycobacterial outer membrane (MOM). Scale bar 50 nm. e | Schematic view of a bacterial cell modelled on electron tomographic analysis of the Gram-negative bacterium Bdellovibrio bacteriovorus20. The inset highlights insights gained into bacterial architecture such as the precise organization of membranes, the arrangement of the nucleoid, the distribution of cytoplasmic filaments as well as the three dimensional structures of a large number of protein complexes in the membrane and the cytoplasm. GF, gold fiducial for image alignment; IM, inner membrane; OM, outer membrane; Phb, putative poly-b-hydroxybutyrate granule; PG, peptidoglycan layer; Rib, probable ribosome; SL, surface layer; St, stalk. Part a is reproduced, with permission, from REF. 21 © (2006) Blackwell Scientific publications. Part b is modified, with permission, from REF. 35 © (2007) National Academy of Sciences. Part c is reproduced, with permission, from REF. 22 © (2009) American Society for Microbiology. Part d is reproduced, with permission, from REF. 26 © (2008) National Academy of Sciences.
Readily detectable subcellular features
The most distinct and easily resolved features by cryo-electron tomography are membranes at the peripheries of the cells, such as inner and outer membranes in Gram-negative bacteria20,37,38, the S-layer in certain bacteria or archaea24,39, and the peptidoglycan layer in Gram-negative bacteria (TABLE 1). Internal membranes such as those incorporating specialized components in the photosynthetic bacterium Rhodopseudomonas viridis are also easily resolved31, and in certain cases, the resolution has been adequate to observe the 4 nm spacing between the two leaflets of the lipid bilayer35, which provides a measure of the types of features that can be resolved.
Particles with strong contrast, that have dimensions consistent with the sizes and shapes of ribosomes, have also been seen in lysed cells40 and in virtually all of the intact cells that have been imaged by cryo-electron tomography. In a few instances, analyses have been taken beyond qualitative observation in attempts to statistically quantify the entire complement of ribosomes present in cellular tomograms19,23,41. The nucleoid area is visualized perhaps most clearly in the highly packed genome of the predatory bacterium Bdellovibrio bacteriovorus20 but is also evident in other cell types (see Supplementary information S1 (figure)) as a dispersed central region that excludes ribosomes. Filaments in the cytoplasm20,21,42, the periplasm22 and even on the surface of gliding bacteria32 have been visualized, although their molecular composition remains controversial or unknown in most cases.
Unusual snapshots, such as the unexpected image capture of a virus that was found attached to a small archaeal cell23 or trapped magnetite particles in invaginated cellular membranes30,43 have also been documented. Other features that have been commonly observed include chemoreceptor arrays at the cell pole35,44,45, phosphorus-rich cytoplasmic bodies, the elemental compositions of which have been verified in some instances by electron spectroscopic imaging20,46, carboxysomes34, which are storage sites for the ubiquitous Rubisco enzymes, the rotor complex, and other components of the bacterial flagellum20,38.
Detecting smaller complexes
Despite the success in the imaging of membranes, filaments, ribosomes and some prominent assemblies, it is fair to say that the vast majority of cellular components have yet to be visualized by cryo-electron tomography. During phase-contrast imaging of thin specimens by cryo-electron microscopy, the specimen is deliberately defocused to generate contrast from all regions that diffract electrons, this then allows specific components to be identified by the differences in their electron scattering and that of their surroundings. Even in the best case, this contrast is weak because low electron doses are used in cryo-electron microscopy to minimize radiation damage47. However, as nucleic acids scatter electrons differently because of their different elemental composition, ribosomes stand out easily against a largely protein-only background. Similarly, membranes and filaments are easily distinguished because of their extended nature and their higher local scattering profiles as compared with the surrounding milieu. Chemoreceptors are clustered in an identifiable region of the cell35, and have long cytoplasmic domains, making their identification relatively easy and unambiguous. However, most proteins generate similar scattering profiles and, because they rarely show macroscopic segregation, do not stand out against the background. One way to obtain additional information is to use procedures such as template matching48 in which the 3D volume is searched against a low resolution template of structures that are expected to be present such as the bacterial protein GroEL. Such methods have already been shown to have promise in the imaging of synthetic, reconstituted vesicles in which there are clear backgrounds with only buffer49. However, they are not likely to be useful to detect proteins in the complex milieu of a cell unless there is some unique chemical feature of the protein in question that lends itself to higher contrast than those in its immediate vicinity, or there are specialized circumstances such as partially lysed cells, in which selected components can be visualized at higher signal-to-noise ratios than is possible in intact cells.
Mimicking the success that labelling methods (for example with green fluorescent protein or similar moieties) have had in the detection of smaller complexes by optical microscopy, attempts have been made to tag proteins with electron-dense moieties to improve contrast for electron tomography. For example, the addition of metallothionein sequences to proteins enables the binding of heavy metals that could provide contrast50,51. The bound metals could potentially be detected simply by virtue of the higher contrast that would result from their higher atomic number, or by spectroscopic imaging methods that detect atom-specific signatures52,53, although these latter methods could need the use of significantly higher electron doses. Photosensitive arsenic compounds such as ReASH54, which can be used for site-specific protein labelling in both fluorescence and electron microscopic imaging, have been useful for localizing membrane proteins and studying organellar architecture in mammalian cells and could well be applied to the study of bacterial morphology. Additional strategies for the detection of smaller structures are based on correlative imaging methods55,56 that allow the use of fluorescence imaging to locate a particular region of interest in the cell for targeted electron tomographic imaging, which could provide both a better spatial context and a way to restrict the search for molecular signatures to a small region of the cell. All of these technologies are still in an early phase and will need considerable development before their routine use can be advocated.
The use of labelling methods may be useful not just for electron tomography, but for a complementary approach that uses soft X-rays to obtain 3D images of frozen cells at resolutions that may exceed 100 nm in the near future. Although initial experiments were carried out using synchrotron sources, which guarantee a high photon flux57, there is now an increase in the availability of simpler laboratory radiation sources58 and tabletop sources59–61 that can provide in-house 3D cellular imaging. Despite the modest resolutions attained with these methods, they may still be valuable for protein localization by tagging proteins with X-ray opaque probes such as gold and using detection strategies based either on simple absorption or using specific absorption edges of atoms such as titanium (TiO2 nanoparticles) for differential imaging62.
The importance of size
One common theme that emerges from a survey of bacteria that are amenable to analysis by electron tomography (TABLE 1) is that width is by far the most important factor determining success. At the intermediate voltages (300 kV) currently used for cryo-electron tomography, the mean free path (that is, the distance travelled between two scattering events) of an electron through the specimen is ~ 350 nm63. This roughly corresponds to the average width of the slimmest bacteria such as Bdellovibrio bacteriovorus and Caulobacter crescentus, the internal cellular contents of which can be visualized with the highest contrast. Bacteria such as Flavobacterium johnsoniae (see Supplementary information S1 (figure)) are slightly wider (~ 400 nm), and bacteria such as Escherichia coli can be even wider (~ 1000 nm). At these larger widths, cellular components with high local contrast, such as the photosynthetic membranes in Rhodopseudomonas viridis, can still be visualized31, but even well-defined complexes such as ribosomes can be hard to locate reliably. Nevertheless, polar regions of the cells can still be analysed, and much can be learnt about protein complexes such as chemoreceptor assemblies in this region of the cell35. Therefore, the simple answer to why only a handful of proteins can be presently visualized in whole cells is that, unless there is something different about their composition that results in a significantly different scattering profile, there is not enough contrast to locate them. Finding a means to enhance protein visibility in electron tomographic data is clearly an important area for future development.
A complementary approach to imaging intact cells by electron tomography is to eliminate the challenge of examining thick cells by dividing the cell into sections. Although this approach does not enhance contrast, it does offer significant advantages for imaging cellular components that are otherwise poorly visualized in intact cells, as discussed below.
Strategies for sectioning frozen cells
Collecting images that are useful for tomographic reconstruction requires transmission of electrons through the specimen with minimal inelastic scattering. This sets ~ 0.5 mm as the upper limit for specimen thickness at which images have enough contrast so that subcellular structures can be detected with state-of-theart microscopes. A thickness of ~ 0.5 mm at zero degrees tilt corresponds to a thickness of ~ 1 mm at 60 degrees tilt. Internal membranes, and structures at the thinner edges of the cell, can still be somewhat discerned from tomograms obtained from bacteria as thick as ~ 1 mm, but minimal information is gained about the structure of the rest of the cell. Historically, cells and tissues have been investigated by imaging sections prepared in a microtome to overcome this limitation (FIG. 3a).
Figure 3 |. Two alternative strategies for three-dimensional reconstruction of thick cells.

Cells that are too thick for imaging in the intact state can be first vitrified by freezing rapidly at high pressures, and then sectioned in a microtome. a | A ribbon of serial sections is transferred to an electron microscopic grid, imaged to obtain either a series of 2D or 3D images that can then be stacked together to obtain a 3D reconstruction of the entire cell. b | Alternatively, frozen cells can be progressively abraded using ion-abrasion scanning electron microscopy, and a 3D representation of the cell can be obtained by stacking together the series of images of each newly created surface. Figure reproduced, with permission, from REF. 64 © (2007) Academic Press.
Cells that have been frozen rapidly at high pressure to prevent damage from ice crystal formation can be sectioned at ultra-low temperatures into slices without loss of the ‘vitrified’ state of the cellular material. Sections can be imaged at liquid nitrogen temperatures to obtain projection images. Alternatively, a series of tilted images can be collected and combined to obtain a representation of the 3D volume using electron tomography. Therefore, one method to determine the 3D architecture of thicker cells is to section a small pellet of frozen cells into a series of ribbons. Each of these sections is thin enough to be imaged by transmission electron microscopy, and the individual 2D images or section tomograms can be combined together to generate a tomogram of the larger cell. This procedure, referred to sometimes as CEMOVIS (cryo-electron microscopy of vitrified sections) is a promising approach not just for 3D imaging, but also to reveal specific aspects of cellular structure such as lipid membranes or cytoplasmic filaments (TABLE 2).
Table 2 |.
Cryo-electron microscopy of sections from intact, vitrified bacterial cells
| cell type | Main features identified | Laboratory location | Year | Refs |
|---|---|---|---|---|
| Gram-negative bacteria | ||||
| Escherichia coli, Pseudomonas aeruginosa | Membrane distribution and peptidoglycan layer | Lausanne, Switzerland | 2003 | 69 |
| E. coli | Lipid bilayer leaflets, chemotaxis receptors | NCI/NIH, USA | 2004 | 72 |
| Filaments | Cambridge, UK | 2008 | 75 | |
| Gram-positive bacteria | ||||
| Bacillus subtilis | Delineation of peptidoglycan, periplasm | Lausanne, Switzerland | 2005 | 36 |
| Staphylococcus aureus | Cell division | Guelph, Canada | 2006, 2007 | 67,70 |
| Streptococcus gordonii, Enterococcus gallinarum | Septum in dividing cells | Lausanne, Switzerland | 2006 | 68 |
| Mycobacterial family | ||||
| Mycobacterium smegmatis, Mycobacterium bovis bacille Calmette-Guérin, Corynebacterium glutamicum | Inner and outer membrane bilayer profiles | Lausanne, Switzerland; Martinsried, Germany | 2008 | 26,73 |
| Cyanobacteria | ||||
| Lyngbya majuscula | Membranes and S-layer | Lausanne, Switzerland | 2004 | 89 |
| Prochlorococcus spp. | Photosynthetic membrane arrangement | Albany, USA | 2008 | 34 |
| Radiation-resistant bacteria | ||||
| Deinococcus radiodurans | Nucleoid region | Lausanne, Switzerland | 2005, 2006 | 74,91 |
NCI, National Cancer Institute; NIH, National Institutes of Health.
Ion-abrasion scanning electron microscopy is yet another complementary strategy to image large cells and tissue. It uses a focused beam of gallium ions to section through the material by ion abrasion (FIG. 3b) and the newly created surface can then be imaged with a scanning electron beam. Iterating this procedure builds up the 3D structure one surface at a time. The validity of this approach has been successfully demonstrated for routine 3D imaging of plastic-embedded specimens at ~ 6 nm in-plane resolution64, but the application to frozen specimens is still in an early phase of development65. The use of the focused ion beam is not restricted to being coupled with scanning electron beam imaging; it can also be used to reduce the thickness of frozen thicker specimens to enable imaging by cryo-electron tomography66.
Insights from imaging thin sections
Advances in the technology for rapid freezing and the use of microtomes that can operate at temperatures of −150 °C or below have allowed the preparation of thin sections from frozen bacterial cells with thicknesses as small as 20 nm (TABLE 2). Selected examples of images obtained from these cryo-sections are shown in FIG. 4, with a more complete collection presented in the Supplementary information S2 (figure). In comparison to images from whole cells, internal regions of cells such as membranes and ribosomes can be seen with far higher contrast in these sections. Images from vitreous sections have been particularly useful to resolve fundamental structures, such as a periplasmic zone in Gram-positive bacteria67,68, and to provide insights into the precise organization of membranes in a range of bacteria26,36,67–73. Structural questions such as the packing arrangement in the nucleoid region74, and the localization of cytoplasmic filaments involved in plasmid DNA segregation75 have been easier to address using thin sections where the components can be visualized with much better contrast in the absence of interference from the depth of the whole cell. It is important to note, however, that although the imaging of vitreous sections can provide higher contrast, the entities that are visualized are the same as those that have also been observed in whole cells, albeit at a somewhat lower contrast.
Figure 4 |. Selected findings from cryo-electron microscopy of vitreous sections of high-pressure frozen bacterial cells.
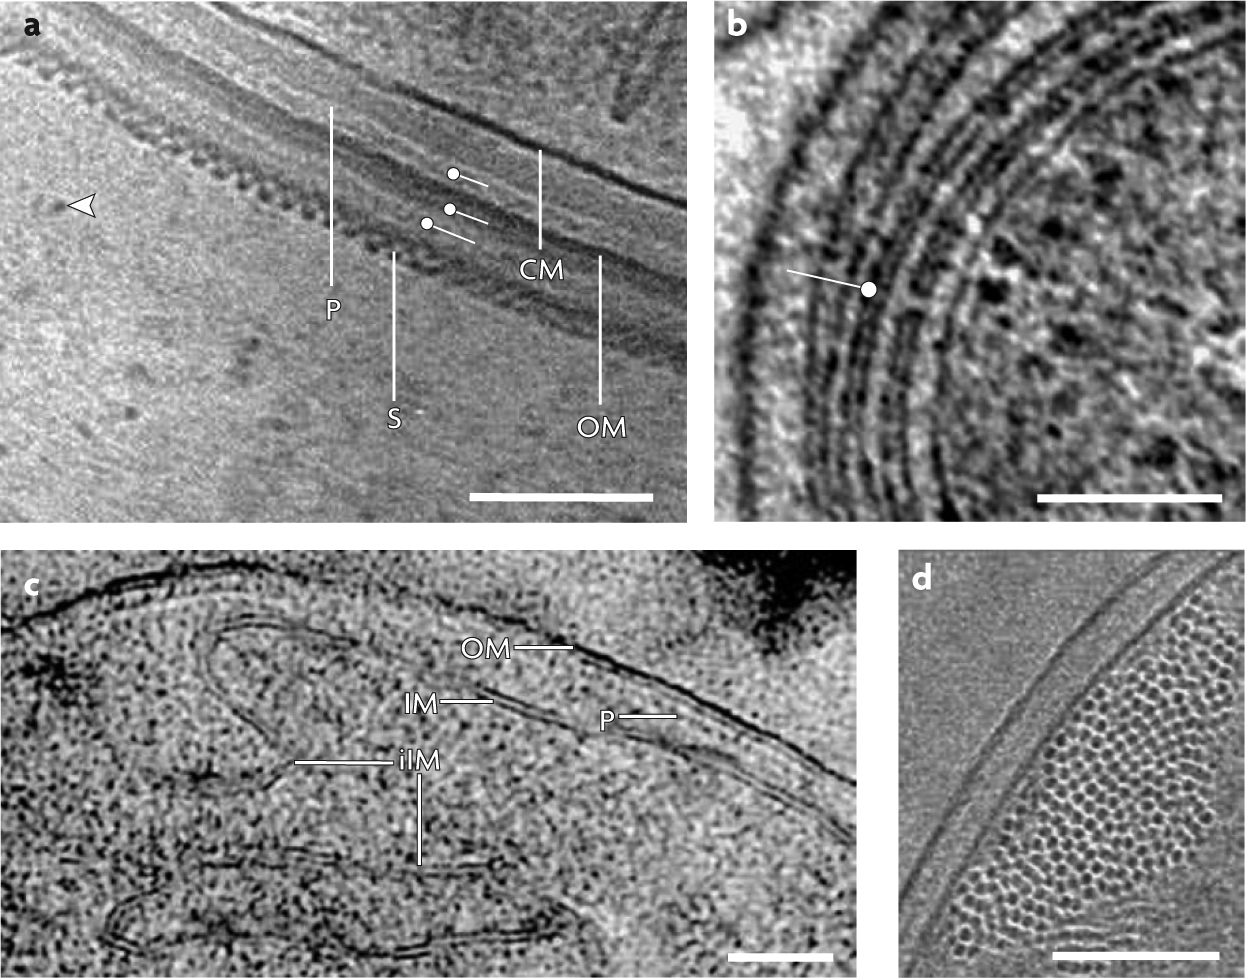
a | Cryo-electron microscopy image of a vitreous section of the cyanobacterium Lyngbya majuscula cell envelope identifying the peptidoglycan layer (P), outer membrane (OM), putative S-layer (S), cytoplasmic membrane (CM) and several other additional layers (labels) and zones of the extracellular matrix containing 4 nm filaments (arrowhead) (scale bar 100 nm). b | 1.8 nm tomographic slice of frozen-hydrated cryo-section of a high-pressure frozen Prochlorococcus MIT9313 cell showing intracytoplasmic lamellae (label) connected by a membrane-lined channel (scale bar 100 nm). c | Projection image of vitreous section from a high-pressure frozen Escherichia coli cell engineered to overproduce the serine chemoreceptor. The two leaflets of the OM and of the inner membrane (IM) as well as the P are visible, as is the invaginated IM (iIM), a consequence of receptor overproduction (scale bar 50 nm). d | End-on view of filaments of the bacterial analogue ParM contained within a vitreous cryosection of an E. coli cell expressing high levels of ParM using a T7-driven promoter on a high-copy number plasmid (scale bar 10 nm). Part a is reproduced, with permission, from REF. 89 © (2004) Oxford University Press. Part b is reproduced, with permission, from REF. 34 © (2007) American Society for Microbiology. Part c is reproduced, with permission, from REF. 72 © (2004) Blackwell Scientific Publications. Part d is reproduced, with permission, from REF. 75 © (2008) American Assn for the Advancement of Science.
In general, there are four strategies for the preparation and imaging of sections in an electron microscope. The oldest approach involves the use of an aldehyde (typically glutaraldehyde) to crosslink cellular components, followed by treatment with osmium-containing reagents for further fixation and staining of certain components and embedment in a plastic resin that encases the fixed stained cells. The resin blocks are mounted in a microtome, and sections with thicknesses ranging from 20 nm to as much as 1 mm can be prepared and imaged by electron microscopy. A gentler approach to fixation requires high-pressure freezing76,77 followed by solvent exchange and staining when the sample is still frozen (freeze substitution). A third approach used for immunolabelling is to chemically fix the cells with glutaraldehyde followed by freezing and sectioning at −100 °C, and application of antibodies after the sections are picked up on the surface of an aqueous phase78. The strategy that leads to the highest level of preservation is that in which sections are prepared at temperatures below −150 °C from vitrified specimens (FIG. 4; TABLE 2).
In cryo-electron microscopic images, the contrast derives from intrinsic scattering of electrons, so that the information present in the image is not altered by either fixation or the use of heavy metal staining procedures that involve dehydration and usually result in selective staining of cellular components. Although there is a widely held view that this makes cryo-electron microscopy superior to room temperature electron microscopy, this is not always necessarily the case and depends on the type of question being addressed. Fixed stained specimens do not provide useful protein structural information at resolutions much better than ~ 100 Å. However, it is also the case that unless cryo-electron microscopy is performed using relatively low electron doses, beam damage can give rise to artefacts that are not readily apparent on qualitative inspection of individual tomograms. Beam damage is also an important factor for stained specimens, and there can also be significant mass loss during the course of collecting data from stained, plastic-embedded specimens.
There is little evidence that locations of key macromolecular complexes in the bacterial cytoplasm are significantly rearranged as a result of fixation and/or staining, and, in fact, comparative analysis with images from intact bacteria suggests that molecular structure at least of cytoplasmic filaments is generally maintained in high pressure frozen, freeze-substituted specimens79. In chemically fixed cells, damage to structure can arise from glutaraldehyde crosslinking, treatment with osmium and from the use of higher electron doses. In principle, all three factors can contribute to distortions, but a careful comparison of vitreous section imaging from fixed cells either with or without subsequent osmium treatment, establishes that the damage from fixation itself is minimal whereas osmium treatment can lead to alterations in ultrastructure73. Although these observations do not completely eliminate concerns arising from the effects of fixation itself, it is also true that many important advances have come with the imaging of plastic-embedded sections, in which sacrificing fine structure has resulted in other gains. Therefore, higher doses in combination with energy dispersive X-ray analysis were used to map the elemental composition of cellular compartments in anammox bacteria80 and to gain an understanding of the potential role of iron in energy generation. Tomography of plastic sections has also been useful in delineating 3D membrane connectivity in diverse instances81,82.
Molecular resolution by image averaging
Although a key focus of efforts to image whole cells and thin sections by electron tomography has been to describe subcellular architecture, information in the tomograms could potentially be used to derive molecular structures of cellular components. The structures of proteins and protein complexes have been determined exclusively under conditions in which the proteins have been purified away from their native context, and often truncated at various regions to facilitate structure determination by X-ray crystallography. This raises questions about the relevance of structures determined by X-ray crystallography and NMR spectroscopy that could be addressed if it were possible not just to locate these complexes in the cell, but to actually determine the 3D structure of proteins and complexes when they are still present in intact bacterial cells.
How feasible is this approach? One challenging aspect of the problem is that the signal-to-noise ratios in electron tomograms are generally far too low to reveal anything meaningful about the 3D structures of individual protein complexes. However, if the locations of specific protein complexes can be identified unambiguously, it should be possible to carry out 3D averaging of hundreds or thousands of individual subvolumes to improve the signal-to-noise ratios. The idea of using image-averaging approaches to derive 3D structures of complex macromolecular assemblies is of course not new, and has been a central idea in low-dose biological electron microscopy of purified protein complexes for over two decades6. At the heart of these methods is the assumption that the entities being averaged are chemically and structurally homogeneous at the resolution of interest. The same conceptual approach can also be applied to 3D shapes in reconstructed tomograms, but there are some additional challenges that need to be considered. In general, it is impossible to know a priori the extent of conformational heterogeneity of the various copies of the protein complex of interest present in the milieu of the cell. If the individual 3D images in the collection are generated from distinct 3D conformations, a further level of classification is required to identify and separately average the individual conformations. One further problem arises from the limited range of tilt inherent to electron tomography, which results in modification of the reconstructed shapes of individual complexes by the ‘missing wedge’83. The presence of the missing wedge effectively results in the differences in appearance of the same object depending on their relative orientation with respect to the beam. Significant advances have been made recently84,85 by devising rigorous computational methods to overcome these problems, therefore, paving the way forward for analysing molecular structures of macromolecular complexes in the cell.
FIG. 5 highlights examples in which the use of tomography combined with 3D image averaging has been used to derive structural information on specific protein assemblies. Oritz et al.86 reported a ribosomal structure derived from averaging ~ 236 individual ribosome subvolumes identified in tomograms of intact Spiroplasma melliferum cells, and suggested that the orientations of ribosomes in the cell could be identified. Murphy et al.38 averaged 20 individual subvolumes of the flagellar motor from cells of Treponema primitia to obtain a 3D structure of the arrangement of subunits in an intact cell. Whereas ribosomes and the flagellar motor are arguably unique, and unrepresentative of the average protein in a cell, three recent reports44,45,87 indicate the broader potential of these averaging approaches to analyse the structures of membrane protein assemblies (FIG. 5) in bacterial cells, at least in instances when they are clustered in the cell membrane. Analysis of the chemotaxis signalling complex in Caulobacter crescentus revealed the partially ordered, hexagonally packed arrangement of chemoreceptors near the pole of the cell, as well as the relative arrangement of receptors and associated signalling proteins45. Classification and averaging of individual subvolumes corresponding to individual chemoreceptors overproduced in E. coli has led to determination of the 3D structure of the intact chemoreceptor for serine (Tsr), and is also the first report of the 3D structure of a full-length chemoreceptor at any resolution. The advance represented by this work is that not only was it possible to determine the averaged 3D structure of the receptor in the membranes of the cell at resolutions of ~ 30 Å, but two discrete coexisting conformations of the receptor could be separated87. The functional relevance of these conformations was established by changing the relative proportions of the two conformations by adding ligands known to bind the receptor and influence receptor activation.
Figure 5 |. Molecular structures of bacterial components in situ determined by three-dimensional averaging of individual volumes extracted from whole cell tomograms.
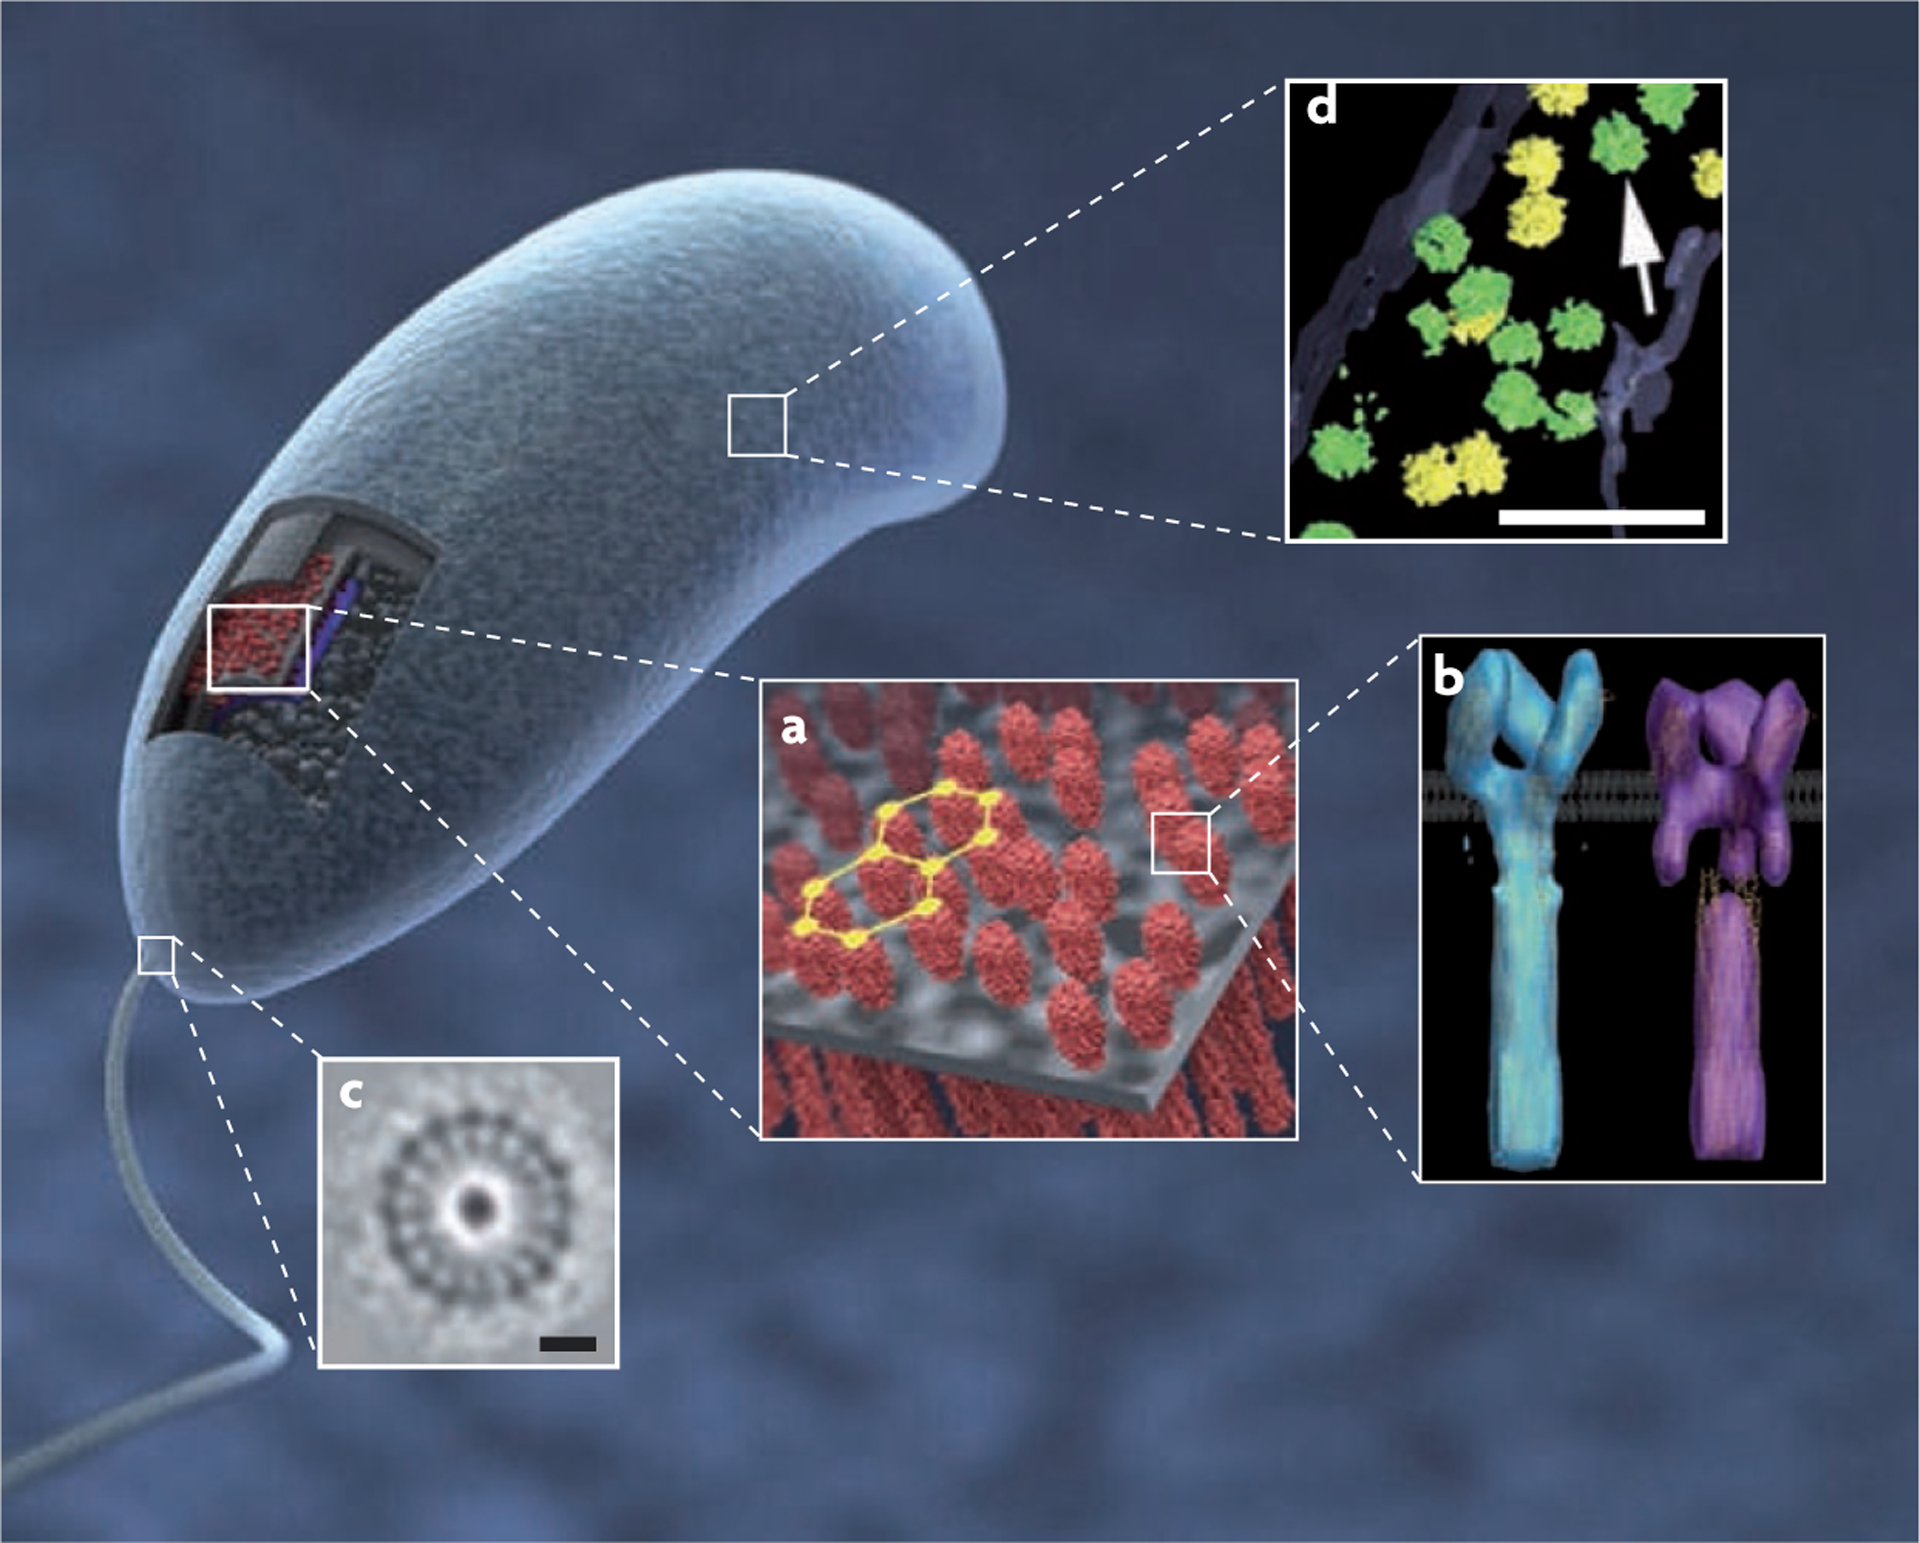
a | Visualization of the three-dimensional structure (3D) and partially ordered hexagonal arrangement of chemoreceptor arrays in Caulobacter crescentus cells. b | The two predominant receptor conformations of the Escherichia coli serine receptor Tsr derived by 3D averaging, corresponding to the ‘kinase-off’ and ‘kinase-on’ signalling states. c | The flagellar motor in cells of the Treponema primitia (scale bar 20 nm). d | Distribution and structure of ribosomes (indicated by the arrow) in Spiroplasma melliferum with green and yellow indicating higher or lower levels of accuracy of detection (scale bar 100 nm). Part a is reproduced, with permission, from REF. 45 © (2008) American Society for Microbiology. Part b is reproduced, with permission, from REF. 87 © (2008) National Academy of Sciences. Part c is reproduced, with permission, from Nature REF. 38 © (2006) Macmillan Publishers Ltd. All rights reserved. Part d is reproduced, with permission, from REF. 86 © (2006) Academic Press.
The demonstration that 3D structure and structural changes can be studied in the context of an intact cell heralds a new era in the use of electron tomography combined with 3D image averaging. There is reason to hope that this strategy can be applied to other membrane proteins, especially in the context of over-produced recombinant proteins as this could allow the protein of interest to be more easily distinguished and located in the cell. Further, the use of correlative microscopy and/or the use of genetically tagged proteins could be useful to identify regions of the cell where the protein of interest is present at high concentrations.
Concluding remarks
3D electron microscopy has come a long way in the past few years and is now increasingly perceived as a technology that can contribute significantly to study structural aspects of intact bacterial cells. The focus of this Review has been to explore the instances in which cryo-electron tomography of intact cells has been successful, and to provide a perspective on the origins of this success. Given fundamental technical limitations of electron tomography of whole cells, it is likely that for many years to come we will continue to learn about bacterial architecture of whole cells largely through tomographic analyses of the smaller bacteria with widths less than ~ 0.5 mm. Undoubtedly progress will also be made on understanding structural aspects of larger bacteria as procedures for the generation of vitreous sections become more streamlined. Tools for 3D protein localization using electron-dense tags may also revolutionize prospects of mapping protein localization at the nanoscale, but these methods are at an early stage of development. For thicker bacteria, the use of high pressure freezing followed by freeze substitution could be an excellent strategy to obtain 3D reconstructions of the interior of the cell by imaging plastic-embedded sections at room temperature. The use of imaging at high electron doses under non-cryogenic conditions may have an advantage as the use of stains with different chemical compositions could enable visualization of components that display little contrast difference in cryogenic conditions. Chemical imaging using electron microscopy, and also with powerful new optical technologies such as those based on Raman scattering microscopy88 have great promise as we extend the envelope of imaging from probing architecture to unravelling chemistry. It is safe to predict that the exponential growth of this field will continue unabated in the coming decade.
Supplementary Material
Acknowledgements
This work was supported by funds from the intramural research program of the National Cancer Institute, National Institues of Health (NIH), USA.
Footnotes
SUPPLEMENTARY INFORMATION
See online article: S1 (figure) | S2 (figure)
References
- 1.Goodsell DS Inside a living cell. Trends Biochem. Sci 16, 203–206 (1991). [DOI] [PubMed] [Google Scholar]
- 2.Lu i V, Leis A & Baumeister W. Cryo-electron tomography of cells: connecting structure and function. Histochem. Cell Biol 130, 185–196 (2008). [DOI] [PMC free article] [PubMed] [Google Scholar]
- 3.Morris DM & Jensen GJ Toward a biomechanical understanding of whole bacterial cells. Annu. Rev. Biochem 77, 583–613 (2008). [DOI] [PubMed] [Google Scholar]; Excellent review of state-of-the-art biophysical and 3D electron microscopic analyses of the bacterial cytoskeleton.
- 4.Subramaniam S Bridging the imaging gap: visualizing subcellular architecture with electron tomography. Curr. Opin. Microbiol 8, 316–322 (2005). [DOI] [PMC free article] [PubMed] [Google Scholar]
- 5.Egelman EH Single-particle reconstruction from EM images of helical filaments. Curr. Opin. Struct. Biol 17, 556–561 (2007). [DOI] [PMC free article] [PubMed] [Google Scholar]
- 6.Frank J Three-dimensional electron microscopy of macromolecular assemblies: visualization of biological molecules in their native state (Oxford University Press, 2006). [Google Scholar]
- 7.Orlova EV & Saibil HR Structure determination of macromolecular assemblies by single-particle analysis of cryo-electron micrographs. Curr. Opin. Struct. Biol 14, 584–590 (2004). [DOI] [PubMed] [Google Scholar]
- 8.Yonekura K, Maki-Yonekura S & Namba K Complete atomic model of the bacterial flagellar filament by electron cryomicroscopy. Nature 424, 643–650 (2003). [DOI] [PubMed] [Google Scholar]; Example demonstrating the power of combining medium resolution structural information from cryo-electron microscopy with atomic models derived by X-ray crystallography.
- 9.Zhou ZH Towards atomic resolution structural determination by single-particle cryo-electron microscopy. Curr. Opin. Struct. Biol 18, 218–228 (2008). [DOI] [PMC free article] [PubMed] [Google Scholar]
- 10.Bellare JR, Davis HT, Scriven LE & Talmon Y Controlled environment vitrification system: an improved sample preparation technique. J. Electron. Microsc. Tech 10, 87–111 (1988). [DOI] [PubMed] [Google Scholar]
- 11.Frederik PM & Hubert DHW Cryoelectron microscopy of liposomes. Meth. Enzymol 391, 431–448 (2005). [DOI] [PubMed] [Google Scholar]
- 12.Dubochet J et al. Cryo-electron microscopy of vitrified specimens. Q. Rev. Biophys 21, 129–228 (1988). [DOI] [PubMed] [Google Scholar]; The classic original reference to the method of preparing biological specimens for cryo-electron microscopy and tomography.
- 13.Iancu CV, Wright ER, Heymann JB & Jensen GJ A comparison of liquid nitrogen and liquid helium as cryogens for electron cryotomography. J. Struct. Biol 153, 231–240 (2006). [DOI] [PubMed] [Google Scholar]
- 14.McIntosh JR Cellular electron microscopy (ed. McIntosh JR) (Academic, San Diego, 2007). [Google Scholar]
- 15.Mastronarde DN Correction for nonperpendicularity of beam and tilt axis in tomographic reconstructions with the IMOD package. J. Microsc 230, 212–217 (2008). [DOI] [PubMed] [Google Scholar]
- 16.Boudier T et al. A public software for energy filtering transmission electron tomography (EFTET-J.): application to the study of granular inclusions in bacteria from Riftia pachyptila. J. Struct. Biol 151, 151–159 (2005). [DOI] [PubMed] [Google Scholar]
- 17.Messaoudii C, Boudier T, Sanchez Sorzano CO & Marco S TomoJ: tomography software for three-dimensional reconstruction in transmission electron microscopy. BMC Bioinformatics 8, 288 (2007). [DOI] [PMC free article] [PubMed] [Google Scholar]
- 18.Frangakis AS & Hegerl R Noise reduction in electron tomographic reconstructions using nonlinear anisotropic diffusion. J. Struct. Biol 135, 239–250 (2001). [DOI] [PubMed] [Google Scholar]
- 19.Narasimha R et al. Evaluation of denoising algorithms for biological electron tomography. J. Struct. Biol 164, 7–17 (2008). [DOI] [PMC free article] [PubMed] [Google Scholar]
- 20.Borgnia MJ, Subramaniam S & Milne JLS Three-dimensional imaging of the highly bent architecture of Bdellovibrio bacteriovorus by using cryo-electron tomography. J. Bacteriol 190, 2588–2596 (2008). [DOI] [PMC free article] [PubMed] [Google Scholar]
- 21.Briegel A et al. Multiple large filament bundles observed in Caulobacter crescentus by electron cryotomography. Mol. Microbiol 62, 5–14 (2006). [DOI] [PubMed] [Google Scholar]
- 22.Charon NW et al. The flat ribbon configuration of the periplasmic flagella of Borrelia burgdorferi and its relationship to motility and morphology. J. Bacteriol 191, 600–607 (2009). [DOI] [PMC free article] [PubMed] [Google Scholar]
- 23.Comolli LR, Baker BJ, Downing KH, Siegerist CE & Banfield JF Three-dimensional analysis of the structure and ecology of a novel, ultra-small archaeon. ISME J 3, 159–167 (2009). [DOI] [PubMed] [Google Scholar]
- 24.Grimm R et al. Electron. tomography of ice-embedded prokaryotic cells. Biophys. J 74, 1031–1042 (1998). [DOI] [PMC free article] [PubMed] [Google Scholar]
- 25.Henderson GP & Jensen GJ Three-dimensional structure of Mycoplasma pneumoniae’s attachment organelle and a model for its role in gliding motility. Mol. Microbiol 60, 376–385 (2006). [DOI] [PubMed] [Google Scholar]
- 26.Hoffmann C, Leis A, Niederweis M, Plitzko JM & Engelhardt H Disclosure of the mycobacterial outer membrane: cryo-electron tomography and vitreous sections reveal the lipid bilayer structure. Proc. Natl Acad. Sci. USA 105, 3963–3967 (2008). [DOI] [PMC free article] [PubMed] [Google Scholar]
- 27.Izard J, Hsieh C-E, Limberger RJ, Mannella CA & Marko M Native cellular architecture of Treponema denticola revealed by cryo-electron tomography. J. Struct. Biol 163, 10–17 (2008). [DOI] [PMC free article] [PubMed] [Google Scholar]
- 28.Murphy GE, Matson EG, Leadbetter JR, Berg HC & Jensen GJ Novel ultrastructures of Treponema primitia and their implications for motility. Mol. Microbiol 67, 1184–1195 (2008). [DOI] [PMC free article] [PubMed] [Google Scholar]
- 29.Junglas B et al. Ignicoccus hospitalis and Nanoarchaeum equitans: ultrastructure, cell–cell interaction, and 3D reconstruction from serial sections of freeze-substituted cells and by electron cryotomography. Arch. Microbiol 190, 395–408 (2008). [DOI] [PMC free article] [PubMed] [Google Scholar]
- 30.Komeili A, Li Z, Newman DK & Jensen GJ Magnetosomes are cell membrane invaginations organized by the actin-like protein MamK. Science 311, 242–245 (2006). [DOI] [PubMed] [Google Scholar]
- 31.Konorty M, Kahana N, Linaroudis A, Minsky A & Medalia O Structural analysis of photosynthetic membranes by cryo-electron tomography of intact Rhodopseudomonas viridis cells. J. Struct. Biol 161, 393–400 (2008). [DOI] [PubMed] [Google Scholar]
- 32.Liu J, McBride MJ & Subramaniam S Cell surface filaments of the gliding bacterium Flavobacterium johnsoniae revealed by cryo-electron tomography. J. Bacteriol 189, 7503–7506 (2007). [DOI] [PMC free article] [PubMed] [Google Scholar]
- 33.Nickell S, Hegerl R, Baumeister W & Rachel R Pyrodictium cannulae enter the periplasmic space but do not enter the cytoplasm, as revealed by cryo-electron tomography. J. Struct. Biol 141, 34–42 (2003). [DOI] [PubMed] [Google Scholar]
- 34.Ting CS, Hsieh C-E, Sundararaman S, Mannella C & Marko M Cryo-electron tomography reveals the comparative three-dimensional architecture of Prochlorococcus, a globally important marine cyanobacterium. J. Bacteriol 189, 4485–4493 (2007). [DOI] [PMC free article] [PubMed] [Google Scholar]
- 35.Zhang P, Khursigara CM, Hartnell LM & Subramaniam S Direct visualization of Escherichia coli chemotaxis receptor arrays using cryo-electron microscopy. Proc. Natl Acad. Sci. USA 104, 3777–3781 (2007). [DOI] [PMC free article] [PubMed] [Google Scholar]
- 36.Matias VRF & Beveridge TJ Cryo-electron microscopy reveals native polymeric cell wall structure in Bacillus subtilis 168 and the existence of a periplasmic space. Mol. Microbiol 56, 240–251 (2005). [DOI] [PubMed] [Google Scholar]; First report to present direct evidence from thin vitreous section experiments supporting the presence of a periplasmic region in Gram-positive bacteria.
- 37.Kürner Frangakis & Baumeister, W. Cryo-electron tomography reveals the cytoskeletal structure of Spiroplasma melliferum. Science 307, 436–438 (2005). [DOI] [PubMed] [Google Scholar]
- 38.Murphy GE, Leadbetter JR & Jensen GJ In situ structure of the complete Treponema primitia flagellar motor. Nature 442, 1062–1064 (2006). [DOI] [PubMed] [Google Scholar]
- 39.Baumeister W, Grimm R & Walz J Electron tomography of molecules and cells. Trends Cell Biol 9, 81–85 (1999). [DOI] [PubMed] [Google Scholar]
- 40.Brandt F et al. The native 3D organization of bacterial polysomes. Cell 136, 261–271 (2009). [DOI] [PubMed] [Google Scholar]
- 41.Seybert A, Herrmann R & Frangakis AS Structural analysis of Mycoplasma pneumoniae by cryo-electron tomography. J. Struct. Biol 156, 342–354 (2006). [DOI] [PubMed] [Google Scholar]
- 42.Li Z, Trimble MJ, Brun YV & Jensen GJ The structure of FtsZ filaments in vivo suggests a force-generating role in cell division. EMBO J 26, 4694–4708 (2007). [DOI] [PMC free article] [PubMed] [Google Scholar]
- 43.Scheffel A et al. An acidic protein aligns magnetosomes along a filamentous structure in magnetotactic bacteria. Nature 440, 110–114 (2006). [DOI] [PubMed] [Google Scholar]
- 44.Briegel A et al. Location and architecture of the Caulobacter crescentus chemoreceptor array. Mol. Microbiol 69, 30–41 (2008). [DOI] [PMC free article] [PubMed] [Google Scholar]
- 45.Khursigara CM, Wu X & Subramaniam S Chemoreceptors in Caulobacter crescentus: trimers of receptor dimers in a partially ordered hexagonally packed array. J. Bacteriol 190, 6805–6810 (2008). [DOI] [PMC free article] [PubMed] [Google Scholar]
- 46.Comolli LR, Kundmann M & Downing KH Characterization of intact subcellular bodies in whole bacteria by cryo-electron tomography and spectroscopic imaging. J. Microsc 223, 40–52 (2006). [DOI] [PubMed] [Google Scholar]
- 47.Glaeser RM Limitations to significant information in biological electron microscopy as a result of radiation damage. J. Ultrastruct. Res 36, 466–482 (1971). [DOI] [PubMed] [Google Scholar]
- 48.Best C, Nickell S & Baumeister W Localization of protein complexes by pattern recognition. Methods Cell Biol 79, 615–638 (2007). [DOI] [PubMed] [Google Scholar]
- 49.Bohm J et al. Toward detecting and identifying macromolecules in a cellular context: template matching applied to electron tomograms. Proc. Natl Acad. Sci. USA 97, 14245–14250 (2000). [DOI] [PMC free article] [PubMed] [Google Scholar]
- 50.Diestra E, Fontana J, Guichard P, Marco S & Risco C Visualization of proteins in intact cells with a clonable tag for electron microscopy. J. Struct. Biol 165, 157–168 (2009). [DOI] [PubMed] [Google Scholar]
- 51.Mercogliano CP & DeRosier DJ Concatenated metallothionein as a clonable gold label for electron microscopy. J. Struct. Biol 160, 70–82 (2007). [DOI] [PMC free article] [PubMed] [Google Scholar]
- 52.Leapman RD Novel techniques in electron microscopy. Curr. Opin. Neurobiol 14, 591–598 (2004). [DOI] [PubMed] [Google Scholar]; Review highlighting strategies in high-dose, non-cryo-electron microscopy relevant to new methods such as elemental mapping.
- 53.Sousa AA et al. On the feasibility of visualizing ultrasmall gold labels in biological specimens by STEM tomography. J. Struct. Biol 159, 507–522 (2007). [DOI] [PMC free article] [PubMed] [Google Scholar]
- 54.Gaietta GM et al. Golgi twins in late mitosis revealed by genetically encoded tags for live cell imaging and correlated electron microscopy. Proc. Natl Acad. Sci. USA 103, 17777–17782 (2006). [DOI] [PMC free article] [PubMed] [Google Scholar]
- 55.Sartori A et al. Correlative microscopy: bridging the gap between fluorescence light microscopy and cryo-electron tomography. J. Struct. Biol 160, 135–145 (2007). [DOI] [PubMed] [Google Scholar]
- 56.Schwartz CL, Sarbash VI, Ataullakhanov FI, McIntosh JR & Nicastro D Cryo-fluorescence microscopy facilitates correlations between light and cryo-electron microscopy and reduces the rate of photobleaching. J. Microsc 227, 98–109 (2007). [DOI] [PubMed] [Google Scholar]
- 57.Parkinson DY, McDermott G, Etkin LD, Le Gros MA & Larabell CA Quantitative 3-D imaging of eukaryotic cells using soft X-ray tomography. J. Struct. Biol 162, 380–386 (2008). [DOI] [PMC free article] [PubMed] [Google Scholar]
- 58.Bonfigli F et al. High-resolution water window X-ray imaging of in vivo cells and their products using LiF crystal detectors. Microsc. Res. Tech 71, 35–41 (2008). [DOI] [PubMed] [Google Scholar]
- 59.Adam J-F, Moy J-P & Susini J Table-top water window transmission x-ray microscopy: Review of the key issues, and conceptual design of an instrument for biology. Rev. Sci. Instrum 76, 091301 (2005). [Google Scholar]
- 60.Miao J et al. Imaging whole Escherichia coli bacteria by using single-particle x-ray diffraction. Proc. Natl Acad. Sci. USA 100, 110–112 (2003). [DOI] [PMC free article] [PubMed] [Google Scholar]
- 61.Sandberg RL et al. High numerical aperture tabletop soft x-ray diffraction microscopy with 70-nm resolution. Proc. Natl Acad. Sci. USA 105, 24–27 (2008). [DOI] [PMC free article] [PubMed] [Google Scholar]
- 62.Ashcroft JM et al. TiO2 nanoparticles as a soft X-ray molecular probe. Chem. Commun. (Camb.), 2471–2473 (2008). [DOI] [PMC free article] [PubMed] [Google Scholar]
- 63.Grimm R, Typke D, Bärmann M & Baumeister W Determination of the inelastic mean free path in ice by examination of tilted vesicles and automated most probable loss imaging. Ultramicroscopy 63, 169–179 (1996). [DOI] [PubMed] [Google Scholar]
- 64.Heymann JAW et al. 3D Imaging of mammalian cells with ion-abrasion scanning electron microscopy. J. Struct. Biol 166, 1–7 (2008). [DOI] [PMC free article] [PubMed] [Google Scholar]; First demonstration that ion-abrasion electron microscopy can be used to obtain 3D images of eukaryotic cells and tissues at nanoscale resolution.
- 65.Heymann JAW et al. Site-specific 3D imaging of cells and tissues with a dual beam microscope. J. Struct. Biol 155, 63–73 (2006). [DOI] [PMC free article] [PubMed] [Google Scholar]
- 66.Marko M, Hsieh C, Schalek R, Frank J & Mannella C Focused-ion-beam thinning of frozen-hydrated biological specimens for cryo-electron microscopy. Nature Methods 4, 215–217 (2007). [DOI] [PubMed] [Google Scholar]
- 67.Matias VR & Beveridge TJ Native cell wall organization shown by cryo-electron microscopy confirms the existence of a periplasmic space in Staphylococcus aureus. J. Bacteriol 188, 1011–1021 (2006). [DOI] [PMC free article] [PubMed] [Google Scholar]
- 68.Zuber B et al. Granular layer in the periplasmic space of gram-positive bacteria and fine structures of Enterococcus gallinarum and Streptococcus gordonii septa revealed by cryo-electron microscopy of vitreous sections. J. Bacteriol 188, 6652–6660 (2006). [DOI] [PMC free article] [PubMed] [Google Scholar]
- 69.Matias VRF, Al-Amoudi A, Dubochet J & Beveridge TJ Cryo-transmission electron microscopy of frozen-hydrated sections of Escherichia coli and Pseudomonas aeruginosa. J. Bacteriol 185, 6112–6118 (2003). [DOI] [PMC free article] [PubMed] [Google Scholar]
- 70.Matias VRF & Beveridge TJ Cryo-electron microscopy of cell division in Staphylococcus aureus reveals a mid-zone between nascent cross walls. Mol. Microbiol 64, 195–206 (2007). [DOI] [PubMed] [Google Scholar]
- 71.Matias VRF & Beveridge TJ Lipoteichoic acid is a major component of the Bacillus subtilis periplasm. J. Bacteriol 190, 7414–7418 (2008). [DOI] [PMC free article] [PubMed] [Google Scholar]
- 72.Zhang P et al. Direct visualization of receptor arrays in frozen-hydrated sections and plunge-frozen specimens of E. coli engineered to overproduce the chemotaxis receptor Tsr. J. Microsc 216, 76–83 (2004). [DOI] [PubMed] [Google Scholar]
- 73.Zuber B et al. Direct visualization of the outer membrane of mycobacteria and corynebacteria in their native state. J. Bacteriol 190, 5672–5680 (2008). [DOI] [PMC free article] [PubMed] [Google Scholar]
- 74.Eltsov M & Dubochet J Fine structure of the Deinococcus radiodurans nucleoid revealed by cryoelectron microscopy of vitreous sections. J. Bacteriol 187, 8047–8054 (2005). [DOI] [PMC free article] [PubMed] [Google Scholar]
- 75.Salje J, Zuber B & Löwe J Electron. Cryomicroscopy of E. coli reveals filament bundles involved in plasmid DNA segregation. Science 323, 509–512 (2008). [DOI] [PubMed] [Google Scholar]
- 76.Sartori N, Richter K & Dubochet J Vitrification depth can be increased more than 10-fold by high pressure freezing. J. Microsc 172, 55–61 (1993). [Google Scholar]; First detailed report of the value and application of high-pressure freezing for preservation of the ultrastucture of thick biological specimens.
- 77.Studer D, Graber W, Al-Amoudi A & Eggli P A new approach for cryofixation by high-pressure freezing. J. Microsc 203, 285–294 (2001). [DOI] [PubMed] [Google Scholar]
- 78.Peters PJ & Hunziker W Subcellular localization of Rab17 by cryo-immunogold electron microscopy in epithelial cells grown on polycarbonate filters. Methods Enzymol 329, 210–225 (2001). [DOI] [PubMed] [Google Scholar]
- 79.Trachtenberg S et al. Structure of the cytoskeleton of Spiroplasma melliferum BC3 and its interactions with the cell membrane. J. Mol. Biol 378, 778–789 (2008). [DOI] [PubMed] [Google Scholar]
- 80.van Niftrik L et al. Combined structural and chemical analysis of the anammoxosome: a membrane-bounded intracytoplasmic compartment in anammox bacteria. J. Struct. Biol 161, 401–410 (2008). [DOI] [PubMed] [Google Scholar]
- 81.Lefman J et al. Three-dimensional electron microscopic imaging of membrane invaginations in Escherichia coli overproducing the chemotaxis receptor Tsr. J. Bacteriol 186, 5052–5061 (2004). [DOI] [PMC free article] [PubMed] [Google Scholar]
- 82.van de Meene AML, Hohmann-Marriott MF, Vermaas WFJ & Roberson RW The three-dimensional structure of the cyanobacterium Synechocystis sp. PCC 6803. Arch. Microbiol 184, 259–270 (2006). [DOI] [PubMed] [Google Scholar]
- 83.Subramaniam S, Bartesaghi A, Liu J, Bennett AE & Sougrat R Electron. tomography of viruses. Curr. Opin. Struct. Biol 17, 596–602 (2007). [DOI] [PMC free article] [PubMed] [Google Scholar]
- 84.Bartesaghi A et al. Classification and 3D averaging with missing wedge correction in biological electron tomography. J. Struct. Biol 162, 436–450 (2008). [DOI] [PMC free article] [PubMed] [Google Scholar]; Comprehensive technical paper describing a mathematical and computational strategy to determine 3D structures of macromolecular complexes by averaging individual tomographic subvolumes.
- 85.Förster F, Pruggnaller S, Seybert A & Frangakis AS Classification of cryo-electron sub-tomograms using constrained correlation. J. Struct. Biol 161, 276–286 (2008). [DOI] [PubMed] [Google Scholar]
- 86.Ortiz JO, Förster F, Kürner J, Linaroudis AA & Baumeister W Mapping 70S ribosomes in intact cells by cryoelectron tomography and pattern recognition. J. Struct. Biol 156, 334–341 (2006). [DOI] [PubMed] [Google Scholar]
- 87.Khursigara CM, Wu X, Zhang P, Lefman J & Subramaniam S Role of HAMP domains in chemotaxis signaling by bacterial chemoreceptors. Proc. Natl Acad. Sci. USA 105, 16555–16560 (2008). [DOI] [PMC free article] [PubMed] [Google Scholar]
- 88.Freudiger CW et al. Label-free biomedical imaging with high sensitivity by stimulated Raman scattering microscopy. Science 322, 1857–1861 (2008). [DOI] [PMC free article] [PubMed] [Google Scholar]; Practical demonstration of a new approach for imaging the chemical composition of cells.
- 89.Al-Amoudi A et al. Cryo-electron microscopy of vitreous sections. EMBO J 23, 3583–3588 (2004). [DOI] [PMC free article] [PubMed] [Google Scholar]
- 90.Lieber A, Leis A, Kushmaro A, Minsky A & Medalia O Chromatin organization and radio-resistance in the bacterium Gemmata obscuriglobus. J. Bacteriol 191, 1439–1445 (2009). [DOI] [PMC free article] [PubMed] [Google Scholar]
- 91.Eltsov M & Zuber B Transmission electron microscopy of the bacterial nucleoid. J. Struct. Biol 156, 246–254 (2006). [DOI] [PubMed] [Google Scholar]
Associated Data
This section collects any data citations, data availability statements, or supplementary materials included in this article.