

Abstract
The rediscovery of remnant Florida panthers (Puma concolor coryi) in southern Florida swamplands prompted a program to protect and stabilize the population. In 1995, conservation managers translocated eight female pumas (P. c. stanleyana) from Texas to increase depleted genetic diversity, improve population numbers, and reverse indications of inbreeding depression. We have assessed the demographic, population-genetic, and biomedical consequences of this restoration experiment and show that panther numbers increased threefold, genetic heterozygosity doubled, survival and fitness measures improved, and inbreeding correlates declined significantly. Although these results are encouraging, continued habitat loss, persistent inbreeding, infectious agents, and possible habitat saturation pose new dilemmas. This intensive management program illustrates the challenges of maintaining populations of large predators worldwide.
Pumas (also called cougars, mountain lions, or panthers) are currently distributed throughout western North America and much of Central and South America (1). The endangered Florida panther (listed in 1967, table S1), the last surviving puma subspecies in eastern North America, is restricted to shrinking habitat between the urban centers of Miami and Naples (Fig. 1). By the early 1990s, the population of ~20 to 25 adults (2) showed reduced levels of molecular genetic variation relative to other puma populations (3–5), which is indicative of inbreeding (4, 6). This may have led to defects, including poor sperm quality and low testosterone levels (4, 7), poor fecundity and recruitment (4, 7), cryptorchidism [where >80% of males born from 1990 to 1992 had one or no descended testes (4)], a high incidence of thoracic cowlicks and kinked tails (4), numerous atrial septal defects (4, 8), and a high load of parasites and infectious disease pathogens (4, 8–10).
Fig. 1.
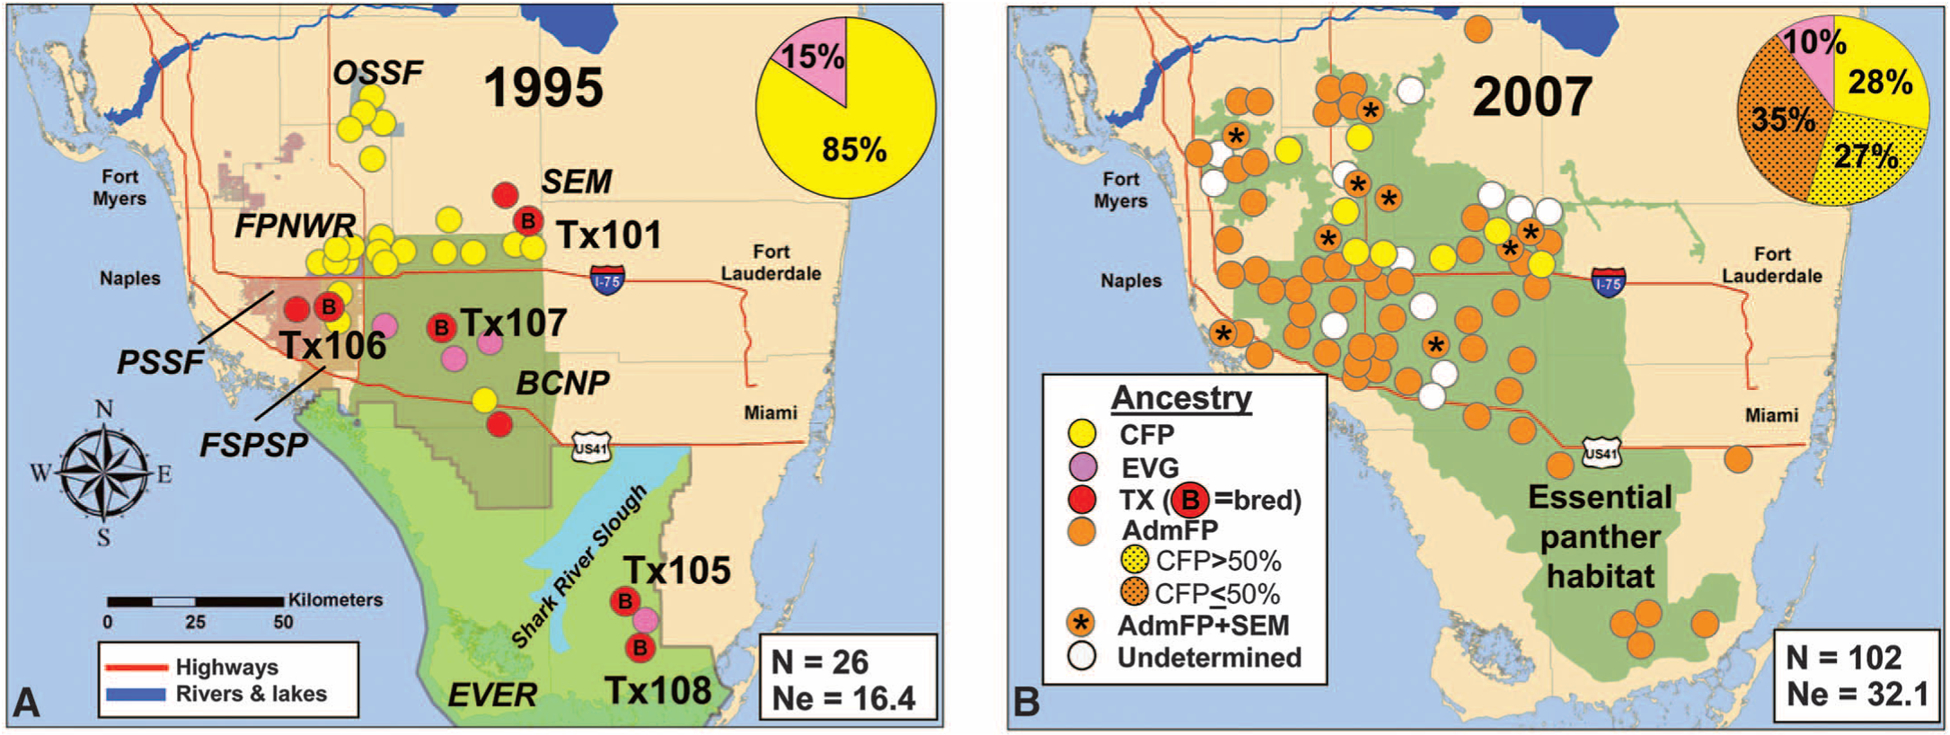
(A and B) Southern Florida (1995, left; 2007, right) with locations of breeding-age Florida panthers (>1.5 years old), geographic features, number (N) alive, and effective population size (Ne). Labeled colored areas in (A) demarcate public land (23): Fakahatchee Strand Preserve State Park (FSPSP), Picayune Strand State Forest (PSSF), Florida Panther National Wildlife Refuge (FPNWR), BCNP, Big Cypress Seminole Indian Reservation (SEM), Okaloacoochee Slough State Forest (OSSF), and Everglades National Park (EVER) and in (B) show panther habitat. Circles are coded by ancestry: CFP, TX females (with a B if a successful breeder), EVG, AdmFP, and SEM. Pie charts illustrate the genetic heritage of the population (fig. S1 and table S2) (13).
In 1995, these cumulative observations, coupled with demographic models predicting a 95% likelihood of extinction within two decades, motivated the translocation of 8 wild-caught Texas (TX) female pumas into habitat occupied by at least 22 adult canonical (last-remaining, authentic) Florida panthers (CFPs) and 4 Everglades Florida panthers (EVGs) (Fig. 1A), because historically, gene flow occurred between Texas and Florida puma populations (11, 12).
We compared data from 591 individuals sampled from 1978 to 2009 (table S2). Twenty-three informative (minimum allele frequency > 0.1) short tandem repeat (STR) loci were examined to reconstruct genetic heritage and parentage relationships; assess spatial and demographic patterns; distinguish CFP from other puma lineages; track morphological, biomedical, and life history traits as indices of fitness; and associate genetic heritage and heterozygosity with panther survival (13).
Pumas of diverse ancestry, time periods, and geographic origins, including wild-caught and captive animals in Florida, clustered into phylogenetic groups (Fig. 2). This analysis, combined with Bayesian population genetic results from STR genotypes that revealed nine distinct groups (fig. S1 and table S2), allowed us to explicitly infer the genetic heritage of each Florida panther (table S2, column 2; Figs. 1 and 2; and fig. S2) and to distinguish the two pre-1995 groups (CFP and EVG). Further, admixed Florida panthers (AdmFPs) were clearly identifiable, including first-generation (F1) offspring of TX females bred by CFP or EVG males (CFPxTX-F1 or EVGxTX-F1) and panthers that were related to captive pumas of western U.S. origin who had escaped from enclosures on the Big Cypress Seminole Indian Reservation (SEM) from 1997 to 1999 (Figs. 1 and 2).
Fig. 2.
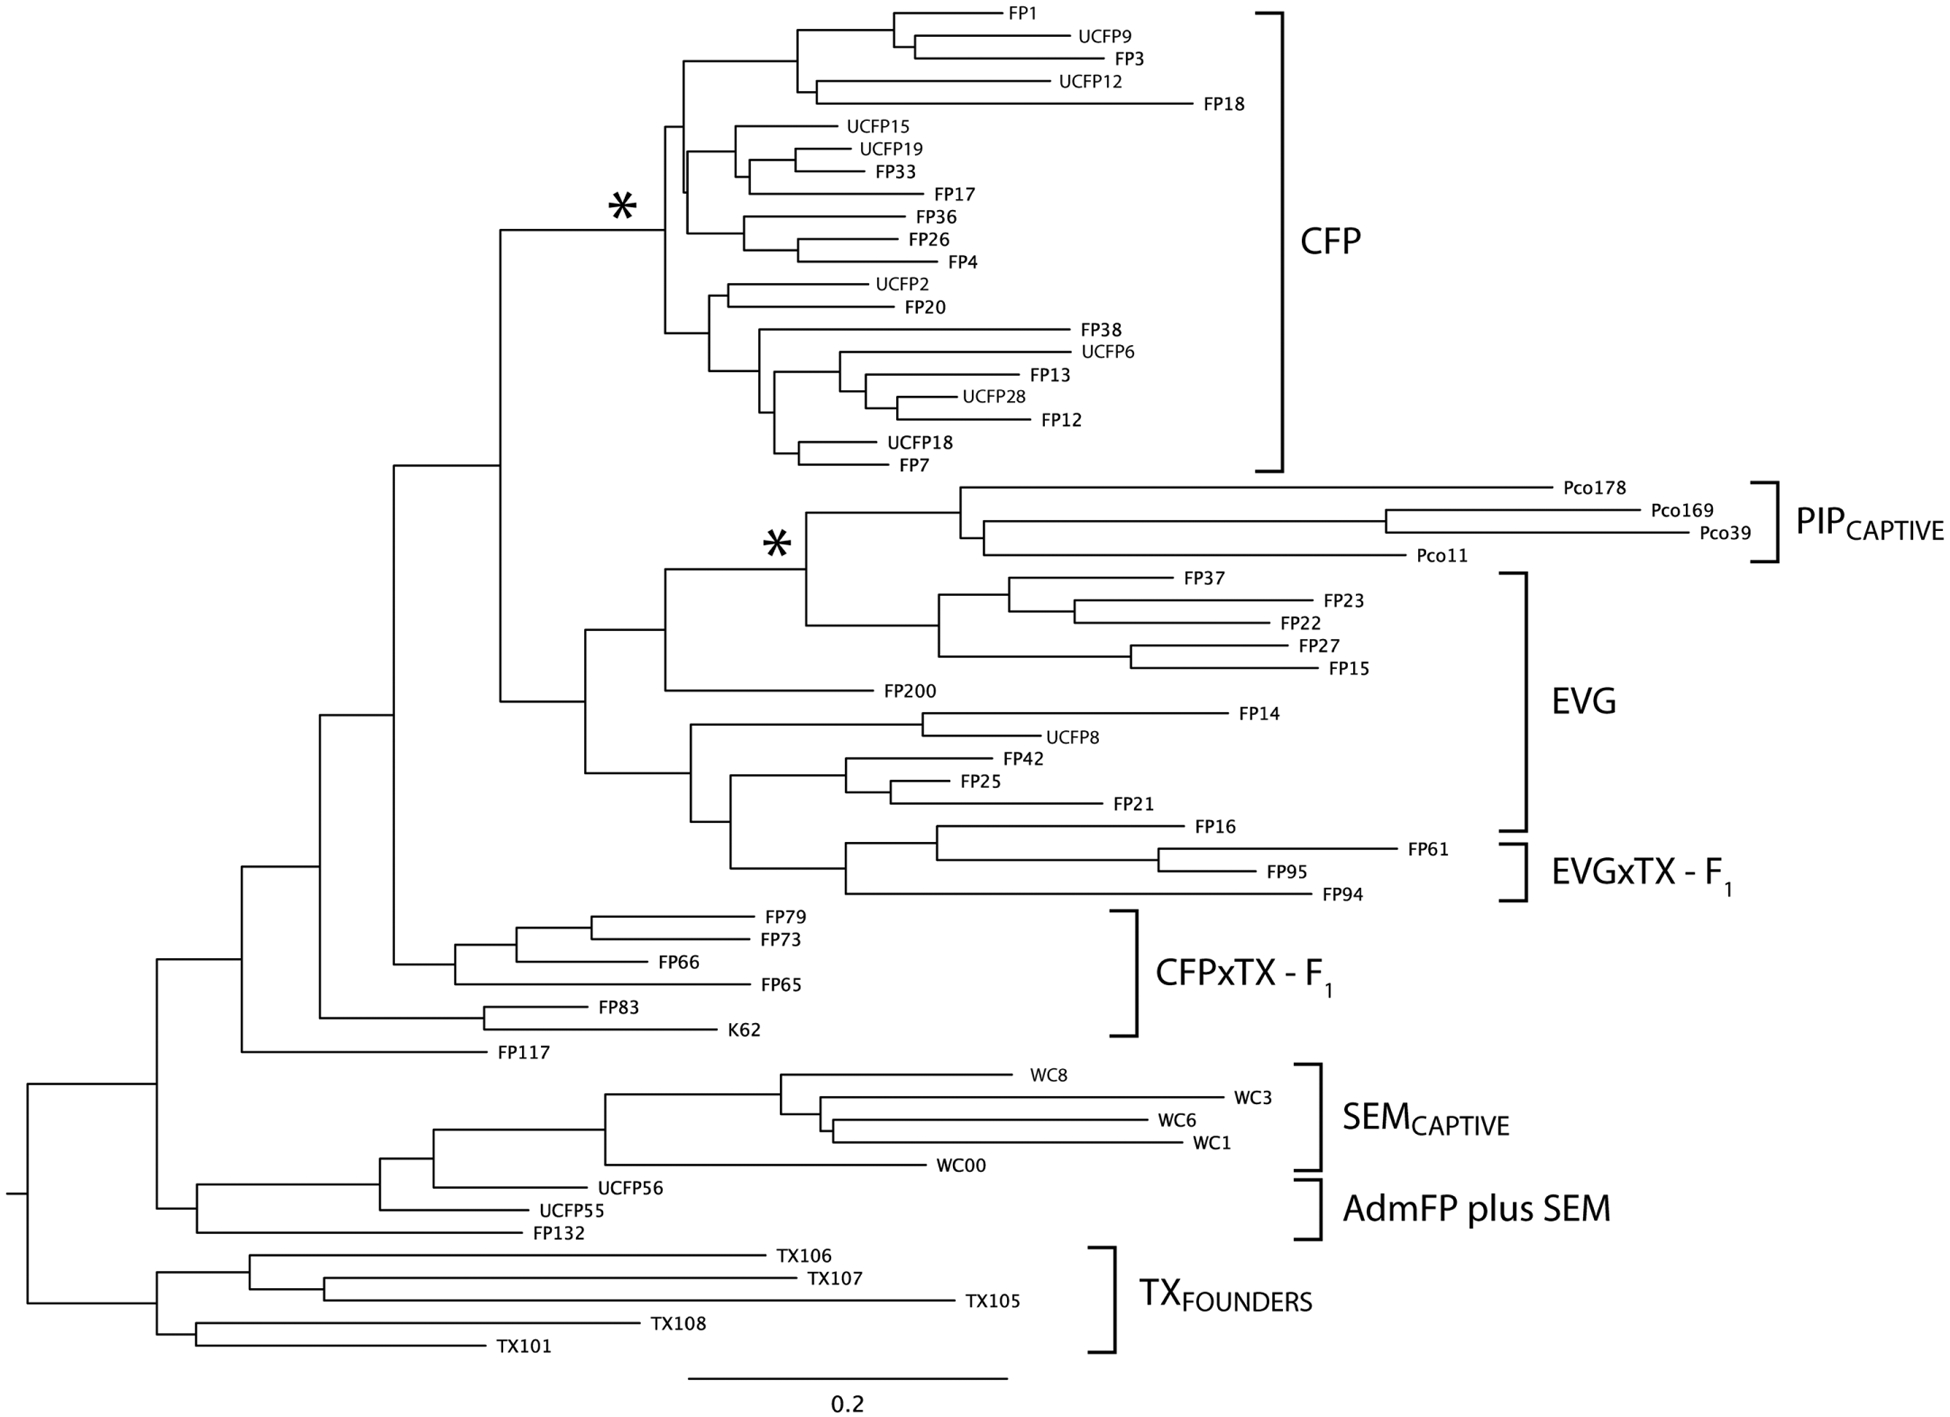
Neighbor-joining tree of composite STR genotypes portraying genetic relationships among pre-1995 founding CFPs, introduced TX females, EVG and F1 admixed Florida panthers (CFPxTX-F1 and EVGxTX-F1). Captive Piper panthers (PIPcaptive) are related to present-day EVGs through individuals released into the Everglades between 1957 and 1967 (3, 4), and SEMs contributed unintended gene flow. Asterisks mark nodes with >80% bootstrap support (13).
From 1986 to 1995, the minimum number of adult (>1.5 years old) panthers fluctuated from 24 to 32 (Fig. 3A), and genetic heritage remained relatively stable (85% CFP and 15% EVG; Fig. 1 and figs. S1 and S3). After their introduction, five of eight TX females bred (Fig. 1a) and produced 15 F1 kittens with CFP, EVG, and at least five TX-backcross (TX-BC) offspring (figs. S3 and S4 and table S2). Twelve F1 panthers produced offspring. From 1995 to 2008, 424 panther births were documented (81 CFP, 319 AdmFP, and 24 undetermined; 272 were observed only as neonatal kittens). These largely AdmFP were responsible for colonizing former panther range and densities increased. For example, between 1995 and 2007, the number and density of panthers in the southern Big Cypress National Preserve (BCNP) (2174 km2) increased eightfold from 3 (0.14/100 km2) to 25 (1.15/100 km2) (Fig. 1).
Fig. 3.
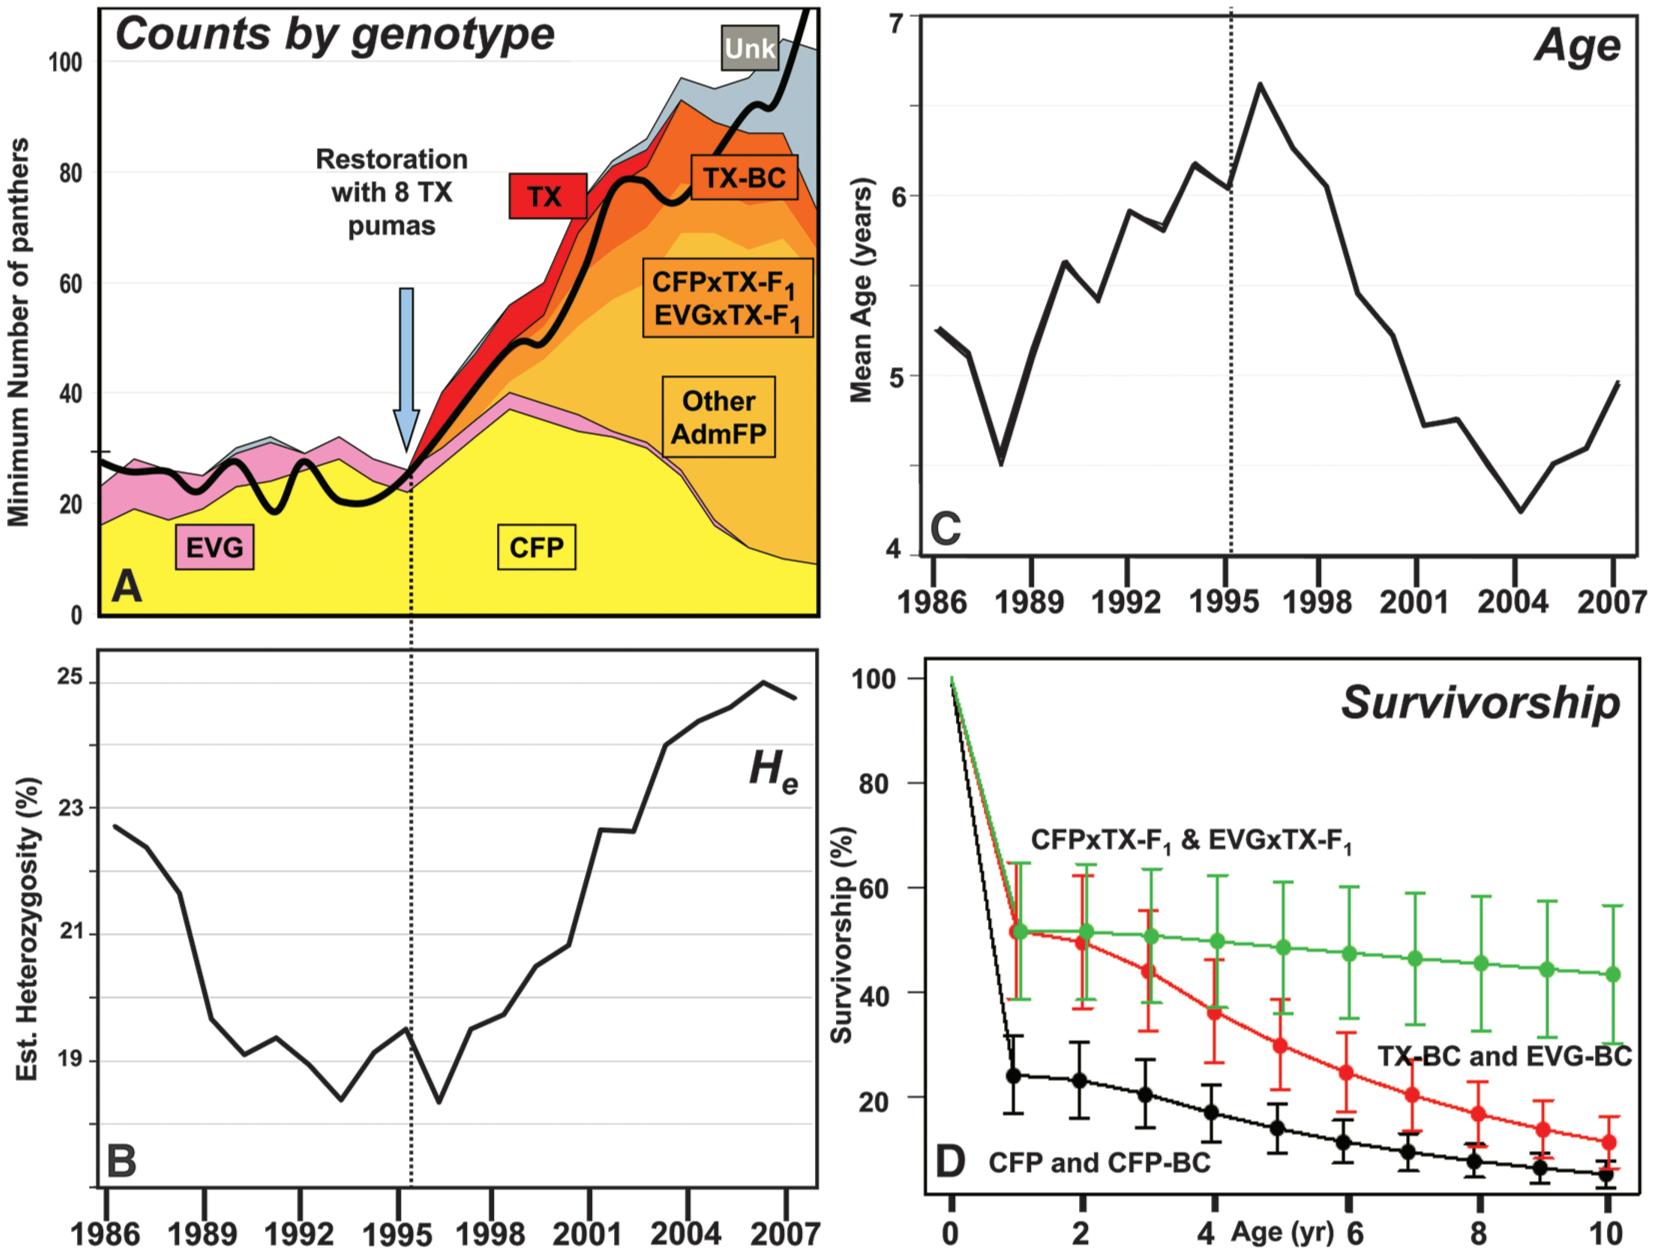
(A) Minimum annual subadult and adult panther population size and inferred genetic heritage from 1986 to 2007. CFPs are yellow, EVGs pink, TXs red, CFPxTX-F1s and EVGxTX-F1S orange, TX-BCs and other AdmFPs shades of orange, and genetically uncharacterized individuals (Unk) gray (13). The black line is an independent minimum-count estimate from surveys of tracks, spoor, and other field evidence (2). (B)Mean yearly adult multilocus heterozygosity. (C) Yearly mean age of adults. (D) Projected survivorship (probability of surviving to an age) curves for female Florida panthers of different genetic heritages with standard error bars (13). Male trends are similar (table S4).
From 1996 to 2003, numbers (N) increased by 14%/year to at least 95 adults (Fig. 3A), 26.6 kittens were produced annually (fig. S2). The effective population size (Ne) rose from 16.4 in 1995 to 32.1 by 2007, and Ne/N was 0.314 (Fig. 1) (13). This paralleled an increase in average individual STR heterozygosity (to 25% from 18.4% in 1993; Fig. 3B) and a decrease in the average estimated age of adults from 6.6 to 4.2 years from 1997 to 2004. Population growth slowed and average age increased gradually after 2004 (Fig. 3C).
Admixed genetic ancestry was associated with increased survival of F1, EVG-BC, and TX-BC kittens (<1 year old) relative to purebred CFP and CFP-backcross (CFP-BC) kittens (0.518 ± 0.130 versus 0.243 ± 0.074, P = 0.020) (Fig. 3D). F1 adults had significantly higher survival (P = 0.002) than other admixed or CFP groups (table S4), with a risk ratio (RR: relative instantaneous probability of mortality) of 0.118 (13). The survival of subadults and adults increased significantly with heterozygosity (RR for an increase of 0.1 = 0.643, P = 0.011). Interestingly, CFPs also experienced significantly higher mortality rates from intraspecific aggression than did AdmFPs (RR = 3.077, P = 0.014), and mortality rates from intraspecific aggression declined as heterozygosity increased (RR = 0.480, P = 0.005) (13).
Demographic differences among >1-year-old panthers from 2002 to 2004 (Fig. 3A) were evident when 23 out of 29 (23/29) (79%) CFPs alive in 2002 were lost versus 22/47 (47%) AdmFPs and when CFPs had a significantly lower yearly survival (likelihood-ratio test χ2 = 5.38, P = 0.020), dropping from 0.827 ± 0.044 (from 1997 to 2001) to 0.610 ± 0.087 [AdmFP survival declined from 0.904 ± 0.046 to 0.866 ± 0.027 (P = not significant)]. The number of documented CFP kittens went from 17 in 2002 to 5 total from 2003 to 2005, and none have been observed since (fig. S2). The CFP contribution to the AdmFP population also decreased, with only four litters (14 kittens) of CFPxAdmFP parents documented after 2004. The abrupt CFP decline (versus AdmFP increases; Fig. 3A) and differential patterns of survival and mortality are consistent with an AdmFP competitive advantage.
Panther survival is also affected by disease agents (4, 9). From 2001 to 2007, 19 Florida panthers tested positive for feline leukemia virus (FeLV) antibodies, and 5 in Okaloacoochee Slough State Forest (OSSF) (Fig. 1) died with active FeLV infections (10). A capture and vaccination program was implemented in 2003, and no further active infections were documented after July 2004. Further, the prevalence of a puma-specific strain of feline immunodeficiency virus (FIVPCO) increased 16 to 80% from 1995 to 2005. Although not explicitly implicated in clinical disease in free-ranging pumas, FIVPCO infection may predispose individuals to other diseases due to low lymphocyte numbers (14).
A detailed population pedigree confirmed all dam/offspring inferences from field observations (278 kittens from 128 litters marked as neonates, and 51 juveniles and subadults associated with suspected dams), supported 120 of 130 sire/offspring field inferences, and identified an additional 174 probable parents (48 dams and 126 sires). At least one parent was assigned to 422 individuals: 74 different dams and 49 sires to 397 and 298 offspring, respectively (table S2 and figs. S3 and S4). The estimated relative genetic contribution of the TX females to the descendant population varied widely (TX101 = 0.20, TX105 = 0.01, TX106 = 0.06, TX107 = 0.10, and TX108 = 0.04).
Shrinking and fragmented populations are at high risk for inbreeding depression (15, 16) and local extinction (17) through demographic and stochastic events (18). These influences probably caused the precipitous decline in Florida panther Ne from 1900 to 1980 (19). The stated goal of the Florida panther genetic restoration plan was to improve population size and viability by increasing genetic variability without losing unique local adaptations. By several measures, this experiment was successful. Most notably, after the introduction of Texas females, the population tripled, with a parallel significant reduction in the incidence of several phenotypic characters historically associated with inbreeding depression (Table 1). Additionally, admixed panthers exhibited behaviors that might be associated with higher fitness, as evidenced by increased escape behavior from high trees during capture (RR = 2.0, P = 0.001, fig. S5).
Table 1.
Estimates of molecular genetic variation and prevalence of physiological and morphologic traits in Florida panthers of different genetic heritages (13) (seetable S3). NA, not available.
| Crytorchidism** | Prevalence of** | ||||||||
|---|---|---|---|---|---|---|---|---|---|
| Heritage group | No. | Average* heterozygosity | Avg. no. of descended testicles | Prevalence in males | Normal sperm (%) Ejaculate (EJ) Gamete rescue (GR) (No. of males) | Atrial septal defects | Kinked tails | Cowlick on thorax | Percent of** individuals with ≥1 abnormal trait |
| CFP | EJ 5.4 ± 0.7C (15) | ||||||||
| 116 | 0.167 ± 0.005a | 1.3 ± 0.07A | 0.66 ± 0.06A | GR 10.1 ± 1.9n (13) | 0.17 ± 0.05A | 0.90 ± 0.03A | 0.81 ± 0.04A | 70.3 ± 2.5a | |
| EVG | 17 | 0.282 ± 0.022b,d | 2.0 ± 0B | 0B | 9.5 ± 0.6B (5) | 0A | 0.31 ± 0.12b | 0.29 ± 0.11B | 22.5 ± 7.1b |
| TX | 5 | 0.318 ± 0.02b,d | 2.0 ± 0B§ | 0B§ | 14.0 ± 3.5A,B§ (9) | 0A | 0B | 0B | 0B |
| All AdmFP | 143 | 0.244 ± 0.006b | 1.9 ± 0.0B | 0.10 ± 0.035B | (See below) | 0.08 ± 0.030A | 0.25 ± 0.037b | 0.27 ± 0.039b | 19.5 ± 2.1b |
| AdmFP groups | |||||||||
| TX-F1 | 10 | 0.336 ± 0.01B, | 2.0 ± 0 | 0B | EJ 20.5 ± 4.5a (2) | 0A | 0B | 0.38 ± 0.18B | 14.6 ± 7.3B |
| TX-BC | 18 | 0.273 ± 0.016b,d | 2.0 ± 0B | 0B | NA | 0.14 ± 0.14A | 0B | 0.06 ± 0.06B | 3.2 ± 2.2b |
| Other AdmFP | 52 | 0.251 ± 0.008c,d: | 1.94 ± 0.04B | 0.06 ± 0.042b | EJ 7.0 ± 6.0 (2) | 0.065 ± 0.045A | 0.160 ± 0.05B | 0.22 ± 0.0B | 14.4 ± 3.2b |
| GR 16.6 ± 3.2p (10) | |||||||||
| Non-TX-BC | 63 | 0.216 ± 0.008C | 1.8 ± 0.06B | 0.17 ± 0.06B | NA | 0.08 ± 0.04A | 0.43 ± 0.070B | 0.36 ± 0.07B | 29.4 ± 3.3b |
t test and
Fisher’s exact test: Column values (mean ± SE) with different superscript letters (A to D; except GR sperm, which is N and P) are significantly different (P < 0.05).
From (7).
In addition to genetic restoration, enhancement in panther numbers was probably facilitated by action initiated in the late 1980s by federal, state, and private groups to mitigate panther declines and facilitate natural recovery. This included buttressing legal protection under the Endangered Species Act (20), acquiring and protecting >120,000 ha of occupied panther habitat, altering prey management (21), and constructing highway underpasses to reduce mortality from vehicle strikes (22). In spite of improvements, ongoing density-dependent factors (related to limited and decreasing habitat availability) and stochastic events will continue to regulate population growth, requiring continued commitments to identify and maintain additional quality habitat to preserve Florida panther evolutionary potential for the long term.
Supplementary Material
Footnotes
Supporting Online Material
References and Notes
- 1.Currier MJ, Mamm. Species 200, 1 (1983). [Google Scholar]
- 2.McBride RT, McBride RT, McBride RM, McBride CE, Southeast. Nat 7, 381 (2008). [Google Scholar]
- 3.O’Brien SJ et al. , Natl. Geogr. Res 6, 485 (1990). [Google Scholar]
- 4.Roelke ME, Martenson JS, O’Brien SJ, Curr. Biol 3, 340 (1993). [DOI] [PubMed] [Google Scholar]
- 5.Culver M, Johnson WE, Pecon-Slattery J, O’Brien SJ, J. Hered 91,186(2000). [DOI] [PubMed] [Google Scholar]
- 6.Hedrick PW, Fredrickson R, Conserv. Genet 11, 615 (2010). [Google Scholar]
- 7.Barone MA et al. , J. Mammal 75, 150 (1994). [Google Scholar]
- 8.Cunningham MW et al. , J. Wildl. Dis 35, 519 (1999). [DOI] [PubMed] [Google Scholar]
- 9.Roelke ME et al. , J. Wildl. Dis 29, 36 (1993). [DOI] [PubMed] [Google Scholar]
- 10.Cunningham MW et al. , J. Wildl. Dis 44, 537 (2009). [DOI] [PMC free article] [PubMed] [Google Scholar]
- 11.Seal US, Lacy RC, Eds., A Plan for Genetic Restoration and Management of the Florida Panther (Felis concolor coryi) (Report to the Florida Game and Fresh Water Fish Commission, Conservation Breeding Specialist Group, Apple Valley, MN, 1994). [Google Scholar]
- 12.O’Brien SJ, Tears of the Cheetah and Other Tales from the Genetic Frontier (St. Martin’s Press, New York, 2003). [Google Scholar]
- 13.Materials, methods, and additional figures and tables are available as supporting material on Science Online.
- 14.Roelke ME et al. , J. Wildl. Dis 42, 234 (2006). [DOI] [PubMed] [Google Scholar]
- 15.Lacy RC, J. Mammal 78, 320 (1997). [Google Scholar]
- 16.Hedrick PW, Kalinowski ST, Annu. Rev. Ecol. Syst 31, 139 (2000). [Google Scholar]
- 17.Frankham R, Ralls K, Nature 392, 441 (1998). [Google Scholar]
- 18.Lande R, Science 241, 1455 (1988). [DOI] [PubMed] [Google Scholar]
- 19.Culver M, Hedrick PW, Murphy K, O’Brien S, Hornocker MG, Anim. Conserv 11, 104 (2008). [Google Scholar]
- 20.O’Brien SJ, Mayr E, Science 251, 1187 (1991). [DOI] [PubMed] [Google Scholar]
- 21.Janis MW, Clark JD, J. Wildl. Manage 66, 839 (2002). [Google Scholar]
- 22.Foster ML, Humphrey SR, Wildl. Soc. Bull 23, 95 (1995). [Google Scholar]
- 23.Kautz R et al. , Biol. Conserv 130, 118 (2006). [Google Scholar]
- 24.We dedicate this study to the memory of Ulysses Seal and Ernst Mayr, important heroes in the conservation struggle of the Florida panther. Funded by the Florida Fish and Wildlife Conservation Commission (FWC) via purchases of Florida panther license plates. Other major funding for the field work was provided by Everglades National Park (EVER), the BCNP, and federal funds from the U.S. Fish and Wildlife Service (especially in the early years) as well as from the National Cancer Institute, National Institutes of Health (NIH), under contract number N01-CO-12400. This research was supported in part by the Intramural Research Program of NIH, National Cancer Institute, Center for Cancer Research, and the Florida Panther Research and Management Trust Fund. All panther captures, sampling, and radio collaring were authorized by U.S. Fish and Wildlife Service Endangered Species Permits TE01553–3 (FWC) and TE146761–1 (BCNP). We thank many individuals for their help in this project, who are named in SOM reference S25.
Associated Data
This section collects any data citations, data availability statements, or supplementary materials included in this article.