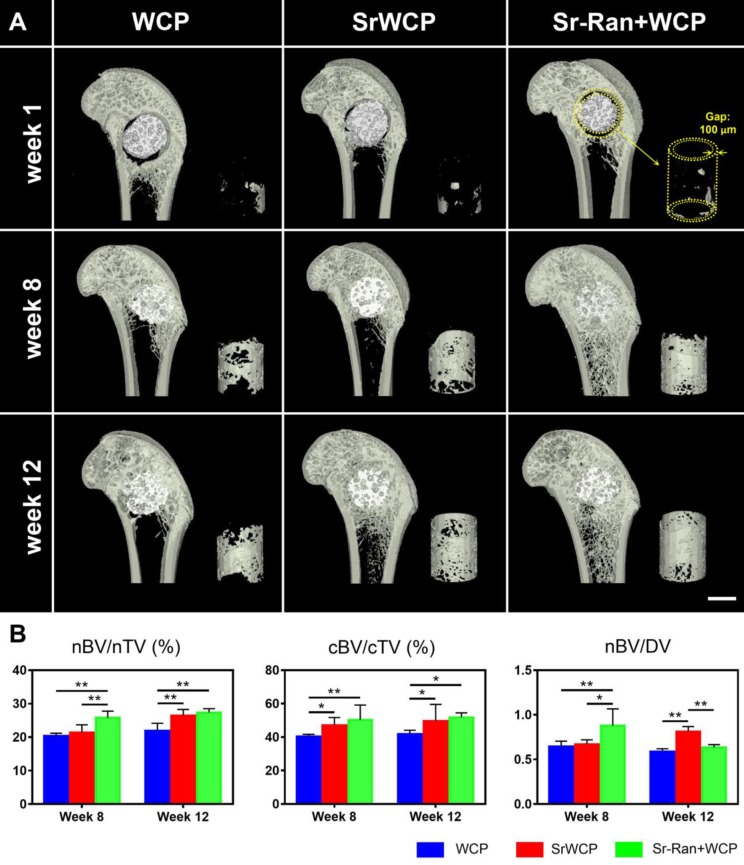
Figure 5.
Micro-CT rendered images and data of the bone formation. (A) Reconstructed micro-CT images of the coronal sections from the metaphyseal femur at weeks 1, 8 and 12. The materials (white) were embedded in newly formed bone (grey) after implantation. Right corner of each sample: 3D reconstructed images of the newly formed bone inside the gap (100 μm) between the implants and host bone (scale bar = 2 mm). (B) Quantitative analysis of micro-CT data: the new bone formation (nBV, mm3) within the drilled hole (nTV, mm3) and the volume of circular new bone formation (cBV, mm3) within the circular gap (cTV, mm3). The original volume of each material (MV) was measured before implantation and the volume of the remaining material (RMV) within the bone defect at each time point can be calculated. Thus, the degraded material (DV) is equal to MV minus RMV. The bone ingrowth rate (nBV/nTV), bone-implant osseointegration rate (cBV/cTV) and bone substitution rate (nBV/DV) were then obtained, respectively (*p < 0. 05, **p < 0.01).

