Abstract
Background
Hepatocellular carcinoma (HCC) is the most common type of liver tumour, and is closely related to liver cirrhosis. Previous studies have focussed on the pathogenesis of liver cirrhosis developing into HCC, but the molecular mechanism remains unclear. The aims of the present study were to identify key genes related to the transformation of cirrhosis into HCC, and explore the associated molecular mechanisms.
Methods
GSE89377, GSE17548, GSE63898 and GSE54236 mRNA microarray datasets from Gene Expression Omnibus (GEO) were analysed to obtain differentially expressed genes (DEGs) between HCC and liver cirrhosis tissues, and network analysis of protein–protein interactions (PPIs) was carried out. String and Cytoscape were used to analyse modules and identify hub genes, Kaplan–Meier Plotter and Oncomine databases were used to explore relationships between hub genes and disease occurrence, development and prognosis of HCC, and the molecular mechanism of the main hub gene was probed using Kyoto Encyclopedia of Genes and Genomes(KEGG) pathway analysis.
Results
In total, 58 DEGs were obtained, of which 12 and 46 were up- and down-regulated, respectively. Three hub genes (CDKN3, CYP2C9 and LCAT) were identified and associated prognostic information was obtained. CDKN3 may be correlated with the occurrence, invasion, and recurrence of HCC. Genes closely related to changes in the CDKN3 hub gene were screened, and Kyoto Encyclopedia of Genes and Genomes (KEGGs) pathway analysis identified numerous cell cycle-related genes.
Conclusion
CDKN3 may affect the transformation of liver cirrhosis into HCC, and represents a new candidate molecular marker of the occurrence and progression of HCC.
Keywords: Hepatocellular carcinoma, Liver cirrhosis, Bioinformatics, CDKN3, Microarray, Protein–protein interactions, Molecular markers
Background
Hepatocellular carcinoma (HCC) is the fifth most common malignant tumour worldwide, and the second deadliest [1]. Risk factors for HCC include hepatitis B and C infection, liver cirrhosis and alcohol intake [2]. In many liver diseases, there are no significant differences in the incidence of liver cancer between cirrhotic and non-cirrhotic states. However, compared with the non-cirrhotic state, the incidence of HCC in the cirrhotic state is significantly increased (2.79–45.00-fold) [3]. Current molecular markers of liver cancer, such as α-fetal protein [4], decarboxylation of thrombin [5] and insulin-like growth factor [6] cannot clearly distinguish between liver cancer and liver cirrhosis. Additionally, treatment of early hepatocellular carcinoma can improve the survival rate of patients [7]. Therefore, it is very important to understand the mechanism by which liver cirrhosis develops into liver cancer, and explore the molecular characteristics of HCC occurrence, development, and poor prognosis to provide new strategies for the effective prevention, diagnosis and treatment of HCC.
Microarray and bioinformatics approaches have been widely used to screen genetic changes at the genome level. Herein, we analysed four mRNA microarray datasets from Gene Expression Omnibus (GEO) to obtain differentially expressed genes (DEGs) between HCC and liver cirrhosis tissues. Subsequently, protein–protein interaction (PPI) network analysis was carried out to explore relationships between different genes, hub genes were screened using the MCODE plug-in, and relationships between hub genes and prognosis were analysed by Kaplan–Meier Plotter. Combined with ONCOMINE database analysis, CDKN3 was identified as a key hub gene closely correlated with the progression of HCC. cBioPortal was used to identify genes closely related to changes in CDKN3, and Kyoto Encyclopedia of Genes and Genomes (KEGG pathway) analysis was used to analyse the mechanism by which CDKN3 may affect the occurrence and development of HCC. The findings provide new candidate molecular markers for studying the occurrence and development of HCC.
Materials and methods
Microarray data
Genes were screened using the GEO (http://www.ncbi.nlm.nih.gov/geo) database, specifically the GSE89377 series on the GPL6947 platform (Illumina HumanHT12 V3.0 expression beadchip), the GSE17548 series [8] on the GPL570 platform (Affymetrix Human Genome U133 Plus 2.0 Array), the GSE63898 series [9] on the GPL13667 platform (Affymetrix Human Genome U219 Array), and the GSE54236 series [10] on the GPL6480 platform (Agilent-014850 Whole Human Genome Microarray 4x44K G4112F), the basic clinical info of the patients selected is showed in Additional file 1: Table S1. According to the annotation information in each platform, probes were converted into corresponding gene symbols. The GSE89377 dataset contained 40 HCC tissue samples and 12 liver cirrhosis samples, the GSE17548 dataset contained 18 HCC tissue samples and 19 liver cirrhosis samples, the GSE63898 dataset contained 228 HCC tissue samples and 168 liver cirrhosis samples, and the GSE54236 dataset contained 81 HCC tissues samples and 80 liver cirrhosis samples.
Identification of DEGs
GEO2R (https://www.ncbi.nlm.nih.gov/geo/geo2r/) was used to identify DEGs between HCC and liver cirrhosis samples. GEO2R is an interactive network tool that allows users to compare two or more datasets in the GEO series to identify DEGs under experimental conditions [11]. Genes without a corresponding gene symbol, and genes with more than one probe set are separately removed, and fold change (FC) > 2 and adjusted p < 0.05 are the threshold criteria for statistical significance. In order to identify significant DEGs, the Venn online tool (http://bioinformatics.psb.ugent.be/webtools/Venn/) was used to draw a Venn map, and overlapping DEGs were retained for further analysis.
Construction and module analysis of the PPI network
The String online database (http://string-db.org Version:11.0) [12] was used to build a PPI network. Analysis of functional interactions between proteins can be helpful for understanding mechanisms related to disease occurrence and development. Herein, a comprehensive Gt score > 0.4 was considered statistically significant. The molecular composite detection plug-in MCODE within Cytoscape [13] was used to cluster the resulting network in order to reveal closely connected regions. The most important module in the PPI network was identified by MCODE. The selection criteria were MCODE score > 5, cut-off value = 2, node cut-off value = 0.2, maximum depth = 100, and k-score = 2.
Hub gene analysis
Correlations between hub genes was analysed which came from TCGA using cBioPortal (http://www.cbioportal) [14]. The online database the Wurmbach liver dataset [15] which comes from Oncomine (http://www.oncomine.com) [16] was used to analyse expression levels of key genes under normal, cirrhotic, hepatocellular and hepatocyte dysplasia conditions. Overall survival related to hub genes was analysed using the Kaplan–Meier curve feature of Kaplan–Meier Plotter which includes 364 patients [17]. With the Wurmbach liver dataset, Oncomine was used to analyse differential expression of core genes in different studies, and to analyse the relationships between expression level and liver cancer tumour grade, hepatitis virus infection status, satellites, and vascular invasion, and to identify core genes most closely related to the development of HCC [16]. DEGs closely related to core genes were further screened by cBioPortal [18], and KEGG pathway analysis of genes related to DEGs was performed using DAVID [19]. The resulting pathway map was drawn using KEGG [20]. The relevant positions of corresponding genes in the pathway were coloured red.
Results
Identification and analysis of DEGs in liver cancer tissues
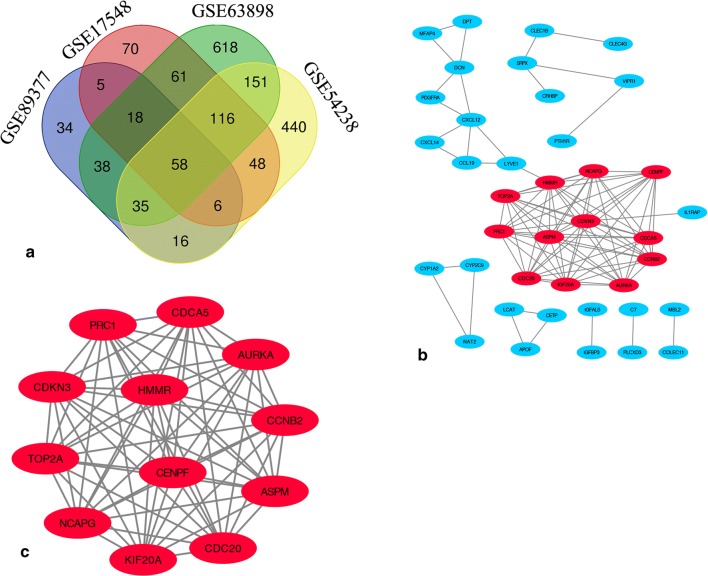
DEGs identified in the four microarray datasets (382 in GSE17548, 870 in GSE54236, 1094 in GSE63898, and 210 in GSE89377) were screened after the chip results were normalised. As shown in the Venn map, 58 genes overlapped in the four datasets (Fig. 1a, Additional file 2: Table S2), comprising 12 and 46 up- and down-regulated genes. STRING database screening and PPI network construction were performed, and visualization was carried out using Cytoscape software (Fig. 1b). The PPI network was constructed and significant modules were identified, with 93 edges and 39 nodes in the PPI network. MCODE plugin used to find the top hub genes, the most closely connected module was identified (Fig. 1c); it includes 13 nodes and 66 edges, and genes in this region were upregulated in HCC tissues.
Fig. 1.
Venn diagram and PPI network analyses, showing the most significant module related to DEGs. a DEGs were identified from GSE17548, GSE63898, GSE54238 and GSE89377 gene expression profiling datasets based on fold change > 2 and adjusted p value < 0.05. The four datasets share 58 overlapping DEGs. b PPI network constructed using 58 DEGs. Up- and down-regulated genes were marked in red and blue, respectively. c The most significant module of the PPI network includes 12 nodes and 66 edges
Selection and analysis of hub genes
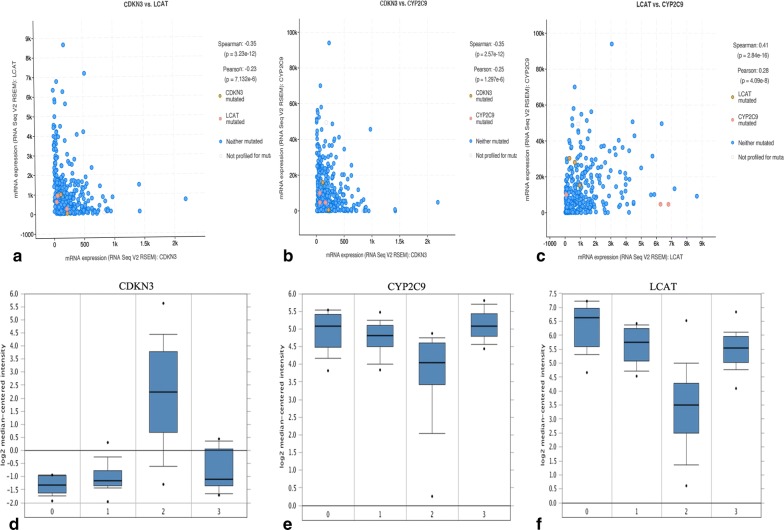
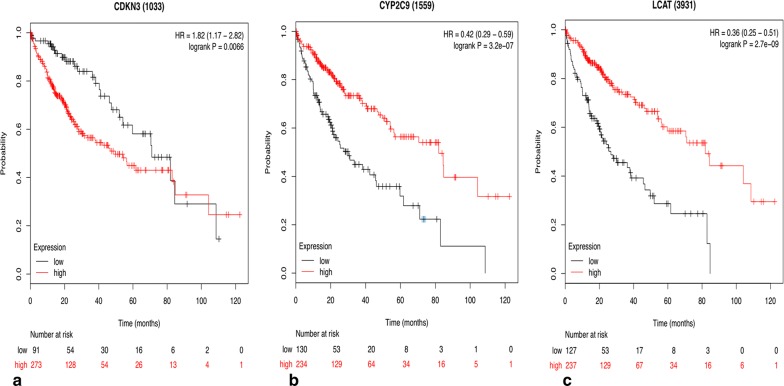
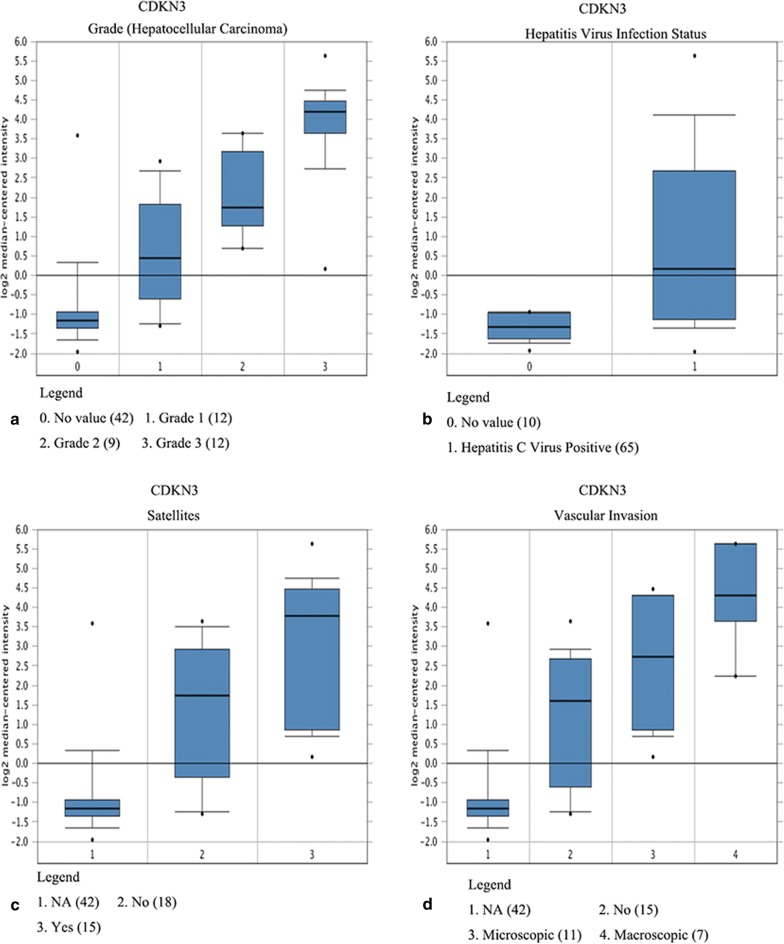
Three hub genes (seed genes) were identified by Cytoscape software, for which the names, abbreviations, and functions are listed in Table 1. Furthermore, there was a significant correlation among the three hub genes (p < 0.05) according to the cBioPortal database (Fig. 2a–c), demonstrating a specific interaction between hub genes. Additionally, the Oncomine database was used to analyse the expression of the hub gene under normal, cirrhosis, hepatocellular carcinoma and hepatocyte dysplasia conditions(Fig. 2d–f). There were no significant differences in CDKN3 between normal, cirrhotic and hepatocyte dysplasia, but expression was increased significantly in HCC (Fig. 2d). Furthermore, there were no significant differences between CYP2C9 and LCAT in normal, liver cirrhosis and hepatocyte dysplasia, but levels were decreased in HCC (Fig. 2e–f). This indicates that the hub gene plays an important role in the development of cirrhosis into HCC. However, it does not play an important role in normal, liver cirrhosis and hepatocyte dysplasia. Survival-related hub genes were analysed using the Kaplan–Meier curve feature within the Kaplan–Meier Plotter database which included 364 cases of hepatocellular carcinoma (Fig. 3). We noted that HCC patients with elevated CDKN3 levels were associated with a decrease in overall survival (p < 0.05) (Fig. 3a). And, patients with high expression of CYP2C9 or LCAT have a higher survival rate(p < 0.05) (Fig. 3b–c). We also noted that in the Wurmbach liver dataset, the mRNA expression level of CDKN3 was associated with tumour grade, hepatitis virus infection status, and satellite and vascular invasion (Fig. 4), but CYP2C9 and LCAT were not associated with tumour development (Additional file 3: Fig. S1 and Additional file 4: Fig. S2). These results suggest that CDKN3 may be a key gene in the transformation of liver cirrhosis to liver cancer, and is closely related to the occurrence and development of HCC.
Table 1.
Functional roles of hub genes with a degree ≥ 10
| Gene symbol | Full name | Function |
|---|---|---|
| CDKN3 | Cyclin-dependent kinase inhibitor 3 | The protein was identified as a cyclin-dependent kinase inhibitor, and has been shown to interact with and dephosphorylate CDK2 kinase, thereby preventing the activation of CDK2 kinase. This gene was reported to be deleted, mutated, or overexpressed in several kinds of cancers |
| CYP2C9 | Cytochrome P450 family 2 subfamily C member 9 | This gene encodes a member of the cytochrome P450 superfamily of enzymes. These monooxygenases catalyse many reactions involved in drug metabolism and the synthesis of cholesterol, steroids and other lipids |
| LCAT | Lecithin-cholesterol acyltransferase | This gene encodes the extracellular cholesterol esterifying enzyme lecithin-cholesterol acyltransferase. Esterification of cholesterol is required for cholesterol transport |
Fig. 2.
Relationships between CDKN3, CYP2C9 and LCAT, and their expression in different types of liver tissues. a–c Correlations between CDKN3, CYP2C9 and LCAT in liver hepatocellular carcinoma, p < 0.05 was considered statistically significant. d–f Expression of CDKN3, CYP2C9 and LCAT under normal, cirrhotic, hepatocellular carcinoma and hepatic dysplasia conditions in the Wurmbach liver dataset
Fig. 3.
Overall survival analyses of hub genes (CDKN3, CYP2C9 and LCAT) performed using the Kaplan–Meier Plotter online platform, p < 0.05 was considered statistically significant
Fig. 4.
Association between the expression of CDKN3 and tumour grade (a), hepatitis virus infection status (b), satellites (c), and vascular invasion (d) in the Wurmbach liver dataset
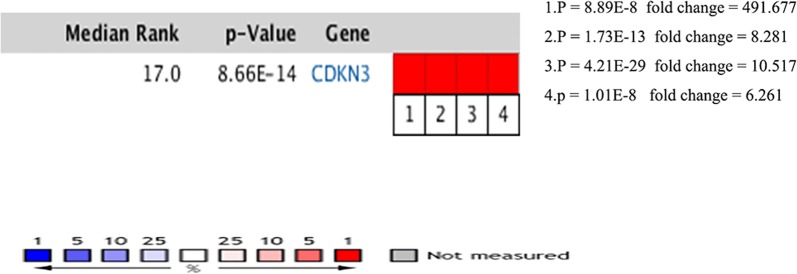
Meanwhile, Oncomine analysis showed that CDKN3 was significantly up-regulated in anaplastic oligodendrocytoma, leukaemia, hepatocellular carcinoma and sarcoma (Fig. 5).
Fig. 5.
Oncomine analysis of CDKN3 expression in cancer vs. normal tissues. Heatmaps represent CDKN3 gene expression in carcinoma samples vs. normal tissues. 1. Adrenal cortex carcinoma vs. normal tissues (Giordano Am J Pathol, 2003 [45]); 2. Hepatocellular carcinoma vs. normal tissues (Wurmbach [17]); 3. Squamous cell lung carcinoma vs. normal tissues (Hou PLoS One, 2010 [46]); 4. Adrenal cortex carcinoma vs. normal tissue (Giordano Am J Pathol, 2003)
Screening and analysis of genes related to CDKN3 expression in HCC
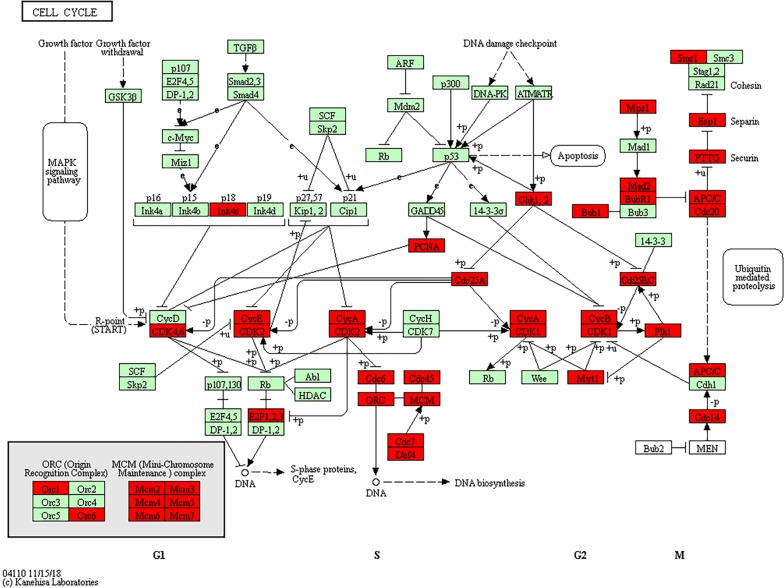
In order to understand the expression of CDKN3 in different tumours, Oncomine analysis was performed, and the results showed that CDKN3 was significantly elevated in anaplastic oligodendrocytoma, leukaemia, hepatocellular carcinoma and sarcoma (Fig. 5). In order to further analyse the potential mechanism of the influence of CDKN3 on HCC, the co-expression genes of CDKN3 in TCGA HCC transcriptome data were screened by cBioProtal data analysis platform, Pearson and Spearman scores are more than 0.3. The top 20 genes are listed in Table 2. Correlations with expression levels were evaluated by Pearson and Spearman scores. KEGG pathways related to the top 500 related genes were analysed by DAVID online software, and the top 8 hits are shown in Table 3. The results showed that changes in CDKN3 expression mainly affected pathways related to HCC, such as the cell cycle, DNA replication, oocyte meiosis and mismatch repair. We observed that most genes with strong correlations to CDKN3 expression were involved in cell cycle regulation, and these genes were used to generate a KEGG pathway map (Fig. 6), which relevant positions of the corresponding genes in the pathway are coloured red. The results showed that ORC, MCM, Chk1 and 2, and some other genes occupy important positions, mainly located in the S or G2/M phases of the cell cycle, and they regulate the G1 phase of the gene. Thus, CDKN3 mainly inhibits the transition from the G 1 to the S phase, and plays an important role in inhibiting cancer progression.
Table 2.
cBioPortal analysis of the 20 genes most closely related to CDKN3
| Gene | Cytoband | Spearman’s correlation | p-value | q-value |
|---|---|---|---|---|
| SPC25 | 2q24.3 | 0.86085851 | 6.68E−111 | 1.34E−106 |
| CDK1 | 10q21.2 | 0.85877853 | 8.53E−110 | 8.57E−106 |
| CCNB2 | 15q22.2 | 0.85556873 | 4.02E−108 | 2.69E−104 |
| NDC80 | 18p11.32 | 0.85377317 | 3.33E−107 | 1.67E−103 |
| DLGAP5 | 14q22.3 | 0.85123904 | 6.27E−106 | 2.52E−102 |
| CCNB1 | 5q13.2 | 0.84636895 | 1.52E−103 | 5.10E−100 |
| NCAPG | 4p15.31 | 0.84493736 | 7.38E−103 | 2.12E−99 |
| CENPA | 2p23.3 | 0.84378996 | 2.59E−102 | 6.50E−99 |
| TROAP | 12q13.12 | 0.84327453 | 4.53E−102 | 1.01E−98 |
| TPX2 | 20q11.21 | 0.84187347 | 2.05E−101 | 4.12E−98 |
| KIF4A | Xq13.1 | 0.84112657 | 4.57E−101 | 8.34E−98 |
| CDCA3 | 12p13.31 | 0.83985708 | 1.76E−100 | 2.95E−97 |
| HJURP | 2q37.1 | 0.83858943 | 6.70E−100 | 1.00E−96 |
| NUF2 | 1q23.3 | 0.83854781 | 7.00E−100 | 1.00E−96 |
| KIFC1 | 6p21.32 | 0.83732595 | 2.51E−99 | 3.36E−96 |
| PTTG1 | 5q33.3 | 0.83712825 | 3.08E−99 | 3.87E−96 |
| SKA1 | 18q21.1 | 0.83233493 | 4.15E−97 | 4.90E−94 |
| CDC25C | 5q31.2 | 0.83159127 | 8.75E−97 | 9.76E−94 |
| NEK2 | 1q32.3 | 0.82993815 | 4.54E−96 | 4.80E−93 |
| SKA3 | 13q12.11 | 0.82253139 | 5.87E−93 | 5.89E−90 |
Table 3.
KEGG pathway enrichment analysis of CDKN3-related genes
| Gene set name | Count | p-value | Genes |
|---|---|---|---|
| Cell cycle | 41 | 9.93E−33 | E2F1, E2F2, CDC14B, DBF4, PKMYT1, TTK, PTTG2, CHEK1, PTTG1, CCNE2, CCNE1, CDC45, MCM7, CDKN2C, BUB1, ORC6, CCNA2, ORC1, CDC7, CDK1, CDC6, ESPL1, CDC20, MCM2, CDK4, CDC25C, MCM3, MCM4, MCM5, CDK2, CDC25A, MCM6, CDC25B, CCNB1, CCNB2, MAD2L1, PLK1, PCNA, BUB1B, ANAPC7, SMC1B |
| DNA replication | 22 | 3.25E−24 | LIG1, POLA1, POLA2, MCM2, RNASEH2A, MCM3, MCM4, MCM5, MCM6, RFC5, POLD3, PRIM1, DNA2, RFC3, RFC4, MCM7, POLE2, RFC2, POLD1, PRIM2, PCNA, FEN1 |
| Oocyte meiosis | 23 | 2.35E−13 | CDK1, CPEB3, PKMYT1, AURKA, PTTG2, CDC20, ESPL1, PTTG1, CDC25C, PPP1CC, CDK2, CCNB1, CCNE2, CCNE1, MAD2L1, CCNB2, SGO1, PLK1, BUB1, FBXO43, FBXO5, ANAPC7, SMC1B |
| Mismatch repair | 11 | 2.00E−10 | EXO1, RFC5, POLD3, MSH6, RFC3, RFC4, RFC2, MSH2, LIG1, POLD1, PCNA |
| Fanconi anaemia pathway | 13 | 1.65E−08 | RAD51C, BLM, EME1, FAAP24, RMI2, BRCA1, RAD51, FANCI, FANCD2, FANCE, FANCG, UBE2T, FANCB |
| Homologous recombination | 10 | 5.51E−08 | POLD3, RAD51C, XRCC3, XRCC2, BLM, POLD1, EME1, RAD54B, RAD54L, RAD51 |
| Progesterone-mediated oocyte maturation | 14 | 3.80E−06 | CCNB1, CDK1, MAD2L1, CCNB2, PLK1, CPEB3, BUB1, PKMYT1, ANAPC7, CDC25C, CCNA2, CDC25A, CDK2, CDC25B |
| Spliceosome | 8 | 7.94E−07 | SNRPA1, ALYREF, SNRPD1, SF3A2, SF3B4, RBMX, HNRNPU, SRSF3, HNRNPA3, SRSF9, USP39, SNRPB, SNRPA, SNRPF, THOC1,SNRPG, RBM17 |
Fig. 6.
Positional relationships of CDKN3-associated genes in the cell cycle. The CDKN3-related genes in the cell cycle pathway are brought into the website related to the KEGG pathway to generate a road map, and the relevant positions of the corresponding genes in the pathway are marked with red circles, most of which are related to the S phase and G2/M phase of the cell cycle
Discussion
Hepatocellular carcinoma (HCC) is the fifth most common malignant tumour worldwide, and the second deadliest. According to statistical data from the International Centre for Cancer Research [21], the global incidence of HCC has increased more than 626,000 per year, and the fatality rate has reached nearly 600,000 per year. The disease is characterised by rapid development, a high degree of malignancy, a low rate of early diagnosis, and poor prognosis, seriously harming human health and wellbeing. Risk factors for liver cancer include hepatitis B and C infection, cirrhosis, and alcohol intake; 80 to 90% of HCC patients have cirrhosis, which is the most important risk factor [22, 23]. In many liver diseases, there is a significant difference in the incidence of liver cancer between the cirrhotic state and the non-cirrhotic state. The incidence of HCC in cirrhotic patients is significantly higher than that in non-cirrhotic patients, and studies have quantified the correlation between the degree of hepatic fibrosis and liver cancer. Most patients with liver cancer progress to the advanced stage or undergo metastasis, by which time surgical operations struggle to achieve an adequate curative effect, and prognosis is very poor. Sorafenib, the only drug approved by the FDA for advanced liver cancer, can only be extended for 2.8 months [24]. Early screening and preventive treatment for patients with HCC can effectively prolong the 5-year survival rate [25]. However, the mechanism by which cirrhosis develops into liver cancer is still unclear.
Herein, a series of bioinformatics analyses were performed on four independent gene chip databases (from cirrhotic and liver cancer tissue), and 58 common DEGs were identified, of which 12 and 46 were up- and down-regulated, respectively. Among the DEGs, three potential hub genes (CDKN3, CYP2C9 and LCAT) were obtained using the MCODE plug-in of Cytoscape. CDKN3 is a cyclin-dependent kinase inhibitor that interacts with and dephosphorylates Cdk2 kinase to prevent its activation. This gene is deleted, mutated or overexpressed in several cancers [26]. LCAT encodes an extracellular cholesterol esterase, lecithin-cholesterol acyltransferase, and cholesterol esterification is essential for cholesterol transport [25]. CYP2C9 is a C-type member of the cytochrome P450 family 2 subfamily. This monooxygenase catalyses a variety of reactions related to drug metabolism and the synthesis of cholesterol, steroids and other lipids [27–29].
Furthermore, we determined that an up-regulation of CDKN3 is associated with a poor overall survival rate (p < 0.05) based on correlations between key genes and clinical data. However, there is controversy over the role of CDKN3 in different tumours; some studies suggest that CDKN3 is a tumour suppressor gene [5], since CDKN3 inhibits cell proliferation in glioblastoma [30], chronic myeloid leukaemia [31], and neuroblastoma [32]. However, the gene is highly expressed in lung cancer [33], nasopharyngeal carcinoma [34], ovarian cancer [35], cervical cancer [36], gastric cancer [37], pancreatic cancer [37], prostate cancer [38] and breast cancer [39], and it promotes cell proliferation and cancer progression. In these cancers, high expression of CDKN3 indicates poor prognosis. In our current study, Oncomine analysis showed that CDKN3 was significantly elevated in anaplastic oligoastrocytoma, leukaemia, HCC, and sarcoma. We demonstrated that CDKN3 was associated with tumour grade, hepatitis virus infection status, microsatellites, and vascular invasion, by verifying the clinical relevance of CDKN3 in patients with HCC. By compared liver cancer, cirrhosis, and normal tissues, CDKN3 was found to be significantly increased in HCC tissues, but the difference was not significant between cirrhosis and normal tissues. This indicates that CDKN3 may be a key gene in the development of HCC in patients with cirrhosis.
In order to explore the mechanism by which CDKN3 influences the occurrence and development of liver cancer, we used bioinformatics tools to screen genes related to changes in CDKN3, and SPC25, CDK1 and CCNB2 were identified. KEGG pathway analysis showed that changes in CDKN3 expression mainly affect pathways related to the cell cycle, DNA replication, meiotic division and mismatch repair, among which most CDKN3-related genes are linked to the cell cycle. However, previous studies have reported contradictory effects of CDKN3 on the cell cycle. Some studies have shown that CDKN3 acts as a cancer-promoting gene in a variety of ways to regulate the G1/S phase transition [40, 41], while others have reported that CDKN3 plays an anti-tumour role via dephosphorylation of CDK2, thereby inhibiting the G1/S phase transition [31]. Therefore, the specific regulatory mechanism by which CDKN3 influences the cell cycle remains unknown. In our current study, LIG1, POLA1, POLA2, MCM2, RNASEH2A and some other genes related to cell cycle regulation were identified. Our results suggest that CDKN3 mainly acts as a tumour-promoting gene by regulating the G1/S phase transition in HCC. Since abnormal expression of genes regulating the cell cycle is closely related to the occurrence and development of tumours, targeted cancer therapy is of great significance. Research on CDKN3 may provide new strategies for the treatment of liver cancer. Therefore, CDKN3 plays a role in the diagnosis, treatment, and prognosis of HCC, and has broad clinical application prospects.
Although previous studies have explored the molecular mechanism by which CDKN3 regulates the conversion from liver cirrhosis to liver cancer [42], only one database study explored differences in CDKN3 between HCC and liver cirrhosis. The relationship between CDKN3 and the occurrence, development, and prognosis of HCC has not been investigated. Other studies based on multiple datasets only focused on screening key genes [43, 44], but did not specifically analyse the molecular mechanism by which core genes play a role.
Through the screening of multiple databases, the present study addressed this issue, by comparing differences between normal tissues, liver cell dysplasia, cirrhosis, HCC, and other pathological states. It is clear that CKDN3 is a key gene affecting the transformation from liver cirrhosis to liver cancer. CKDN3 is closely related to the cell cycle, DNA replication, meiotic division and mismatch repair. Moreover, because CDKN3 is intimately linked to the occurrence, development and prognosis of liver cancer, it may be of value for the early diagnosis and treatment of tumours.
Conclusion
By integrating multiple microarray gene expression profiles, three key genes (LCAT, CYP2C9, and CDKN3) were identified that appear to be important for the conversion of liver cirrhosis into HCC. Among them, CDKN3 plays a key role in promoting cancer by affecting the cell cycle, which is closely related to the occurrence and development of HCC. Our results illuminate the molecular mechanism by which cirrhosis develops into HCC. The findings may inspire new strategies for screening and monitoring patients with a high risk of cirrhosis, and patients already suffering from HCC.
Supplementary information
Additional file 1: Table S1. The basic clinical info of the patients selected in GSE54236, GSE89377, GSE17548 and GSE63898.
Additional file 2: Table S2. Fold changes of the differentially expressed genes shared in GSE54236, GSE89377, GSE17548 and GSE63898.
Additional file 3: Figure S1. Association between the expression of LCAT and tumour grade, hepatitis virus infection status, satellites, and vascular invasion in the Wurmbach liver dataset.
Additional file 4: Figure S2. Association between the expression of CYP2C9 and tumour grade, hepatitis virus infection status, satellites, and vascular invasion in the Wurmbach liver dataset.
Acknowledgements
None.
Abbreviations
- HCC
hepatocellular carcinoma
- GEO
Gene Expression Omnibus
- DEGs
differentially expressed genes
- PPI
protein–protein interactions
- KEGG
Kyoto Encyclopedia of Genes and Genomes
- CDKN3
cyclin-dependent kinase inhibitor 3
- CYP2C9
cytochrome P450 family 2 subfamily C member 9
- LCAT
lecithin-cholesterol acyltransferase
Authors’ contributions
CHJ and JMH designed the study. XY, JFL and CHJ collected the literature. YFX, JMH,and CHJ performed statistical analyses. AZZ, XLW, YL, CXL, WHL, LJP, HZ, XBC, XHS, YQ, JFJ, WYJ, WYG and FL analyzed the data. CHJ and JMH wrote the manuscript. All authors read and approved the final manuscript.
Funding
This work was supported by National Natural Science Foundation of China (NOs. 81760428, 81960435, 81460363 and 81860518). Start-up Project of High-level Talents Scientific Research in Shihezi University (RCZK2018C19). Science and Technology Development Project of Xinjiang Production and Construction Corps (NO. 2018AB033). National Early Detection and Treatment Project for Upper Digestive Tract in Rural Area in China (NO. 2018).The Youth Science and Technology Innovation Leading Talents Project of Corps (NO. 2017CB004).
Availability of data and materials
The datasets during and/or analyzed during the current study available from the corresponding author on reasonable request.
Ethics approval and consent to participate
Not applicable.
Consent for publication
Not applicable.
Competing interests
The authors declare that they have no competing interests.
Footnotes
Publisher's Note
Springer Nature remains neutral with regard to jurisdictional claims in published maps and institutional affiliations.
Supplementary information
Supplementary information accompanies this paper at 10.1186/s12967-020-02229-8.
References
- 1.Torre LA, Bray F, Siegel RL, Ferlay J, Lortet-Tieulent J, Jemal A. Global cancer statistics, 2012. CA Cancer J Clin. 2015;65(2):87–108. doi: 10.3322/caac.21262. [DOI] [PubMed] [Google Scholar]
- 2.Nordenstedt H, White DL, El-Serag HB. The changing pattern of epidemiology in hepatocellular carcinoma. Dig Liver Dis. 2010;42:S206–S214. doi: 10.1016/S1590-8658(10)60507-5. [DOI] [PMC free article] [PubMed] [Google Scholar]
- 3.Forner A, Llovet JM, Bruix J. Hepatocellular carcinoma. Lancet. 2012;379(9822):1245–1255. doi: 10.1016/S0140-6736(11)61347-0. [DOI] [PubMed] [Google Scholar]
- 4.Nakamura A, Osonoi T, Terauchi Y. Relationship between urinary sodium excretion and pioglitazone-induced edema. J Diabetes Investig. 2010;1(5):208–211. doi: 10.1111/j.2040-1124.2010.00046.x. [DOI] [PMC free article] [PubMed] [Google Scholar]
- 5.Nalepa G, Barnholtz-Sloan J, Enzor R, Dey D, He Y, Gehlhausen JR, et al. The tumor suppressor CDKN3 controls mitosis. J Cell Biol. 2013;201(7):997–1012. doi: 10.1083/jcb.201205125. [DOI] [PMC free article] [PubMed] [Google Scholar]
- 6.Rehem RN, El-Shikh WM. Serum IGF-1, IGF-2 and IGFBP-3 as parameters in the assessment of liver dysfunction in patients with hepatic cirrhosis and in the diagnosis of hepatocellular carcinoma. Hepatogastroenterology. 2011;58(107–108):949–954. [PubMed] [Google Scholar]
- 7.Cabibbo G, Celsa C, Calvaruso V, Petta S, Cacciola I, Cannavo MR, et al. Direct-acting antivirals after successful treatment of early hepatocellular carcinoma improve survival in HCV-cirrhotic patients. J Hepatol. 2019;71(2):265–273. doi: 10.1016/j.jhep.2019.03.027. [DOI] [PubMed] [Google Scholar]
- 8.Yildiz G, Arslan-Ergul A, Bagislar S, Konu O, Yuzugullu H, Gursoy-Yuzugullu O, et al. Genome-wide transcriptional reorganization associated with senescence-to-immortality switch during human hepatocellular carcinogenesis. PLoS ONE. 2013;8(5):e64016. doi: 10.1371/journal.pone.0064016. [DOI] [PMC free article] [PubMed] [Google Scholar]
- 9.Villanueva A, Portela A, Sayols S, Battiston C, Hoshida Y, Mendez-Gonzalez J, et al. DNA methylation-based prognosis and epidrivers in hepatocellular carcinoma. Hepatology. 2015;61(6):1945–1956. doi: 10.1002/hep.27732. [DOI] [PMC free article] [PubMed] [Google Scholar]
- 10.Zubiete-Franco I, Garcia-Rodriguez JL, Lopitz-Otsoa F, Serrano-Macia M, Simon J, Fernandez-Tussy P, et al. SUMOylation regulates LKB1 localization and its oncogenic activity in liver cancer. EBioMedicine. 2019;40:406–421. doi: 10.1016/j.ebiom.2018.12.031. [DOI] [PMC free article] [PubMed] [Google Scholar]
- 11.Davis S, Meltzer PS. GEOquery: a bridge between the Gene Expression Omnibus (GEO) and BioConductor. Bioinformatics. 2007;23(14):1846–1847. doi: 10.1093/bioinformatics/btm254. [DOI] [PubMed] [Google Scholar]
- 12.Szklarczyk D, Franceschini A, Wyder S, Forslund K, Heller D, Huerta-Cepas J, et al. STRING v10: protein-protein interaction networks, integrated over the tree of life. Nucleic Acids Res. 2015;43(Database issue):D447–D452. doi: 10.1093/nar/gku1003. [DOI] [PMC free article] [PubMed] [Google Scholar]
- 13.Shannon P, Markiel A, Ozier O, Baliga NS, Wang JT, Ramage D, et al. Cytoscape: a software environment for integrated models of biomolecular interaction networks. Genome Res. 2003;13(11):2498–2504. doi: 10.1101/gr.1239303. [DOI] [PMC free article] [PubMed] [Google Scholar]
- 14.Unberath P, Knell C, Prokosch HU, Christoph J. Developing new analysis functions for a translational research platform: extending the cBioPortal for Cancer Genomics. Stud Health Technol Inform. 2019;258:46–50. [PubMed] [Google Scholar]
- 15.Wurmbach E, Chen YB, Khitrov G, Zhang W, Roayaie S, Schwartz M, et al. Genome-wide molecular profiles of HCV-induced dysplasia and hepatocellular carcinoma. Hepatology. 2007;45(4):938–947. doi: 10.1002/hep.21622. [DOI] [PubMed] [Google Scholar]
- 16.Rhodes DR, Yu J, Shanker K, Deshpande N, Varambally R, Ghosh D, et al. ONCOMINE: a cancer microarray database and integrated data-mining platform. Neoplasia. 2004;6(1):1–6. doi: 10.1016/S1476-5586(04)80047-2. [DOI] [PMC free article] [PubMed] [Google Scholar]
- 17.Menyhárt O, Nagy Á, Győrffy B. Determining consistent prognostic biomarkers of overall survival and vascular invasion in hepatocellular carcinoma. R Soc Open Sci. 2018;5(12):181006. doi: 10.1098/rsos.181006. [DOI] [PMC free article] [PubMed] [Google Scholar]
- 18.Gao J, Aksoy BA, Dogrusoz U, Dresdner G, Gross B, Sumer SO, et al. Integrative analysis of complex cancer genomics and clinical profiles using the cBioPortal. Sci Signal. 2013;6(269):pl1. doi: 10.1126/scisignal.2004088. [DOI] [PMC free article] [PubMed] [Google Scholar]
- 19.da Huang W, Sherman BT, Lempicki RA. Systematic and integrative analysis of large gene lists using DAVID bioinformatics resources. Nat Protoc. 2009;4(1):44–57. doi: 10.1038/nprot.2008.211. [DOI] [PubMed] [Google Scholar]
- 20.Ogata H, Goto S, Sato K, Fujibuchi W, Bono H, Kanehisa M. KEGG: Kyoto Encyclopedia of Genes and Genomes. Nucleic Acids Res. 1999;27(1):29–34. doi: 10.1093/nar/27.1.29. [DOI] [PMC free article] [PubMed] [Google Scholar]
- 21.Jemal A, Bray F, Center MM, Ferlay J, Ward E, Forman D. Global cancer statistics. CA Cancer J Clin. 2011;61(2):69–90. doi: 10.3322/caac.20107. [DOI] [PubMed] [Google Scholar]
- 22.Walker M, El-Serag HB, Sada Y, Mittal S, Ying J, Duan Z, et al. Cirrhosis is under-recognised in patients subsequently diagnosed with hepatocellular cancer. Aliment Pharmacol Ther. 2016;43(5):621–630. doi: 10.1111/apt.13505. [DOI] [PMC free article] [PubMed] [Google Scholar]
- 23.Beste LA, Leipertz SL, Green PK, Dominitz JA, Ross D, Ioannou GN. Trends in burden of cirrhosis and hepatocellular carcinoma by underlying liver disease in US veterans, 2001–2013. Gastroenterology. 2015;149(6):1471–1482. doi: 10.1053/j.gastro.2015.07.056. [DOI] [PubMed] [Google Scholar]
- 24.Llovet JM, Ricci S, Mazzaferro V, Hilgard P, Gane E, Blanc JF, et al. Sorafenib in advanced hepatocellular carcinoma. N Engl J Med. 2008;359(4):378–390. doi: 10.1056/NEJMoa0708857. [DOI] [PubMed] [Google Scholar]
- 25.El-Serag HB. Hepatocellular carcinoma. N Engl J Med. 2011;365(12):1118–1127. doi: 10.1056/NEJMra1001683. [DOI] [PubMed] [Google Scholar]
- 26.Manthei KA, Yang SM, Baljinnyam B, Chang L, Glukhova A, Yuan W, et al. Molecular basis for activation of lecithin:cholesterol acyltransferase by a compound that increases HDL cholesterol. eLife. 2018;7:e41604. doi: 10.7554/eLife.41604. [DOI] [PMC free article] [PubMed] [Google Scholar]
- 27.Senda A, Mukai Y, Hayakawa T, Kato Y, Eliasson E, Rane A, et al. Angiotensin II receptor blockers inhibit the generation of epoxyeicosatrienoic acid from arachidonic acid in recombinant CYP2C9, CYP2J2 and human liver microsomes. Basic Clin Pharmacol Toxicol. 2017;121(4):239–245. doi: 10.1111/bcpt.12789. [DOI] [PubMed] [Google Scholar]
- 28.Shuaichen L, Guangyi W. Bioinformatic analysis reveals CYP2C9 as a potential prognostic marker for HCC and liver cancer cell lines suitable for its mechanism study. Cell Mol Biol. 2018;64(7):70–74. doi: 10.14715/cmb/2018.64.7.12. [DOI] [PubMed] [Google Scholar]
- 29.Louet M, Labbe CM, Fagnen C, Aono CM, Homem-de-Mello P, Villoutreix BO, et al. Insights into molecular mechanisms of drug metabolism dysfunction of human CYP2C9*30. PLoS ONE. 2018;13(5):e0197249. doi: 10.1371/journal.pone.0197249. [DOI] [PMC free article] [PubMed] [Google Scholar]
- 30.Yu Y, Jiang X, Schoch BS, Carroll RS, Black PM, Johnson MD. Aberrant splicing of cyclin-dependent kinase-associated protein phosphatase KAP increases proliferation and migration in glioblastoma. Cancer Res. 2007;67(1):130–138. doi: 10.1158/0008-5472.CAN-06-2478. [DOI] [PubMed] [Google Scholar]
- 31.Chen Q, Chen K, Guo G, Li F, Chen C, Wang S, et al. A critical role of CDKN3 in Bcr-Abl-mediated tumorigenesis. PloS ONE. 2014;9(10):e111611. doi: 10.1371/journal.pone.0111611. [DOI] [PMC free article] [PubMed] [Google Scholar]
- 32.Niculescu MD, Yamamuro Y, Zeisel SH. Choline availability modulates human neuroblastoma cell proliferation and alters the methylation of the promoter region of the cyclin-dependent kinase inhibitor 3 gene. J Neurochem. 2004;89(5):1252–1259. doi: 10.1111/j.1471-4159.2004.02414.x. [DOI] [PMC free article] [PubMed] [Google Scholar]
- 33.Fan C, Chen L, Huang Q, Shen T, Welsh EA, Teer JK, et al. Overexpression of major CDKN3 transcripts is associated with poor survival in lung adenocarcinoma. Br J Cancer. 2015;113(12):1735–1743. doi: 10.1038/bjc.2015.378. [DOI] [PMC free article] [PubMed] [Google Scholar]
- 34.Wang H, Chen H, Zhou H, Yu W, Lu Z. Cyclin-dependent kinase inhibitor 3 promotes cancer cell proliferation and tumorigenesis in nasopharyngeal carcinoma by targeting p27. Oncol Res. 2017;25(9):1431–1440. doi: 10.3727/096504017X14835311718295. [DOI] [PMC free article] [PubMed] [Google Scholar]
- 35.Li T, Xue H, Guo Y, Guo K. CDKN3 is an independent prognostic factor and promotes ovarian carcinoma cell proliferation in ovarian cancer. Oncol Rep. 2014;31(4):1825–1831. doi: 10.3892/or.2014.3045. [DOI] [PubMed] [Google Scholar]
- 36.Barrón EV, Roman-Bassaure E, Sánchez-Sandoval AL, Espinosa AM, Guardado-Estrada M, Medina I, et al. CDKN3 mRNA as a biomarker for survival and therapeutic target in cervical cancer. PloS ONE. 2015;10(9):e0137397. doi: 10.1371/journal.pone.0137397. [DOI] [PMC free article] [PubMed] [Google Scholar]
- 37.Li Y, Ji S, Fu LY, Jiang T, Wu D, Meng FD. Knockdown of cyclin-dependent kinase inhibitor 3 inhibits proliferation and invasion in human gastric cancer cells. Oncol Res. 2017;25(5):721–731. doi: 10.3727/096504016X14772375848616. [DOI] [PMC free article] [PubMed] [Google Scholar]
- 38.Yu C, Cao H, He X, Sun P, Feng Y, Chen L, et al. Cyclin-dependent kinase inhibitor 3 (CDKN3) plays a critical role in prostate cancer via regulating cell cycle and DNA replication signaling. Biomed Pharmacother. 2017;96:1109–1118. doi: 10.1016/j.biopha.2017.11.112. [DOI] [PubMed] [Google Scholar]
- 39.Deng M, Wang J, Chen Y, Zhang L, Xie G, Liu Q, et al. Silencing cyclin-dependent kinase inhibitor 3 inhibits the migration of breast cancer cell lines. Mol Med Rep. 2016;14(2):1523–1530. doi: 10.3892/mmr.2016.5401. [DOI] [PMC free article] [PubMed] [Google Scholar] [Retracted]
- 40.Yang C, Sun JJ. Mechanistic studies of cyclin-dependent kinase inhibitor 3 (CDKN3) in colorectal cancer. Asian Pac J Cancer Prev. 2015;16(3):965–970. doi: 10.7314/APJCP.2015.16.3.965. [DOI] [PubMed] [Google Scholar]
- 41.Liu D, Zhang J, Wu Y, Shi G, Yuan H, Lu Z, et al. YY1 suppresses proliferation and migration of pancreatic ductal adenocarcinoma by regulating the CDKN3/MdM2/P53/P21 signaling pathway. Int J Cancer. 2018;142(7):1392–1404. doi: 10.1002/ijc.31173. [DOI] [PubMed] [Google Scholar]
- 42.Wang L, Sun L, Huang J, Jiang M. Cyclin-dependent kinase inhibitor 3 (CDKN3) novel cell cycle computational network between human non-malignancy associated hepatitis/cirrhosis and hepatocellular carcinoma (HCC) transformation. Cell Prolif. 2011;44(3):291–299. doi: 10.1111/j.1365-2184.2011.00752.x. [DOI] [PMC free article] [PubMed] [Google Scholar]
- 43.Shan S, Chen W, Jia JD. Transcriptome analysis revealed a highly connected gene module associated with cirrhosis to hepatocellular carcinoma development. Front Genet. 2019;10:305. doi: 10.3389/fgene.2019.00305. [DOI] [PMC free article] [PubMed] [Google Scholar]
- 44.Jiang M, Zeng Q, Dai S, Liang H, Dai F, Xie X, et al. Comparative analysis of hepatocellular carcinoma and cirrhosis gene expression profiles. Mol Med Rep. 2017;15(1):380–386. doi: 10.3892/mmr.2016.6021. [DOI] [PMC free article] [PubMed] [Google Scholar]
- 45.Giordano TJ, Thomas DG, Kuick R, Lizyness M, Misek DE, Smith AL, et al. Distinct transcriptional profiles of adrenocortical tumors uncovered by DNA microarray analysis. Am J Pathol. 2003;162:521–531. doi: 10.1016/S0002-9440(10)63846-1. [DOI] [PMC free article] [PubMed] [Google Scholar]
- 46.Hou J, Aerts J, den Hamer B, van IJcken W, den Bakker M, Riegman P, van der Leest C, van der Spek P, Foekens JA., Hoogsteden HC, Grosveld F, Philipsen S. Gene expression-based classification of non-small cell lung carcinomas and survival prediction. PLoS One. 2010;5:e10312. doi: 10.1371/journal.pone.0010312.. [DOI] [PMC free article] [PubMed] [Google Scholar]
Associated Data
This section collects any data citations, data availability statements, or supplementary materials included in this article.
Supplementary Materials
Additional file 1: Table S1. The basic clinical info of the patients selected in GSE54236, GSE89377, GSE17548 and GSE63898.
Additional file 2: Table S2. Fold changes of the differentially expressed genes shared in GSE54236, GSE89377, GSE17548 and GSE63898.
Additional file 3: Figure S1. Association between the expression of LCAT and tumour grade, hepatitis virus infection status, satellites, and vascular invasion in the Wurmbach liver dataset.
Additional file 4: Figure S2. Association between the expression of CYP2C9 and tumour grade, hepatitis virus infection status, satellites, and vascular invasion in the Wurmbach liver dataset.
Data Availability Statement
The datasets during and/or analyzed during the current study available from the corresponding author on reasonable request.


