 Uranyl Pacman takes them all: the bonding of s- and d-block cations to uranyl is compared by experiment, spectroscopy and theory.
Abstract
The uranyl(vi) ‘Pacman’ complex [(UO2)(py)(H2L)] A (L = polypyrrolic Schiff-base macrocycle) is reduced by Cp2Ti(η2-Me3SiC CSiMe3) and [Cp2TiCl]2 to oxo-titanated uranyl(v) complexes [(py)(Cp2TiIIIOUO)(py)(H2L)] 1 and [(ClCp2TiIVOUO)(py)(H2L)] 2. Combination of ZrII and ZrIV synthons with A yields the first ZrIV–uranyl(v) complex, [(ClCp2ZrOUO)(py)(H2L)] 3. Similarly, combinations of Ae0 and AeII synthons (Ae = alkaline earth) afford the mono-oxo metalated uranyl(v) complexes [(py)2(ClMgOUO)(py)(H2L)] 4, [(py)2(thf)2(ICaOUO)(py) (H2L)] 5; the zinc complexes [(py)2(XZnOUO)(py)(H2L)] (X = Cl 6, I 7) are formed in a similar manner. In contrast, the direct reactions of Rb or Cs metal with A generate the first mono-rubidiated and mono-caesiated uranyl(v) complexes; monomeric [(py)3(RbOUO)(py)(H2L)] 8 and hexameric [(MOUO)(py)(H2L)]6 (M = Rb 8b or Cs 9). In these uranyl(v) complexes, the pyrrole N–H atoms show strengthened hydrogen-bonding interactions with the endo-oxos, classified computationally as moderate-strength hydrogen bonds. Computational DFT MO (density functional theory molecular orbital) and EDA (energy decomposition analysis), uranium M4 edge HR-XANES (High Energy Resolution X-ray Absorption Near Edge Structure) and 3d4f RIXS (Resonant Inelastic X-ray Scattering) have been used (the latter two for the first time for uranyl(v) in 7 (ZnI)) to compare the covalent character in the UV–O and O–M bonds and show the 5f orbitals in uranyl(vi) complex A are unexpectedly more delocalised than in the uranyl(v) 7 (ZnI) complex. The Oexo–Zn bonds have a larger covalent contribution compared to the Mg–Oexo/Ca–Oexo bonds, and more covalency is found in the U–Oexo bond in 7 (ZnI), in agreement with the calculations.
Introduction
The uranyl(vi) dication UVIO22+ is the most common form of uranium in the environment,1 and is usually very inert to chemical modification due to its strong U O bonds, with a nominal bond order of three.2 In contrast, the uranyl(v) monocation, UVO2+, obtained by single-electron reduction, is unstable in aqueous systems and likely disproportionates to uranyl(vi) and uranium(iv),3 through U–O bonding between adjacent uranyl centres, traditionally known as cation–cation interactions (CCIs).4 Even so, uranyl(v) complexes can be isolated and studied under anaerobic conditions,1,5,6 and judicious choice of ligands such as Pacman,7 aza-β-diketiminate8 or β-ketoiminate9 can lead to chemically inert dinuclear uranium(v) dioxo complexes through selective oxo-functionalisation reactions such as reductive silylation or borylation.10,11 The enhanced oxo-basicity of the [Rn]5f1-electron configuration of uranyl(v) also facilitates the formation of complexes that combine uranyl(v) with the late 3d elements MnII, FeII, NiII and CoII. This feature can result in uranium-metal communication, for example in a trinuclear [Co–O U O–Co] complex that exhibits a magnetic exchange and a slow relaxation at a reversal barrier temperature of 30.5 ± 0.9 K, resulting in 5f–3d single molecule magnetism.12–16 We have also reported the exclusively group(I) mono-oxo metalated uranyl(v) complexes [(py)3LiOUO(py)(H2L)] B, [(py)3NaOUO (py)(H2L)] C, and [(py)3KOUO(py)(H2L)] D, and their catalytic synthesis via the oxo-aluminated uranyl(v) complexes [(py)(R2AlOUO)(py)(H2L)] (R = Me or iBu) E.17 We have shown that uranyl(vi) to uranyl(v) reduction is possible by both homolytic bond cleavage18 and sterically induced reduction,19 as well as via a direct reductive metalation.20,21 Importantly, uranyl(vi) complexes in which one oxo group is coordinated by a Lewis acid group, such as a borane or metal complex, are activated towards single-electron reduction by as much as 0.6 V.9,10,22–25 This has been used to direct the functionalisation of the oxo group by d- and p-block reagents. For example, coordination of uranyl Pacman complexes by [Zn{N(SiMe3)2}Cl] results in reductive oxo-silylation whereas with Mg{N(SiMe3)2}2 the reduced oxo-metalated complex is formed.18 It has also been used to control the abstraction of a single oxo atom by boranes and silanes.26 Borane coordination has also been used to shift the redox couple of the uranyl ion so far that the UVI to UIV reduction can be achieved by dihydrogen, a simple reducing agent of greater relevance to real-world uranyl chemistry; H2 is formed from radiolysis of water in spent nuclear fuel storage (E1/2 (H2) = –0.54 V vs. Fc/Fc+).27
The electronic structures of the actinyl ions in different formal oxidation states can be probed by various experimental and computational techniques. Experimentally, High Energy Resolution X-ray Absorption Near Edge Structure (HR-XANES) and Resonant Inelastic X-ray Scattering (RIXS) have recently emerged as very sensitive tools for characterisation of oxidation states and electronic structures of actinide elements.28–38 In particular, since they directly probe the An 5f valence unoccupied orbitals, they can distinguish small variations in the chemical bonding at the metal for uranyl(vi) and uranyl(v) compounds. These experimental spectroscopic techniques are most readily interpreted in combination with computational analyses.33,37 Recently, we, as well as others, have applied the quantum theory of atoms-in-molecules (QTAIM)39,40 and energy decomposition analysis (EDA) to analyse chemical bonding in f-element organometallic complexes.41–49
Herein we present a set of mono-metalated uranyl(v) complexes that incorporate a variety of s- and d-block metal cations and adopt very similar structural motifs. One synthetic route to these compounds includes the unique combination of group 2 or group 12 metals with their respective halide salts for reduction and metalation. We have also analysed the complexes using a variety of spectroscopic and computational techniques, including HR-XANES, EDA, molecular orbital (MO) bond analysis and QTAIM to validate the uranyl(v) oxidation state and the metal-oxo interactions, in order to better understand the effect that different reductants have on the bonding and covalency on the uranyl electronic structure.
Results and discussion
Synthesis of uranyl(v) – group(iv) metal complexes
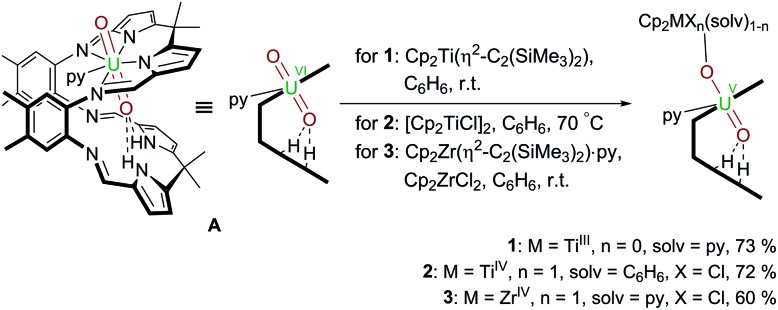
Following our work on uranyl(v) functionalisation with mono- and trivalent metals17 and synthesis of the first uranium(iv)–titanium(iv) oxo-bridged dipyrrin complex via reductive metalation,50 we have expanded our studies to include a set of group(IV) d-metal uranyl(v) complexes with TiIII–, TiIV– and ZrIV–uranyl(v) oxo-group coordination (Scheme 1).
Scheme 1. Reductive metalation of A using Cp2Ti(η2-Me3SiC CSiMe3) (1), [Cp2TiCl]2 (2), and Cp2ZrCl2/Cp2Zr(η2-Me3SiC CSiMe3)·py (3).
Reduction of uranyl by TiII, TiIII, and ZrIII complexes
Treatment of [UO2(py)(H2L)] A with one equivalent of the TiII complex Cp2Ti(η2-Me3SiC CSiMe3) in benzene at room temperature results in the formation of a pale brown solution from which the red TiIII–uranyl(v) complex [(py)Cp2TiOUO(py)(H2L)] 1 crystallises upon standing, and is isolated in 73% yield. The dark red TiIV–uranyl(v) analogue [ClCp2TiOUO(py)(H2L)] 2 can be made similarly; sonication of a benzene suspension of A and 0.5 equivalents of [Cp2TiIIICl]2 at 70 °C results in the formation of an orange-yellow solution, from which dark red crystals of the TiIV–uranyl(v) complex 2 were isolated in 72% yield, after slow evaporation of the solvent. Furthermore, the ZrIV–uranyl(v) complex [ClCp2ZrOUO(py)(H2L)] 3 could be obtained by the in situ reduction of an equimolar mixture of Cp2ZrCl2 and A with Cp2Zr(η2-Me3SiC CSiMe3)·py in benzene at room temperature (Scheme 1). Recrystallisation from THF yielded red crystals of 3 suitable for X-ray diffraction in 60% yield.
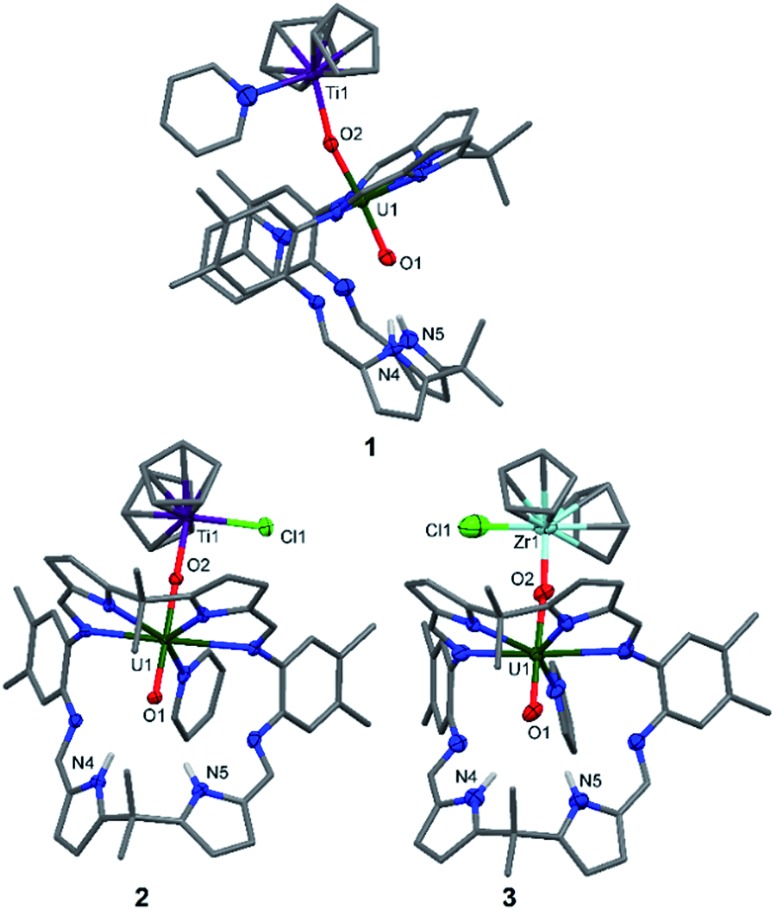
The X-ray crystal structures of 1, 2, and the heavier group IV homologue 3 were determined (Fig. 1) and all show the expected coordination of TiIII, TiIV, and ZrIV to the exogenous oxygen (exo-oxo) atom of the uranyl unit that is coordinated in the wedge-shaped Pacman geometry of the macrocyclic ligand.
Fig. 1. Solid-state structures of 1 (side view), 2 and 3 (both front view). For clarity, all hydrogen atoms except pyrrole N–Hs and all solvent molecules are omitted (displacement ellipsoids are drawn at 50% probability). Selected bond lengths (Å) for 1: U1–O1 1.846(6), U1–O2 1.925(6), O1–N4 3.09(1), O1–N5 3.02(1). O1–U1–O2 bond angle: 175.3(3)°. Selected bond lengths (Å) for 2: U1–O1 1.841(2), U1–O2 1.979(3), O1–N4 3.021(4), O1–N5 3.099(3). O1–U1–O2 bond angle: 177.43(9)°. Selected bond lengths (Å) for 3: U1–O1 1.829(8), U1–O2 1.995(7), O1–N4 3.09(1), O1–N5 3.01(1). O1–U1–O2 bond angle: 176.7(3)°.
In 1 and 2, the uranyl oxo groups are trans with near-linear O1–U1–O2 angles of 175.3(3)° (1) and 177.43(9)° (2), and significantly elongated U1–O1 and U1–O2 bond lengths of 1.846(6) Å/1.925(6) Å (1) and 1.841(2) Å/1.979(3) Å (2) respectively, compared with the O U O bonds of A (1.793(6) Å and 1.773(6) Å). Both Ti centres in 1 and 2 are η5-coordinated by two cyclopentadienyl rings, with a pyridine molecule in the fourth coordination site in 1 and a chloride atom in 2. Additionally, the TiIII–O2 bond length of 2.155(6) Å in 1 is longer than the TiIV–O2 bond length of 1.952(3) Å in 2, due to the higher formal charge of TiIV and its increased Lewis acidity when compared with TiIII. The hydrogen-bonding interactions between the endogenous oxygen atom (endo-oxo) O1 and the two pyrrole protons in the vacant macrocyclic pocket, shown by the heavy atom distances O1···N4 3.09(1) Å and O1···N5 3.02(1) Å (1) and O1···N4 3.021(4) Å and O1···N5 3.099(3) Å (2) are slightly shorter than those in A (3.111(7) Å and 3.146(7) Å) and support again the enhanced oxo basicity of the f1 cation. In 3, the uranyl oxo groups are also trans with an O1–U1–O2 angle of 176.7(3)° and the U1–O1 and U1–O2 bond lengths are elongated at 1.829(8) Å and 1.995(7) Å. The ZrIV centre in 3 is, as with the Ti atom in 2, η5-coordinated by two cyclopentadienyl rings, with the chloride completing the coordination sphere. Additionally, the ZrIV–O2 bond length of 2.031(7) Å in 3 is longer than the TiIV–O2 bond length of 1.952(3) Å in 2, due to the larger ionic radius of ZrIV. As for 1 and 2, the hydrogen-bonding interactions between the endo-oxo O1 and the two pyrrole protons in the vacant macrocyclic pocket of 3 are slightly shorter (O1···N4 3.09(1) Å and O1···N5 3.01(1) Å) than those in A.
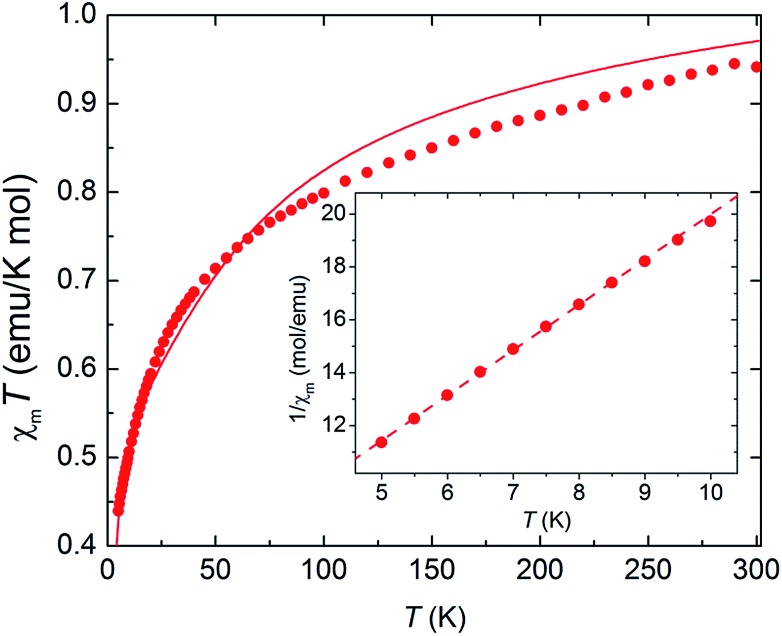
As complex 1 is a rare 5f1–3d1 system, the potential for oxo-mediated electron-coupling was investigated by superconducting quantum interference device (SQUID) magnetometry. From the shape of the curve in the χ vs. T plot (Fig. 2), there is no clear sign of magnetic coupling between the U and Ti centres, and a simple ligand-field analysis (see ESI†) shows that the antiferromagnetic exchange interaction is small.51,52
Fig. 2. Magnetic susceptibility of complex 1 as a function of temperature, plotted as χmT vs. T (main panel) and 1/χ vs. T (inset). Dots: experimental data. Solid line: ligand-field calculation. Dashed line: Curie–Weiss fit.
Synthesis of uranyl(v) – group 2 and group 12 metal complexes – reduction by Mg, Ca or Zn metal in the presence of MgII, CaII and ZnII salts
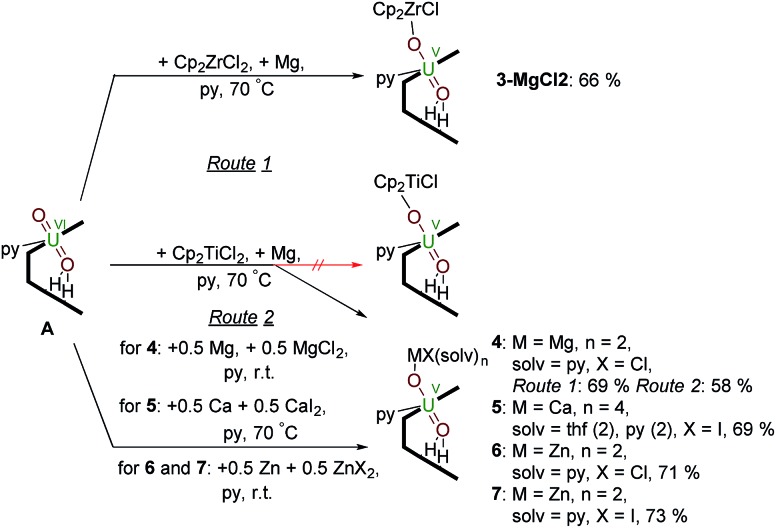
Reactions targeting 2 and 3 were also carried out by sonicating a mixture of MIV halide Cp2MCl2 (M = Ti or Zr respectively), metallic Mg, and A in pyridine at 70 °C. This was successful in the case of Zr, affording an orange-yellow solution from which beige crystals of a MgCl2 co-crystal of 3, i.e. [ClCp2ZrIVOUVO(py)(H2L)]·MgCl23·MgCl2 which was isolated in 66% yield (Scheme 2). In contrast, the pale brown solution formed in the reaction targeting the titanium complex 2 yields the magnesium–uranyl(v) complex [(py)2ClMgOUVO(py)(H2L)] 4 (Scheme 2). We attribute this to the highly reducing nature of MgI that may form in situ (Mg+/Mg = –2.70 V) as the Mg–O bond energy of 394 kJ mol–1 is significantly smaller than the Ti–O bond energy of 662 kJ mol–1.53 Treatment of A with 0.5 equivalents of Mg metal for 24 hours at room temperature resulted in an orange-red suspension. The 1H-NMR spectrum of this solution shows the formation of paramagnetic resonances indicating the formation of a uranyl(v) complex; however, all attempts to isolate this complex were unsuccessful. In terms of redox-capability, “Cp2Ti” is only a mild reductant; the reduction potential of Cp2Ti2+ is reported as –0.4 V (ref. 54) and Cp2TiCl+ as –0.6 V (ref. 55) in THF solution vs. Fc+/Fc. This prompted us to investigate the reductive capability of the group 2 and 12 metals.
Scheme 2. Reductive metalation of A using Cp2ZrCl2/Mg (3·MgCl2) as well as Mg/MgCl2 (4), Ca/CaI2 (5), Zn/ZnCl2 (6) and Zn/ZnI2 (7).
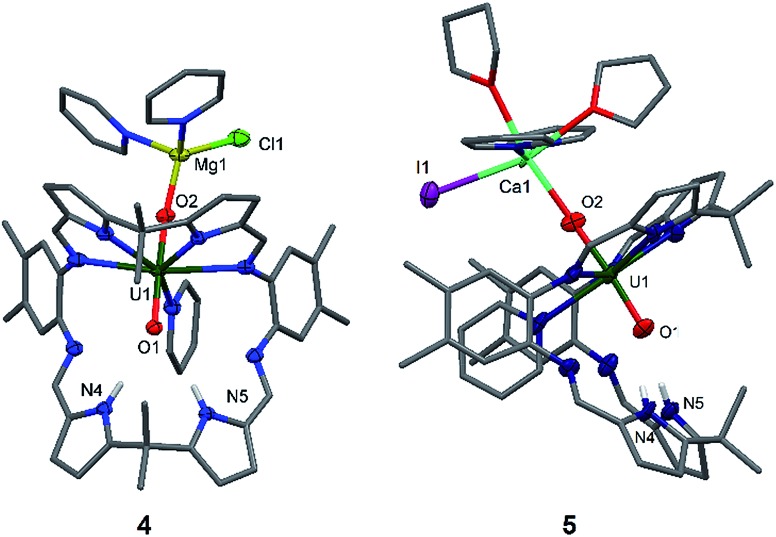
Since the MgCl2 by-product (in combination with the remaining Mg metal) is probably reacting faster than the Cp2TiCl2, suggested by the colour differences and paramagnetism of the remaining Ti-containing materials, the rational synthesis of the Mg–uranyl(v) complex 4 can be achieved by sonicating A, 0.5 equivalents MgCl2, and 0.5 equivalents metallic Mg in pyridine for 72 hours at room temperature (Scheme 2). On standing, the cherry red solution formed affords beige crystals of [(py)2ClMgOUVO(py)(H2L)] 4 suitable for X-ray diffraction in 69% yield. Similarly, sonicating A in pyridine with 0.5 equivalents of CaI2 and 0.5 equivalents of metallic Ca at 50 °C affords a red solution, which after evaporation of volatiles and recrystallisation from THF yields pale red translucent plates of [(py)2(thf)2ICaOUO(py)(H2L)] 5 suitable for X-ray structural analysis in 69% yield (Fig. 3).
Fig. 3. Solid-state structures of 4 (front view) and 5 (side view). For clarity, all hydrogen atoms except the pyrrole N–Hs and all solvent molecules are omitted (displacement ellipsoids are drawn at 50% probability). Selected bond lengths (Å) for 4: U1–O1 1.864(2), U1–O2 1.909(2), O1–N4 2.889(3), O1–N5 3.040(3). O1–U1–O2 bond angle: 174.21(9)°. Selected bond lengths for 5: U1–O1 1.88(1), U1–O2 1.90(1), Ca1–O2 2.33(1), O1–N4 2.95(2), O1–N5 2.92(2). O1–U1–O2 bond angle: 176.0(6)°.
The X-ray crystal structures of 4 and 5 represent, to the best of our knowledge, the first examples of alkaline-earth uranyl(v) complexes in the solid state. Both structures adopt a wedge-shaped Pacman geometry, possessing near-linear trans uranyl oxo groups, with an O1–U1–O2 angle of 174.21(9)° (4) and 176.0(6)° (5). Long U1–O1 and U1–O2 bond lengths of 1.864(2) Å and 1.909(2) Å (4), and 1.88(1) Å and 1.90(1) Å (5) respectively, are also observed. Two pyridine molecules coordinate to the tetrahedral Mg atom in 4, contrasting with the octahedral environment of the much bigger Ca atom in 5, in which two pyridine and two THF molecules are found. In these complexes, the MgII–O2 bond length of 1.901(2) Å in 4 is shorter than the CaII–O2 bond length of 2.33(1) Å in 5, resulting from the increased size and polarisability of the Ca. Although CaII coordination to uranyl(vi) is known in natural materials such as the polymorphic uranyl(vi) silicate mineral uranophane, Ca[(UO2)(SiO3OH)]2(H2O)5,56,57 the interaction in 5 is, to our knowledge, the first example of a CaII–uranyl(v) oxo bond. For comparison, the Ca···OUO distances in α-uranophane range from 2.38(1) Å to 2.439(9) Å and in β-uranophane from 2.471(6) Å to 2.685(6) Å, which are predominantly electrostatic interactions and therefore longer than in 5. The O–U(O) distances in these minerals range from 1.76 Å to 1.81 Å, as expected for uranyl(vi).56,57 The hydrogen-bonding interactions between the endo-oxo O1 and the two pyrrole protons in the vacant macrocyclic pocket, shown by O1–N4 2.889(3) Å and O1–N5 3.040(3) Å (4) and O1–N4 2.95(2) Å and O1–N5 2.92(2) Å (5), are again slightly shorter than those in A.
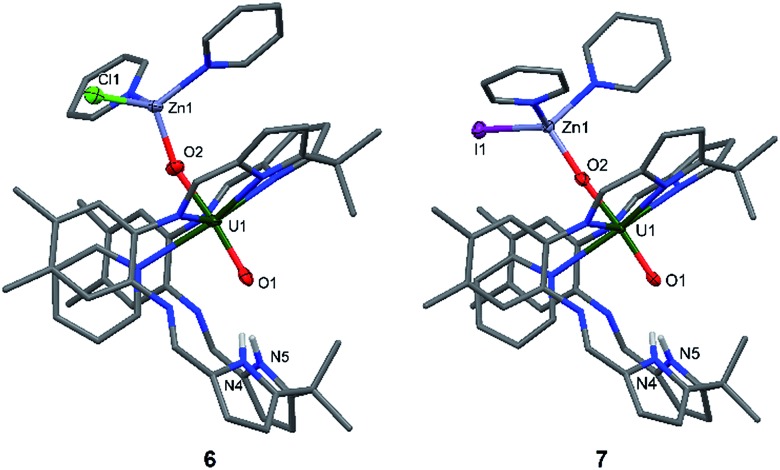
The syntheses of the Zn–uranyl(v) complexes 6 and 7 can similarly be achieved by sonicating A with 0.5 equivalents of ZnX2 (X = Cl, I) and 0.5 equivalents metallic Zn in pyridine, forming a lemon-yellow suspension (Scheme 2). Centrifugation and recrystallisation of the precipitate from pyridine yields [(py)2XZnOUVO(py)(H2L)] (6: X = Cl, 71%; 7: X = I, 73%) suitable for X-ray diffraction.
The solid-state structures (Fig. 4) both show a uranyl(v) centre with similar bond distances of 1.87 Å for U1–O1 and 1.91 Å for U1–O2. The Zn1–O2 distances vary slightly, showing values of 1.898(9) Å in complex 6 and 1.930(2) Å in complex 7. The distances between the N atoms of the lower pocket pyrrole rings and the uranyl oxygen O1 are similar, showing a slight asymmetry between O1–N4 and O1–N5 of about 0.1 Å (O1–N4 3.04(1), O1–N5 2.91(1) (6) vs. O1–N4 2.895(4), O1–N5 2.982(4) (7)). The O1–U1–O2 bond angles in both complexes are identical and linear at 175°; however, the Zn1–O2–U1 bond angle in complex 6 is more acute at 159.9(5)° than in complex 7 at 175.1(1)°.
Fig. 4. Solid state structures of 6 (side view) and 7 (side view). For clarity, all hydrogen atoms except the pyrrole N–Hs and all solvent molecules are omitted (displacement ellipsoids are drawn at 50% probability). Selected bond lengths (Å) for 6: U1–O1 1.872(9), U1–O2 1.917(9), O2–Zn1 1.898(9), O1–N4 3.04(1), O1–N5 2.91(1). Selected bond angles: O1–U1–O2 174.6(4)°, U1–O2–Zn1 159.9(5)°. Selected bond lengths for 7: U1–O1 1.867(2), U1–O2 1.909(2), O2–Zn1 1.930(2), O1–N4 2.895(4), O1–N5 2.982(4). Selected bond angles: O1–U1–O2 175.7(1)°, U1–O2–Zn1 175.1(1)°.
While the structures of 4–7 are very similar with respect to the characteristic uranium-centred bond distances, the major difference is the distance of the calcium atom in 5 to the exogenous uranyl oxygen of 2.33(1) Å, which is significantly longer than the Zn–O and Mg–O distances and results from the bigger ionic radius of 1.14 Å for Ca, compared to 0.71 Å for Mg and 0.74 Å for Zn.58 The similarity of the 6 and 7 can also be seen in the 1H-NMR spectra, which only differ in the chemical shift of the pyrrole N–H, of 75.37 ppm for 6 and 74.52 ppm for 7. It is interesting to note that we have observed crystals of 7 as a side product while studying the mechanism and pathways of uranyl oxo group silylation versus metalation.18
Reductive metalation of uranyl(vi) using Rb and Cs metal
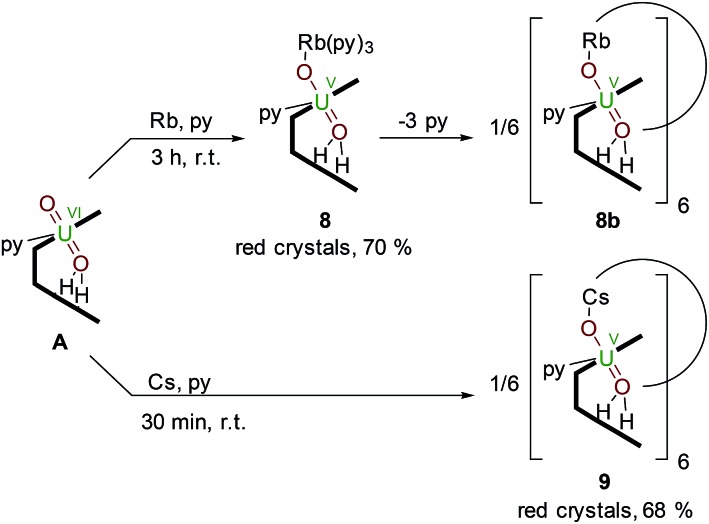
The controlled addition of a strongly reducing alkali metal should intuitively lead directly to a singly reduced uranyl complex. Indeed, we reported a catalytic synthesis of mono-oxo metalated Li (B), Na (C) and K (D)–uranyl(v) complexes that rely on an aluminated intermediate,17 but due to the unavailability of RbH and CsH, the reactions of A with elemental Rb and Cs metal were used to complete the series of Group 1 alkali-metal uranyl(v) complexes (Scheme 3).
Scheme 3. Reductive metalation of A from the reaction with either an equivalent of metallic Rb (8) or Cs (9), the latter forming a hexanuclear ring in the solid state.
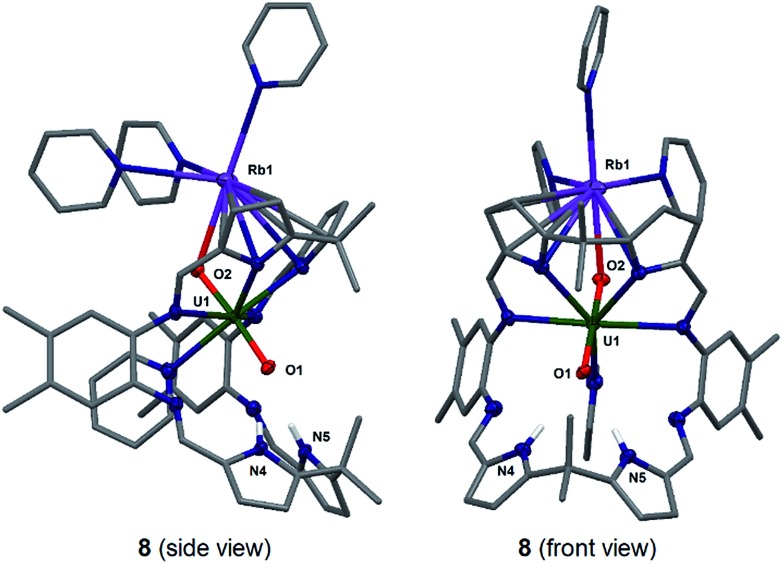
Stirring a brown solution of A in pyridine at room temperature in the presence of one equivalent of Rb metal results, after three hours, results in the formation of a dark cherry-red solution. Syringe filtration and subsequent evaporation of the solvent resulted in the formation of intensely dark red prismatic crystals of the first known uranyl(V) rubidium complex [(py)3RbOUO(py)(H2L)] 8.
The solid-state structure of 8 was determined (Fig. 5) and shows similar crystallographic parameters to those obtained for the potassium complex [(py)3KOUO(py)(H2L)] D.17 The predominant feature in the structure of 8 is the η5:η2 coordination of the Rb+ cation to the two pyrrole rings of the macrocycle as a result of the increased size and polarisability of the Rb+ cation.58 This leads to a bond angle of 115.8(1)° for the Rb1–O2–U1 coordination which is similar to the one observed for the K complex D (116.0(1)°). The U1–O1 and U1–O2 distances and the distance of the endogenous oxygen to the nitrogen atoms in the lower macrocyclic pocket, are also similar to those in D. A similar alkali metal – exo-oxo uranyl interaction to B–D is again observed. All other uranyl complexes that contain rubidium cations contain uranyl(vi) and show no such interaction, for example, the layered uranyl(vi) polyhedra-bridged by selenate anions in Rb2[(UO2)(SeO4)2(H2O)](H2O),59 molybdate in Rb6[(UO2)(MoO4)4]60 or borate in Rb2[(UO2)2B13O20(OH)5]61 with the Rb+ cation occupying the interstitial layer.
Fig. 5. Solid state structure of 8 in side view (left) and front view (right). For clarity, all hydrogen atoms except pyrrole NHs and all solvent molecules are omitted (displacement ellipsoids are drawn at 50% probability). Selected bond lengths (Å): U1–O1 1.871(3), U1–O2 1.837(3), O1–N4 2.940(5), O1–N5 2.906(5). O1–U1–O2 bond angle: 175.6(1)°.
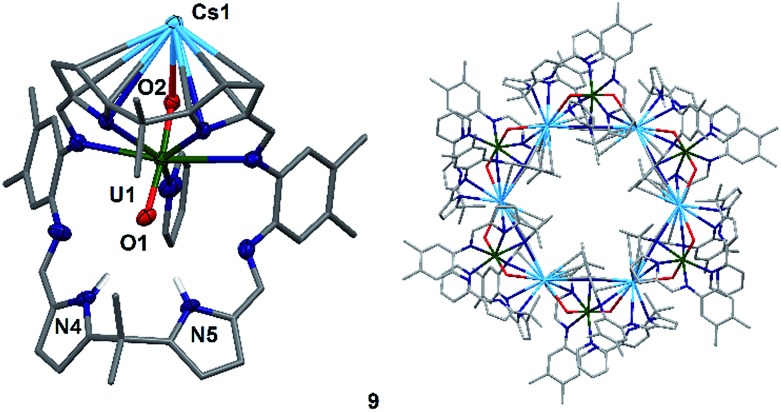
To complete the series of mono-metalated uranyl(v) alkali metal complexes, a brown suspension of A was treated with one equivalent of Cs metal in pyridine to yield after 30 minutes a dark red solution that afforded small rectangular crystals of [CsOUO(py)(H2L)]69, the first mono-metalated caesium uranyl(v) complex (Fig. 6).
Fig. 6. Solid state structure of 9, depicting the asymmetric unit (left) and the hexanuclear CsI–uranyl(v) ring (right). For clarity, all hydrogen atoms except pyrrole N–Hs and all solvent molecules are omitted (displacement ellipsoids are drawn at 50% probability). Selected bond distances (Å) and angles (°): U1–O1 1.857(6), U1–O2 1.833(6), O1–N4 3.01(1), O1–N5 2.92(1), O1–U1–O2: 175.2(3)°, Cs1–O2–U1 117.6(3)°; selected ring parameters (Å): Cs1–Cs1′′′ 13.4807(9), U1–U1′′′ 16.518(1); cavity size: 648 Å3.
In contrast to the lighter homologues of the alkali metal uranyl(v) complexes B (Li), C (Na), D (K) and 8 (Rb), which are all monomeric with a triply solvated alkali metal, complex 9 crystallises as a ring of six uranyl Pacman units, linked by the Cs+ cation through metalation to the exogenous uranyl oxygen of one uranyl to the endogenous oxygen of an adjacent molecule. Interestingly, storage of pyridine solutions of 8 for a period of 21 months also yields crystals of the hexanuclear RbI–uranyl(v) ring form 8b, presumably arising from a loss of coordinating donor solvent to form a larger number of interactions with the pyrrolide-donor faces of an adjacent Pacman ligand. Unfortunately, the crystallographic data for the Rb6 wheel are poor, so while connectivity drawings (see ESI, Fig. S4†) confirm it is isostructural with 9, only the gross structural details of 9 are discussed here. It is interesting to note that this series of uranyl(v) complexes D (K), 8 (Rb) and 9 (Cs) shows an inversion of the U–Oexo and U–Oendo bond lengths, as in these three compounds a longer endogenous and a shorter exogenous uranyl oxygen bond is observed.
The uranyl oxo distances U1–O1 and U1–O2 of 1.857(6) Å and 1.833(6) Å, respectively, in 9 are similar to those for the mono-metalated alkali metal uranyl(v) complexes B–D and are consistent with the uranyl(v) oxidation state. The Cs1–O2 distance is long at 2.976(9) Å due to the large ionic radius of the Cs+ cation (202 pm).58 The coordination of the Cs+ to the adjacent uranyl is slightly longer with Cs1–O1′ 3.440(8) Å. The uranyl bond angle O1–U1–O2 is linear with 175.2(3)°, whilst the Cs1–O2–U1 bond angle is bent at 117.6(3)°, as is the angle to the adjacent uranyl Cs1–O1′–U1′ with 104.0(3)°. The coordination motif of 9 results in a hexagonal assembly for the [Cs(OUO)]6 moiety and resembles the shape of a crown, similar to 18-crown-6 (18-c-6).62,63 Along the linear uranyl moiety the torsion angle between two adjacent Cs atoms Cs1′–O1(U1)O2–Cs1 is 68.4(3)°, which is close to the torsion angles for the three individual –O–CH2–CH2–O– moieties in 18-c-6 at 67.6°, 75.4° and 79.7°. A similar comparison can be made when comparing the torsion angles along U1–O2–Cs1–O1′ (173.8(3)°) and U1–O1–Cs′–O2′ (166.7(3)°), which resemble the –CH2–CH2–O–CH2– torsion angles in 18-c-6 (155.2° and 165.8°, respectively).63 The cavity of this ‘uranium crown’ complex is large and empty, with a diametric Cs1–Cs1′′′ separation of 13.4807(9) Å (=1.35 nm) and a U1–U1′′′ separation of 16.518(1) Å (=1.65 nm); a pyridine solvent of crystallisation is located outside the ring. This cavity has a volume of 648 Å3,64 significantly larger than large organic molecules such as C60 (diameter 7 Å).65,66
A characteristic feature of the alkali-metal – uranyl(v) series of complexes is the chemical shift of the N–H resonances of the macrocycle in C5D5N (Table 1).
Table 1. Pyrrole N–H 1H NMR shifts and bond distances of the U–Oexo and Oendo–NH bonds in uranyl(v) complexes B–D,178 and 9.
| Entry | Li–O–UV O B | Na–O–UV O C | K–O–UV O D | Rb–O–UV O 8 | Cs–O–UV O 9 |
| δ H (N–H, ppm) | 85.48 | 91.11 | 93.06 | 92.37 | 92.21 |
| d U–Oexo (Å) | 1.884(7) | 1.856(7) | 1.837(2) | 1.837(3) | 1.833(6) |
| d Oendo–NH (Å) | 3.09(1), 3.10(1) | 3.010(9), 2.988(8) | 2.898(4), 2.932(4) | 2.940(5), 2.906(5) | 3.01(1), 2.92(1) |
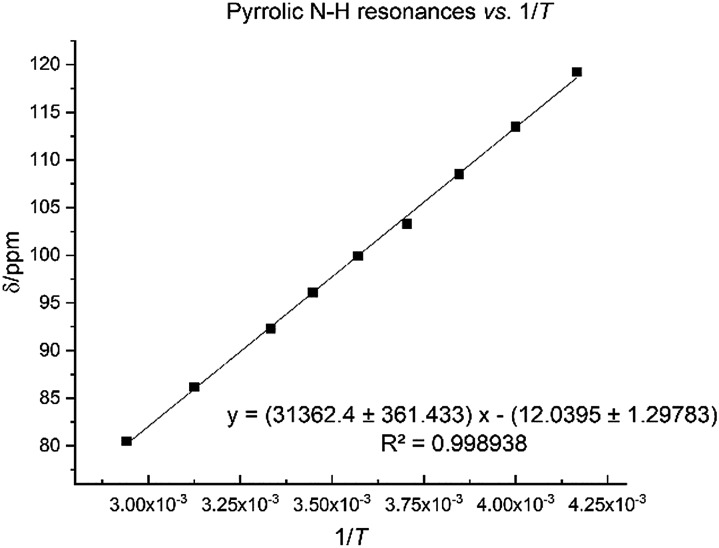
The N–H protons of the macrocycle are shifted to increasingly higher frequencies for the first three members of the series, Li, Na and K, but there are no clear trend for the heavier congeners. However, the U–Oexo bond distance shortens with the increasing ionic radius of the alkali metal (Table 1); variable temperature 1H NMR for compound 8 shows that the hydrogen-bonded NH protons are shifted to a very high frequency at 240 K (119.2 ppm), with a linear decrease to 80.5 ppm at 340 K (Fig. 7).
Fig. 7. Temperature dependence of pyrrole 1H NMR spectroscopic resonance in 8 between 240 K and 340 K.
Computational analysis
The computational study of reduced uranium complexes is difficult, not only because of the large size of the calculation for an open-shell actinide but also because of spin–orbit and multiplet effects arising from the unpaired f electrons that result in a large number of close-lying states.19 However, a single-configurational method is still valid for the specific structural, energetic and topological questions addressed here.67
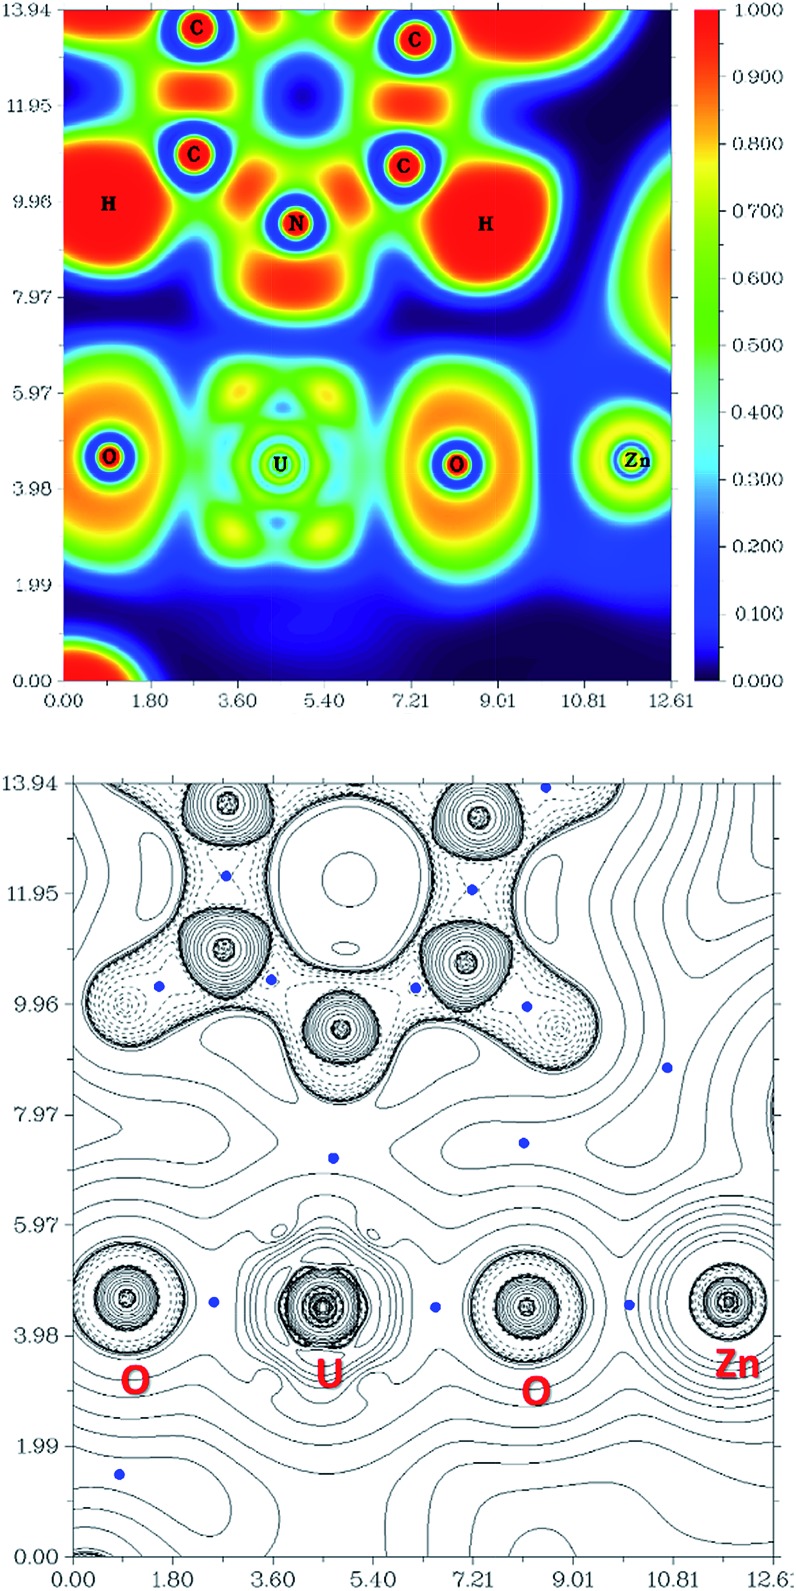
Gas phase geometry optimisations of the complexes described experimentally yield calculated structures in which the bond metrics are in good agreement with the experimental X-ray data in each case (Table S2†). Formal charges, spin densities, and bond orders were calculated on the basis of these gas-phase electronic structure calculations. QTAIM can be a very useful tool to evaluate, at least in a comparative manner, ionicity and covalency of bonds in f-element organometallic complexes. Further investigation using QTAIM allows the Bond Critical Points (BCPs) of the metalated uranyl to be determined, with the contour line diagrams of the Laplacian of the electron density (∇2ρ) (Fig. 9, bottom) giving more general information about the chemical bonds. One should however bear in mind that QTAIM can fail by placing the BCP in the wrong position.68 As the ∇2ρ diagram shows, all BCPs are in reasonable positions and the values of the Laplacian in the areas between U, O, and Zn atoms are all positive. The positive ∇2ρ values of the BCPs in the QTAIM indicate that all of the M–O bonds are largely ionic. However, this criterion is not sufficient for heavy atoms69,70 and multiple bonds.71 In this case, the Laplacian of ρ is not a good indicator for the covalent or ionic character of U–O bonds. However, we can conclude from the positive ∇2ρ values that the M–O bonds are very ionic.
Fig. 9. Electron Localisation Function (ELF) diagram (top) and ∇2ρ contour line diagram (bottom) of the (py)OUO–Zn fragment in complex 6 (ZnCl) (length unit: Bohr). The value of ELF is given by the colour scale. For the ∇2ρ diagram, blue points are BCPs, solid lines and dotted lines represent positive and negative values of the Laplacian of the electron density.
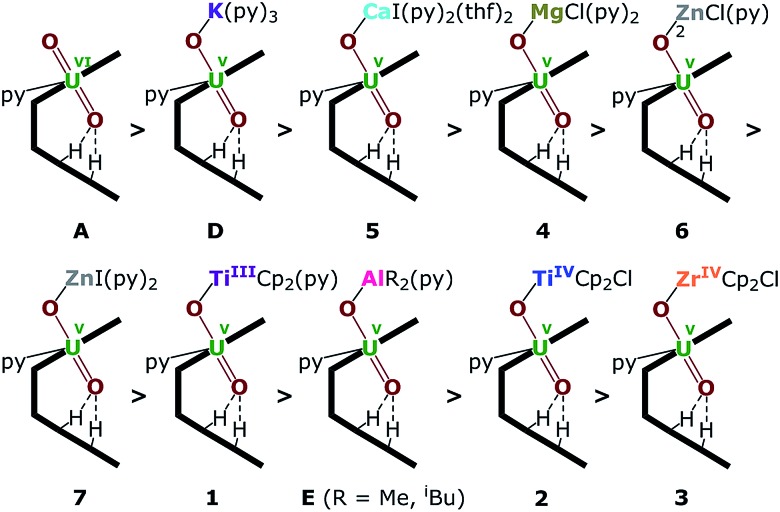
The energy density (H) suggests that U–O is a covalent bond (H < 0) and M–O is an ionic bond (H > 0). The degree of covalency of the U–O bonds can be characterised by the electron density (ρ) and energy density (H) at the BCP. Higher (absolute) values of ρ and H indicate greater covalency. The absolute values of ρ and H in the Oexo–M bond for M = Mg, Ca, ZnCl and ZnI are collated in Tables 2 and S2.† These, and the computed values for the other complexes (see ESI†) suggest a tendency of decreasing strength of the U–Oexo bonding in the order A > D (K) > 5 (Ca) > 4 (Mg) > 6 (ZnCl) > 7 (ZnI) > 1 (TiIII) > E (Al) > 2 (TiIV) > 3 (Zr) (Fig. 8).
Table 2. Computed properties of selected bonds in compounds 4–7.
| Metric | 4 (Mg) | 5 (Ca) | 6 (ZnCl) | 7 (ZnI) |
| U–Oexo bond length (Å) | 1.941 | 1.925 | 1.944 | 1.949 |
| Oexo–M bond length (Å) | 1.940 | 2.324 | 1.918 | 1.924 |
| U–Oexo bond order | 1.642 | 1.750 | 1.704 | 1.699 |
| Oexo–M bond order | 0.643 | 0.540 | 0.599 | 0.599 |
| ρ of U–Oexo bond | 0.190 | 0.201 | 0.183 | 0.180 |
| ρ of Oexo–M bond | 0.050 | 0.036 | 0.090 | 0.089 |
| Hirshfeld charge on U | 0.450 | 0.455 | 0.439 | 0.438 |
| EDA of U–O bond, eV | 4 (Mg) | 5 (Ca) | 6 (ZnCl) | 7 (ZnI) |
| Orbital interaction | –11.87 | –13.56 | –11.50 | –11.30 |
| Electrostatic interaction | –12.08 | –13.23 | –11.43 | –11.29 |
Fig. 8. Uranyl Pacman complexes in order of decreasing bond strength of the exogenous uranyl–oxygen bond.
Likewise, the smallest bond order for the U–Oexo bond is calculated for 3 (Zr) at 1.382, and is largest for D (K) with a value of 2.224 (Table S4†). The Mayer and Mulliken bond order analyses (Tables 2 and S4†) further confirm the reduction in the uranyl UO bond order for all the uranyl(v) complexes compared to uranyl(vi) A, while the calculated charges and spin densities (Table S5†) further support the correct assignment of the uranyl(v) oxidation state.
The Electron Localisation Function (ELF)72–74 is a complementary tool that indicates the ionic character of the bonds in 3D space and demonstrates clearly that there is almost no electron density between the O and Zn atoms as well as O and U atoms (Fig. 9, top). For comparison, a very high electron density is visible between the C and N atoms in the coordinated pyridine, which shows typical dative covalent bonds. The QTAIM and ELF diagrams do not show electron density between U–O because uranium is very heavy and has a large radius; as such the bonding area will cover a large region and is “diluted”. However, these maps show very clear ionic character for the M–O bond. The electron density difference graphs (for example, Fig. S12†) show clear electron density increases during formation of the U–O bonds. Furthermore, the electron density difference graph indicates that the formation of the Ca–O bond greatly weakens the electron density between U–Oexo which reduces the overlap – or, in other words, the covalency. This supports the above conclusions drawn from electron density (ρ) and energy density (H) at the BCP.
The formal charges of the uranium atom in 1 to 7 were calculated using different approaches but show an opposite trend (Table S1†), and agree well with HR-XANES data (see below). Usually, higher calculated partial atomic charge on the U atom are indicative of an increased ionic contribution to the bonding. The highest value is seen for the Ca complex 5, with lower values for the alkaline earth compound 4 (Mg) and for the zinc compounds 6 (ZnCl) and 7 (ZnI). The bond lengths of U–Oexo suggest stronger bonds in the Ca (5) and Mg (4) adducts than in the Zn adducts (6 and 7). The spin densities show that the uranium has the same oxidation state in all of these compounds. Thus the ionic interactions become weaker when the bonds becomes longer, which are dominated by the reduced U–Oexo covalency. The QTAIM values show that the covalent contribution to the U–Oexo bonding is also greater in the Ae than the Zn complexes. However, the QTAIM values show there is more covalent character in the Oexo–Zn bonding than the Oexo–Ae bonding.
Additionally, the density functional theory (DFT) calculated interatomic interaction energies in the UV–Oexo bonds have been analysed using EDA,75–77 in which the orbital interaction terms can be interpreted as covalent contributions. Both EDA (Table 2, see computational procedures in ESI for more details†) and orbital mixing (Table S6†) directly support the QTAIM results. This indicates that ionic character and covalent contributions are correlated: stronger ionic character shortens bond lengths leading to improved orbital overlap, and vice versa. Although the absolute values of the ionic interactions show the same tendency as the covalency, the orbital contribution of U–O bonding (Tables S5 and S6†) suggest that the total polarization increases as follows: 5 (Ca) ≤ 4 (Mg) < 6 (ZnCl) = 7 (ZnI), which means the overall covalency follows the trend 5 (Ca) ≥ 4 (Mg) > 6 (ZnCl) = 7 (ZnI).
The computational methods also allow a study of the nature of the hydrogen bonding between the endo-uranyl oxo atom and the two lower pocket pyrrole N–H atoms, and whether this is affected by the increased oxo basicity of the uranyl(v) (Table 1).78,79 Hydrogen bonds can be categorised as “strong” or “strongly covalent” (D···A 2.2–2.5 Å), “moderate” or “mostly electrostatic” (D···A 2.5–3.2 Å) and “weak” or electrostatic/dispersion (D···A 3.2–4.0 Å)28 The properties of the BCPs of these bonds for both the uranyl(vi) complex A and the uranyl(v) complexes D, and 1 to 7 were determined in the gas-phase using QTAIM (Table S7 and Fig. S9†).
The presence of hydrogen bonding for the pyrrole N–H···O1, as well as of the methyl C–H···O1, is supported by the values of the electron density ρ and the Laplacian ∇2ρ which lie within characteristic ranges;80 the electron density of N–H···O1 is about one order of magnitude smaller than that seen for a covalent bond. While both the N–H···O1 and C–H···O1 interactions can be classified as hydrogen bonds, no significant difference is seen between uranyl(vi) and uranyl(v) complexes so their relative strength cannot be determined computationally.81 However, according to the computed and experimental bond distances, the hydrogen bonds of the pyrrole rings to the uranyl oxygen (N–H···O1) can be classified as moderate strength hydrogen bonds. The interaction between the methyl hydrogen atoms (C–H···O1) is classified as weak. Thus, both hydrogen bonds “protect” the endogenous uranyl oxygen and presumably attenuate any uranyl oxo-functionalisation in the lower macrocyclic pocket.
Uranium M4 edge HR-XANES and 3d4f RIXS
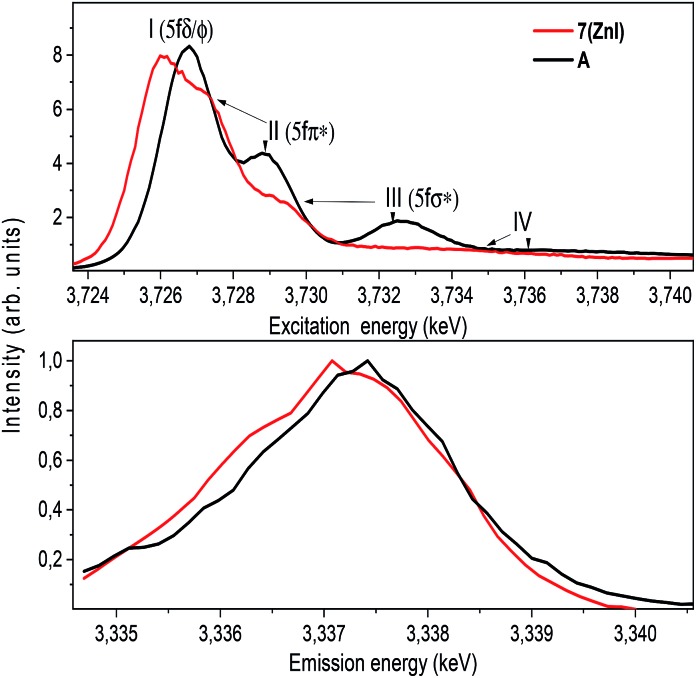
The High Energy Resolution X-ray Absorption Near Edge Structure (HR-XANES) measurements can provide insights into the covalency of the uranyl bond driven by orbital overlap. Resonant Inelastic X-ray Scattering (RIXS) measurements can show the level of localisation of the 5f orbitals, which can be potentially related to the energy-degeneracy driven covalency of the actinide–oxygen bond.82 Both methods directly probe the An 5f valence unoccupied orbitals and have been used to study the differences between the uranyl(v) compound 7 (ZnI) and the parent uranyl(vi) complex A.
The U M4 edge HR-XANES and 3d4f RIXS spectra of the UV compound 7 (ZnI) and the UVI starting material A were collected at the INE- or CAT-ACT-Beamlines at the Karlsruhe Research Accelerator (KARA, previous ANKA), Germany, using a multi-analyser Johann type X-ray emission spectrometer (ESI 2†).83,84 A 5 mg sample of each compound was mixed with 15 mg BN and pressed into a 7 mm diameter pellet, which was wrapped in Kapton film, and then transferred to the inert gas cell for measurements under a He flush. Also, compounds dissolved in dry pyridine were studied and similar results were obtained. No radiation damage of the samples was detected during the experiments. The spectra of 4 (Mg), 5 (Ca) and 6 (ZnCl) are shown in (Fig. S7†), and are visually less clear than those of 7.
The U M4 edge HR-XANES spectrum (Fig. 10) describes the U 5f unoccupied density of states in the presence of a 3d3/2 core-hole. Due to the dipole selection rule Δl = ±1, Δs = 0, absorption is seen when electrons are excited from the 3d3/2 orbitals of U to lowest unoccupied valence orbitals that have substantial U f contributions. The energy position of the absorption edge is therefore sensitive to the level of screening of the 3d3/2 core-hole by the electron density in the vicinity of the uranium atom. The linear structure of uranyl(vi) leads to the U valence orbitals being most usefully described in terms of their δ, φ, π* or σ* character with respect to rotation about the U–O z-axis. The δ and φ are the lowest unoccupied orbitals, and are essentially non-bonding orbitals, whereas the π*, σ* are anti-bonding orbitals with predominant U 5f character (cf. Fig. S9†). The U M4 edge HR-XANES spectra of the uranyl(vi) complex A and the uranyl(v) complex 7 (ZnI) were recorded and the peaks marked with I, II, III were assigned previously to electronic transitions to the 5fδ/φ, 5fπ* and 5fσ* orbitals, respectively, for uranyl(vi) by performing Scalar Relativistic Zeroth-Order Regular Approximation (ZORA) Density Functional Theory (DFT) calculations employing the BP86 functional.31 This assignment of the spectral peaks is valid also for the uranyl(v) and uranyl(vi) complexes investigated here (Fig. S9†). DFT ground-state calculations were also undertaken to determine which atomic orbital and unoccupied molecular orbitals contain appreciable U 5f character for A and 7 (ZnI) using the Priroda code,85 (Fig. S9†). The Mulliken and Ros-Schuit (SCPA) orbital population analyses report differences of less than 5% for the low energy orbitals, which increases for orbitals with energies higher than –1 eV. Nevertheless, the results are consistent.
Fig. 10. Uranium M4 edge HR-XANES (top) and resonant X-ray emission (RXES) (bottom) spectra of complexes 7 (ZnI) and A. The RXES are measured at excitation energies corresponding to the maximum intensity of the first peak (I) of the respective HR-XANES spectrum.
The absorption edge of the spectrum of 7 (ZnI) is shifted by approximately 0.6 ± 0.05 eV to lower energies compared to that of A. The energy positions of the absorption edge were determined to be equal to the energy positions of the first maxima of the first derivative spectra (cf. Fig. S5†). As mentioned above, these variations in the screening of the 3d3/2 core-hole imply lower effective charge on the UV atom for the zinc compound 7 (ZnI) compared to the UVI atom in A.
The HR-XANES spectra provide insights into the covalency of the uranyl bond driven by orbital overlap; the classical definition of this bond covalency is the accumulation of charge in the midpoint of the bond.35 The strong filled–filled interaction due to the large overlap of O 2p with U 6p orbitals, which are hybridised with U 5f in the σ bonding orbital, leads to a vertical shift of the σ* orbital compared to the δ/φ non-bonding orbitals.86 The effect has been described as “pushing from below”.2,86–91 The energy shift of the II (π*) and III peaks (σ*) with respect to the I (δ/φ) peak is much smaller for 7 (ZnI) (I–II ≈ 1.4 eV, I–III ≈ 3.6 eV) compared to A (I–II ≈ 2.2 eV, II–III ≈ 5.7 eV) (cf.Fig. 10 and Table S3†), which indicates a weaker filled–filled interaction and therefore a reduction of the U–O bond covalency for 7 (ZnI).34,37,39 Based on all experimental and theoretical evidence we conclude that there is an orbital overlap driven reduction of U–Oexo covalency for 7 (ZnI) compared to A.
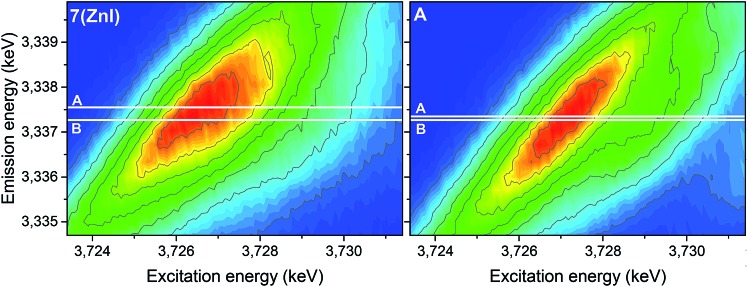
The analyses of the U 3d4f RIXS maps for 7 (ZnI) and A provide additional insights (Fig. 11). The RIXS maps are a two-dimensional representation of the U Mβ characteristic fluorescence intensity as a function of the incident X-ray excitation energy. When the electron is resonantly excited to the lowest unoccupied 5f orbitals, the emission signal is denoted as resonant emission, i.e. the electron is retained in the molecule. This contrasts to a normal emission in which the atom relaxes after the electron is excited to the continuum, i.e. the U atom is ionised.
Fig. 11. U 3d4f RIXS spectra of complexes 7 (ZnI) and A. Lines A and B mark the energy positions of the maximum intensity of the resonant and normal emission, respectively.
The energy shift between the resonant and normal emission maxima is approximately 0.28 ± 0.02 eV for 7, and 0.08 ± 0.02 eV for A (energy shift between lines A and B in Fig. 11). As previously illustrated,35 this energy shift can be used as a relative measure of the level of localisation of the U 5f orbitals and suggests that the U 5f orbitals are more contracted in the uranyl(v) compound 7 compared to the uranyl(vi) compound A. Calculations for UV-yl and UVI-yl considering only the axial U–O bond also indicate a slight contraction of the sigma bonding orbital for uranyl(v) compared to uranyl(vi), Fig. S11.† Normally, reducing the uranyl from oxidation state VI to V leads to a greater delocalisation of the 5f orbitals.86
The RIXS results for the 5f orbitals appears to offer a new tool for estimating the energy-degeneracy driven covalency of the actinide–oxygen bond.35,86 As a consequence of the lowering in energy of the 5f orbitals to closer alignment with the oxygen AOs (atomic orbitals), the energy-degeneracy driven covalency of the U–O bond appears to have a stronger contribution for the uranyl(v) complex compared to the uranyl(vi) complex A. This notion needs to be further verified in the future by comparing experimental and computational results for suitable U systems.
Conclusions
We have reported the successful reductive metalation of uranyl(vi) with group 1, group 2, group 4, and group 12 metals and organometallic reagents to obtain exclusively mono-oxo-metallated uranyl(v) complexes.
The synthetic routes include the use of reducing organometallic reagents and an unusual combination of the group 2 and group 12 metals with their respective halide salts, and we also complete the series of group 1 – uranyl(v) complexes by direct reduction with Rh and Cs (8 and 9). The single electron reduction with a TiII synthon leads to a f1–d1 system, and the reduction using an unusual procedure involving a combination of a group 2 or 12 metal and its respective metal halide allows the straightforward synthesis of Mg, Ca, and Zn–uranyl(v) complexes 4 to 7. The hexameric ring structures formed with the strongly reducing alkali metals Rb and Cs are interesting in the context of nuclear waste behaviour as the highly radiotoxic 137Cs is generated in nuclear reactors and has a half-life of 30.1 years.92 This work shows it is possible to incorporate Cs+ cations into a uranyl framework under reducing conditions, and that strikingly different coordination modes are possible for these most polarisable group 1 cations compared with the lighter group 1 congeners. Theoretical calculations using QTAIM and other methods verify the assignment of the uranyl(v) oxidation state and help classify the strength of hydrogen bonding in the lower macrocyclic pocket as moderate, which is supported by the strong paramagnetic effect on the chemical shifts of the two pyrrolic NH hydrogens.
The covalency of the U–O bond in uranyl(v) complexes can be manipulated experimentally by varying the identity of the metal that binds to the uranyl exo-oxo group. The U M4 edge HR-XANES are used for the first time to provide insight into the covalency of the uranyl(v) bonding driven by orbital overlap. Combined with quantum chemical studies they show there is an orbital overlap driven reduction of U–O covalency for 7 (ZnI) compared to A. The parent uranyl(vi) complex A has more delocalized 5f orbitals than for the UV complex 7 as suggested by 3d4f RIXS and computations. The BCP analyses show greater electron density between the U and Oexo for Ae complexes 4/5 and more covalent O–Zn bonding for the Zn complexes 6 and 7. Thus, the Oexo–M bonds follow the opposite trend to the U–Oexo bond, and the Oexo–Zn bonds have a larger covalent contribution compared to the Mg–Oexo/Ca–Oexo bonds. The U M4 edge HR-XANES and RIXS have high potential for detailed investigations of the uranium valence orbitals with f character and their interaction with ligand valence orbitals. The results contribute fundamentally to our understanding and tailoring of the reduction mechanisms of uranyl on an electronic and structural level.
Conflicts of interest
The authors report no conflicts of interest.
Supplementary Material
Acknowledgments
The authors thank the EPSRC-UK, the University of Edinburgh, the EU Actinet-I3-AC3-JRP-02 and Talisman-JRPL-C02-07 programs, COST CM1006, NSERC, and the Institute of Advanced Study, TU Munich, for support. We acknowledge the Helmholtz Association of German Research Centers for the VH-NG-734 grant and the synchrotron light source KARA for provision of instrumentation and beamtime. J. A. H. thanks the Austrian Science Fund (FWF) for funding via Erwin Schrödinger Fellowship project J-3467. We thank Juraj Bella (Edinburgh) for help with NMR spectroscopic experiments and Dr Alessandro Prescimone for support in SQUID magnetometry.
Footnotes
†Electronic supplementary information (ESI) available: Crystallographic data, experimental and analytical details. CCDC 1883750–1883758. For ESI and crystallographic data in CIF or other electronic format see DOI: 10.1039/c8sc05717f
References
- Arnold P. L., Love J. B., Patel D. Coord. Chem. Rev. 2009;253:1973–1978. [Google Scholar]
- Denning R. G. J. Phys. Chem. A. 2007;111:4125–4143. doi: 10.1021/jp071061n. [DOI] [PubMed] [Google Scholar]
- Wander M. C. F., Shuford K. L. Geochim. Cosmochim. Acta. 2012;84:177–185. [Google Scholar]
- Steele H., Taylor R. J. Inorg. Chem. 2007;46:6311–6318. doi: 10.1021/ic070235c. [DOI] [PubMed] [Google Scholar]
- Berthet J.-C., Nierlich M., Ephritikhine M. Angew. Chem., Int. Ed. 2003;42:1952–1954. doi: 10.1002/anie.200250506. [DOI] [PubMed] [Google Scholar]
- Natrajan L., Burdet F., Pécaut J., Mazzanti M. J. Am. Chem. Soc. 2006;128:7152–7153. doi: 10.1021/ja0609809. [DOI] [PubMed] [Google Scholar]
- Arnold P. L., Hollis E., White F. J., Magnani N., Caciuffo R., Love J. B. Angew. Chem., Int. Ed. 2011;50:887–890. doi: 10.1002/anie.201005511. [DOI] [PubMed] [Google Scholar]
- Chatelain L., Mougel V., Pécaut J., Mazzanti M. Chem. Sci. 2012;3:1075. [Google Scholar]
- Brown J. L., Wu G., Hayton T. W. J. Am. Chem. Soc. 2010;132:7248–7249. doi: 10.1021/ja1013739. [DOI] [PubMed] [Google Scholar]
- Schnaars D. D., Wu G., Hayton T. W. Inorg. Chem. 2011;50:4695–4697. doi: 10.1021/ic2008649. [DOI] [PubMed] [Google Scholar]
- Arnold P. L., Jones G. M., Odoh S. O., Schreckenbach G., Magnani N., Love J. B. Nat. Chem. 2012;4:221–227. doi: 10.1038/nchem.1270. [DOI] [PubMed] [Google Scholar]
- Mougel V., Chatelain L., Pécaut J., Caciuffo R., Colineau E., Griveau J.-C., Mazzanti M. Nat. Chem. 2012;4:1011–1017. doi: 10.1038/nchem.1494. [DOI] [PubMed] [Google Scholar]
- Chatelain L., Walsh J. P. S., Pécaut J., Tuna F., Mazzanti M. Angew. Chem., Int. Ed. 2014;53:13434–13438. doi: 10.1002/anie.201407334. [DOI] [PubMed] [Google Scholar]
- Camp C., Toniolo D., Andrez J., Pécaut J., Mazzanti M. Dalton Trans. 2017;46:11145–11148. doi: 10.1039/c7dt01993a. [DOI] [PubMed] [Google Scholar]
- Chatelain L., Tuna F., Pécaut J., Mazzanti M. Dalton Trans. 2017;46:5498–5502. doi: 10.1039/c6dt04558h. [DOI] [PubMed] [Google Scholar]
- Chatelain L., Pécaut J., Tuna F., Mazzanti M. Chem.–Eur. J. 2015;21:18038–18042. doi: 10.1002/chem.201503637. [DOI] [PubMed] [Google Scholar]
- Zegke M., Nichol G. S., Arnold P. L., Love J. B. Chem. Commun. 2015;51:5876–5879. doi: 10.1039/c5cc00867k. [DOI] [PubMed] [Google Scholar]
- Arnold P. L., Pécharman A.-F., Lord R. M., Jones G. M., Hollis E., Nichol G. S., Maron L., Fang J., Davin T., Love J. B. Inorg. Chem. 2015;54:3702–3710. doi: 10.1021/acs.inorgchem.5b00420. [DOI] [PubMed] [Google Scholar]
- Arnold P. L., Hollis E., Nichol G. S., Love J. B., Griveau J.-C., Caciuffo R., Magnani N., Maron L., Castro L., Yahia A., Odoh S. O., Schreckenbach G. J. Am. Chem. Soc. 2013;135:3841–3854. doi: 10.1021/ja308993g. [DOI] [PubMed] [Google Scholar]
- Jones G. M., Arnold P. L., Love J. B. Chem.–Eur. J. 2013;19:10287–10294. doi: 10.1002/chem.201301067. [DOI] [PubMed] [Google Scholar]
- Arnold P. L., Cowie B. E., Suvova M., Zegke M., Magnani N., Colineau E., Griveau J.-C., Caciuffo R., Love J. B. Angew. Chem., Int. Ed. 2017;56:10775–10779. doi: 10.1002/anie.201705197. [DOI] [PMC free article] [PubMed] [Google Scholar]
- Hayton T. W., Wu G. Inorg. Chem. 2009;48:3065–3072. doi: 10.1021/ic802360y. [DOI] [PubMed] [Google Scholar]
- Arnold P. L., Patel D., Wilson C., Love J. B. Nature. 2008;451:315–317. doi: 10.1038/nature06467. [DOI] [PubMed] [Google Scholar]
- Pedrick E. A., Wu G., Hayton T. W. Inorg. Chem. 2014;53:12237–12239. doi: 10.1021/ic502267t. [DOI] [PubMed] [Google Scholar]
- Arnold P. L., Pécharman A.-F., Hollis E., Yahia A., Maron L., Parsons S., Love J. B. Nat. Chem. 2010;2:1056–1061. doi: 10.1038/nchem.904. [DOI] [PubMed] [Google Scholar]
- Cowie B. E., Nichol G. S., Love J. B., Arnold P. L. Chem. Commun. 2018;54:3839–3842. doi: 10.1039/c8cc00341f. [DOI] [PMC free article] [PubMed] [Google Scholar]
- Bell N. L., Shaw B., Arnold P. L., Love J. B. J. Am. Chem. Soc. 2018;140:3378–3384. doi: 10.1021/jacs.7b13474. [DOI] [PubMed] [Google Scholar]
- Vitova T., Kvashnina K. O., Nocton G., Sukharina G., Denecke M. A., Butorin S. M., Mazzanti M., Caciuffo R., Soldatov A., Behrends T., Geckeis H. Phys. Rev. B. 2010;82:5118. [Google Scholar]
- Kvashina K. O., Butorin S. M., Martin P., Glatzel P. Phys. Rev. Lett. 2013;111:1–5. doi: 10.1103/PhysRevLett.111.253002. [DOI] [PubMed] [Google Scholar]
- Vitova T., Denecke M. A., Göttlicher J., Jorissen K., Kas J. J., Kvashnina K., Prüßmann T., Rehr J. J., Rothe J. J. Phys.: Conf. Ser. 2013;430:012117. [Google Scholar]
- Vitova T., Green J. C., Denning R. G., Löble M., Kvashnina K., Kas J. J., Jorissen K., Rehr J. J., Malcherek T., Denecke M. A. Inorg. Chem. 2015;54:174–182. doi: 10.1021/ic5020016. [DOI] [PubMed] [Google Scholar]
- Podkovyrna Y., Pidchenko I., Pruessmann T., Bahl S., Göttlicher J., Soldatov A. and Vitova T., 16th International Conference on X-ray Absorption Fine Structure Karlsruhe, 2015. [Google Scholar]
- Pidchenko I., Heberling F., Kvashnina K., Finck N., Schild D., Bohnert E., Schäfer T., Rothe J., Geckeis H., Vitova T. J. Phys.: Conf. Ser. 2016;712:012086. [Google Scholar]
- Bahl S., Peuget S., Pidchenko I., Pruessmann T., Rothe J., Dardenne K., Delrieu J., Fellhauer D., Jégou C., Geckeis H., Vitova T. Inorg. Chem. 2017;56:13982–13990. doi: 10.1021/acs.inorgchem.7b02118. [DOI] [PubMed] [Google Scholar]
- Vitova T., Pidchenko I., Fellhauer D., Bagus P. S., Joly Y., Pruessmann T., Bahl S., Gonzalez-Robles E., Rothe J., Altmaier M., Denecke M. A., Geckeis H. Nat. Commun. 2017;8:16053. doi: 10.1038/ncomms16053. [DOI] [PMC free article] [PubMed] [Google Scholar]
- Pidchenko I., Kvashnina K. O., Yokosawa T., Finck N., Bahl S., Schild D., Polly R., Bohnert E., Rossberg A., Göttlicher J., Dardenne K., Rothe J., Schäfer T., Geckeis H., Vitova T. Environ. Sci. Technol. 2017;51:2217–2225. doi: 10.1021/acs.est.6b04035. [DOI] [PubMed] [Google Scholar]
- Vitova T., Pidchenko I., Biswas S., Beridze G., Dunne P. W., Schild D., Wang Z., Kowalski P. M., Baker R. J. Inorg. Chem. 2018;57:1735–1743. doi: 10.1021/acs.inorgchem.7b02326. [DOI] [PubMed] [Google Scholar]
- Popa K., Prieur D., Manara D., Naji M., Vigier J.-F., Martin P. M., Dieste Blanco O., Scheinost A. C., Prüβmann T., Vitova T., Raison P. E., Somers J., Konings R. J. M. Dalton Trans. 2016;45:7847–7855. doi: 10.1039/c6dt00735j. [DOI] [PubMed] [Google Scholar]
- Bader R. F. W., Atoms in Molecules: A Quantum Theory, Oxford University Press, New York, 1990. [Google Scholar]
- Bader R. F. J. Phys. Chem. A. 1998;102:7314–7323. [Google Scholar]
- Arnold P. L., Farnaby J. H., White R. C., Kaltsoyannis N., Gardiner M. G., Love J. B. Chem. Sci. 2014;5:756–765. [Google Scholar]
- Arnold P. L., Turner Z. R., Kaltsoyannis N., Pelekanaki P., Bellabarba R. M., Tooze R. P. Chem.–Eur. J. 2010;16:9623–9629. doi: 10.1002/chem.201001471. [DOI] [PubMed] [Google Scholar]
- King D. M., Tuna F., McInnes E. J. L., McMaster J., Lewis W., Blake A. J., Liddle S. T. Nat. Chem. 2013;5:482–488. doi: 10.1038/nchem.1642. [DOI] [PubMed] [Google Scholar]
- Tassell M. J., Kaltsoyannis N. Dalton Trans. 2010;39:6719–6725. doi: 10.1039/c000704h. [DOI] [PubMed] [Google Scholar]
- Kirker I., Kaltsoyannis N. Dalton Trans. 2011;40:124–131. doi: 10.1039/c0dt01018a. [DOI] [PubMed] [Google Scholar]
- Saleh L. M. A., Birjkumar K. H., Protchenko A. V., Schwarz A. D., Aldridge S., Jones C., Kaltsoyannis N., Mountford P. J. Am. Chem. Soc. 2011;133:3836–3839. doi: 10.1021/ja2007092. [DOI] [PubMed] [Google Scholar]
- Brown J. L., Fortier S., Wu G., Kaltsoyannis N., Hayton T. W. J. Am. Chem. Soc. 2013;135:5352–5355. doi: 10.1021/ja402068j. [DOI] [PubMed] [Google Scholar]
- Jones M. B., Gaunt A. J., Gordon J. C., Kaltsoyannis N., Neu M. P., Scott B. L. Chem. Sci. 2013;4:1189. [Google Scholar]
- Mountain A. R. E., Kaltsoyannis N. Dalton Trans. 2013;42:13477. doi: 10.1039/c3dt51337h. [DOI] [PubMed] [Google Scholar]
- Pankhurst J. R., Bell N. L., Zegke M., Platts L. N., Lamfsus C. A., Maron L., Natrajan L. S., Sproules S., Arnold P. L., Love J. B. Chem. Sci. 2017;8:108–116. doi: 10.1039/c6sc02912d. [DOI] [PMC free article] [PubMed] [Google Scholar]
- Ren Q., Chen Z., Ren J., Wei H., Feng W., Zhang L. J. Phys. Chem. A. 2002;106:6161–6166. [Google Scholar]
- Arnold P. L., Dutkiewicz M. S., Zegke M., Walter O., Apostolidis C., Hollis E., Pécharman A.-F., Magnani N., Griveau J.-C., Colineau E., Caciuffo R., Zhang X., Schreckenbach G., Love J. B. Angew. Chem., Int. Ed. 2016;55:12797–12801. doi: 10.1002/anie.201607022. [DOI] [PubMed] [Google Scholar]
- Lide D. R., Baysinger G., Berger L. I., Goldberg R. N., Kehiaian H. V., Kuchitsu K., Rosenblatt G., Roth D. L. and Zwillinger D., CRC Handbook of Chemistry and Physics, Internet Version 2005, Boca Raton, CRC Press. [Google Scholar]
- Enemærke R. J., Larsen J., Skrydstrup T., Daasbjerg K. J. Am. Chem. Soc. 2004;126:7853–7864. doi: 10.1021/ja0491230. [DOI] [PubMed] [Google Scholar]
- Enemærke R. J., Larsen J., Skrydstrup T., Daasbjerg K. Organometallics. 2004;23:1866–1874. [Google Scholar]
- Barinova A. V., Rastsvetaeva R. K., Sidorenko G. A., Pushcharovsky D. Y. Dokl. Chem. 2001;378:122–124. [Google Scholar]
- Barinova A. V., Rastsvetaeva R. K., Sidorenko G. A., Verin I. A. Crystallogr. Rep. 2003;48:12–15. [Google Scholar]
- Shannon R. D. Acta Crystallogr., Sect. A: Cryst. Phys., Diffr., Theor. Gen. Crystallogr. 1976;32:751–767. [Google Scholar]
- Krivovichev S. V., Kahlenberg V. Z. Anorg. Allg. Chem. 2005;631:739–744. [Google Scholar]
- Krivovichev S. V., Burns P. C. J. Solid State Chem. 2002;168:245–258. [Google Scholar]
- Wang S., Alekseev E. V., Stritzinger J. T., Depmeier W., Albrecht-Schmitt T. E. Inorg. Chem. 2010;49:6690–6696. doi: 10.1021/ic100728s. [DOI] [PubMed] [Google Scholar]
- Pedersen C. J. J. Am. Chem. Soc. 1967;89:7017–7036. [Google Scholar]
- Dunitz J. D., Seiler P. Acta Crystallogr., Sect. B: Struct. Crystallogr. Cryst. Chem. 1974;30:2739–2741. [Google Scholar]
- Lehn J.-M. Angew. Chem., Int. Ed. 1988;27:89–112. [Google Scholar]
- Kroto H. W., Heath J. R., O'Brien S. C., Curl R. F., Smalley R. E. Nature. 1985;318:162–163. [Google Scholar]
- Unruh D. K., Gojdas K., Libo A., Forbes T. Z. J. Am. Chem. Soc. 2013;135:7398–7401. doi: 10.1021/ja400303f. [DOI] [PubMed] [Google Scholar]
- Shamov G. A., Schreckenbach G. J. Phys. Chem. A. 2006;110:12072–12072. doi: 10.1021/jp063060l. [DOI] [PubMed] [Google Scholar]
- Cremer D., Kraka E. Angew. Chem., Int. Ed. Engl. 1984;23:627–628. [Google Scholar]
- Farrugia L. J., Senn H. M. J. Phys. Chem. A. 2010;114:13418–13433. doi: 10.1021/jp1098624. [DOI] [PubMed] [Google Scholar]
- Du J., Sun X., Jiang G. Int. J. Mol. Sci. 2016;17:414. doi: 10.3390/ijms17040414. [DOI] [PMC free article] [PubMed] [Google Scholar]
- Vallet V., Wahlgren U., Grenthe I. J. Phys. Chem. A. 2012;116:12373–12380. doi: 10.1021/jp3091123. [DOI] [PubMed] [Google Scholar]
- Becke A. D., Edgecombe K. E. J. Chem. Phys. 1990;92:5397. [Google Scholar]
- Savin A., Jepsen O., Flad J., Krogh Andersen O., Preuss H., von Schnering H. G. Angew. Chem., Int. Ed. Engl. 1992;31:187–188. [Google Scholar]
- Savin A. J. Mol. Struct.: THEOCHEM. 2005;727:127–131. [Google Scholar]
- Morokuma K. J. Chem. Phys. 1971;55:1236. [Google Scholar]
- Kitaura K., Morokuma K. Int. J. Quantum Chem. 1976;10:325–340. [Google Scholar]
- Ziegler T., Rauk A. Theor. Chim. Acta. 1977;46:1–10. [Google Scholar]
- Vallet V., Privalov T., Wahlgren U., Grenthe I. J. Am. Chem. Soc. 2004;126:7766–7767. doi: 10.1021/ja0483544. [DOI] [PubMed] [Google Scholar]
- Steiner T. Angew. Chem., Int. Ed. 2002;41:48–76. [Google Scholar]
- Popelier P. L. A. J. Phys. Chem. A. 1998;102:1873–1878. [Google Scholar]
- Koch U., Popelier P. L. A. J. Phys. Chem. 1995;99:9747–9754. [Google Scholar]
- Minasian S. G., Keith J. M., Batista E. R., Boland K. S., Clark D. L., Conradson S. D., Kozimor S. A., Martin R. L., Schwarz D. E., Shuh D. K., Wagner G. L., Wilkerson M. P., Wolfsberg L. E., Yang P. J. Am. Chem. Soc. 2012;134:5586–5597. doi: 10.1021/ja2105015. [DOI] [PubMed] [Google Scholar]
- Zimina A., Dardenne K., Denecke M. A., Doronkin D. E., Huttel E., Lichtenberg H., Mangold S., Pruessmann T., Rothe J., Spangenberg T., Steininger R., Vitova T., Geckeis H., Grunwaldt J.-D. Rev. Sci. Instrum. 2017;88:113113. doi: 10.1063/1.4999928. [DOI] [PubMed] [Google Scholar]
- Rothe J., Butorin S., Dardenne K., Denecke M. A., Kienzler B., Löble M., Metz V., Seibert A., Steppert M., Vitova T., Walther C., Geckeis H. Rev. Sci. Instrum. 2012;83:043105. doi: 10.1063/1.3700813. [DOI] [PubMed] [Google Scholar]
- Laikov D. N., Ustynyuk Y. A. Russian Chemical Bulletin, International Edition. 2005;54:820–826. [Google Scholar]
- Neidig M. L., Clark D. L., Martin R. L. Coord. Chem. Rev. 2013;257:394–406. [Google Scholar]
- Dyall K. G. Mol. Phys. 1999;96:511–518. [Google Scholar]
- Pepper M., Bursten B. E. Chem. Rev. 1991;91:719–741. [Google Scholar]
- Tatsumi K., Hoffmann R. Inorg. Chem. 1980;19:2656–2658. [Google Scholar]
- Kaltsoyannis N. Inorg. Chem. 2000;39:6009–6017. doi: 10.1021/ic000891b. [DOI] [PubMed] [Google Scholar]
- Kaltsoyannis N. Dalton Trans. 2016;45:3158–3162. doi: 10.1039/c5dt04317d. [DOI] [PubMed] [Google Scholar]
- Unterweger M. P. Appl. Radiat. Isot. 2002;56:125–130. doi: 10.1016/s0969-8043(01)00177-4. [DOI] [PubMed] [Google Scholar]
Associated Data
This section collects any data citations, data availability statements, or supplementary materials included in this article.


