Abstract
Black rockfish (Sebastes schlegelii) is an economically important viviparous marine teleost in Japan, Korea, and China. It is characterized by internal fertilization, long-term sperm storage in the female ovary, and a high abortion rate. For better understanding the mechanism of fertilization and gestation, it is essential to establish a reference genome for viviparous teleosts. Herein, we used a combination of Pacific Biosciences sequel, Illumina sequencing platforms, 10× Genomics, and Hi-C technology to obtain a genome assembly size of 848.31 Mb comprising 24 chromosomes, and contig and scaffold N50 lengths of 2.96 and 35.63 Mb, respectively. We predicted 39.98% repetitive elements, and 26,979 protein-coding genes. S. schlegelii diverged from Gasterosteus aculeatus ∼32.1-56.8 million years ago. Furthermore, sperm remained viable within the ovary for up to 6 months. The glucose transporter SLC2 showed significantly positive genomic selection, and carbohydrate metabolism-related KEGG pathways were significantly up-regulated in ovaries after copulation. In vitro suppression of glycolysis with sodium iodoacetate reduced sperm longevity significantly. The results indicated the importance of carbohydrates in maintaining sperm survivability. Decoding the S. schlegelii genome not only provides new insights into sperm storage; additionally, it is highly valuable for marine researchers and reproduction biologists.
Keywords: Sebastes schlegelii, viviparous, PacBio sequencing, Hi-C genome assemble, sperm storage
1. Introduction
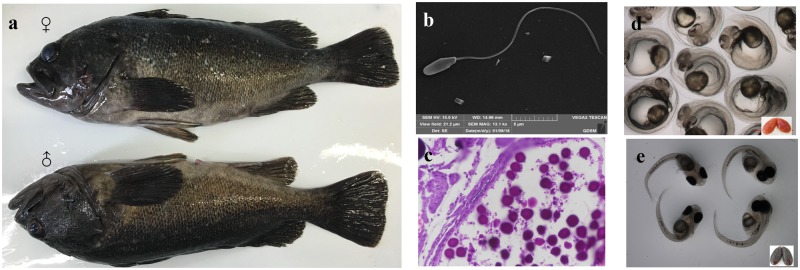
Black rockfish (Sebastes schlegelii Hilgendorf) is an economically important viviparous marine teleost species of the Sebastidae family which inhabits the seas of Japan, Korea, and China.1 However, in northern China, high rates of abortion during the gestation period cause substantial economic losses. Black rockfish copulates from November through December via specialized urogenital papilla. During the post-copulatory period, sperm is stored within the female ovary, in which survivability and viability are maintained for up to 6 months.2 The species is characterized by internal fertilization, which in China occurs during the period from April to May of the following year. Fertilization and embryo hatching occur internally within the female ovary.3,4 Thus, black rockfish is considered an attractive viviparous fish model for studies on reproductive specialization (Fig. 1), particularly, studies focusing on the mechanisms underlying reproductive strategy, sperm storage, sperm competition, and sexual selection, and studies attempting to overcome the problems associated with abortion during the gestational stage. Unfortunately, to date, information regarding the genetic basis of vivipary in marine teleosts is scarce at best.
Figure 1.
Photograph of the reproductive characteristics of the viviparous marine teleost Sebastes schlegelii (black rockfish). (a) Photograph of black rockfish, (b) the sperm ultrastructure, (c) sperm in the female ovary, (d) embryo in the female ovary before hatching, and (e) larva fish in the female ovary after hatching.
Sperm storage is a widely common reproductive strategy among those vertebrate species, characterized by internal fertilization.5 However, the mechanism of long-term sperm storage tends to be species-specific due to differences in storage organs. Numerous studies on mammals,6 birds,7 and insects8 have focused on issues associated with long-term sperm storage in females.9,10 Such studies have indicated that energy metabolism play a key role in sperm survivability and in maintaining sperm viability. Accordingly, it has been speculated that carbohydrates produced in female sperm storage organs could serve as metabolic substrates required for long-term sperm storage.
In the present study, we describe the first chromosome-level S. schlegelii genome characterization based on sequence analysis performed by combining the Pacific Biosciences (PacBio) Sequel sequencing platform and 10× Genomic and Hi-C mapping technologies to improve genome assembly. This genome description will provide valuable resources for researchers in the field to elucidate the mechanisms underlying key aspects of the reproductive biology of S. schlegelii; in addition, it will contribute to culturing the larvae of this species. To our knowledge, this study is the first to report genome information for a viviparous marine teleost. Moreover, here we provide new insights into the long-term storage of sperm in the female ovary through transcriptome and sperm physiological analyses.
2. Materials and methods
2.1. Sample collection
Male black rockfish (S. schlegelii) was collected from Penglai, China, and used to generate the genome sequence data. Fresh muscle samples were obtained from the black rockfish specimens under sterile conditions. Samples were stored in liquid nitrogen until used for genomic DNA extraction. Genomic DNA was obtained using standard SDS phenol/chloroform extraction and purification protocols. The quality of the genomic DNA obtained was assessed. Two-year-old male black rockfish (S. schlegelii) was anesthetized with MS222 (100 μg/ml), injected into the bottom of the pectoral fin colchicine (2.5 μg/g). Head-kidney was collected 4 h later to prepare the chromosomes.
2.2. DNA sequencing
For PacBio sequel sequencing, MagBeads bound with DNA-Polymerase complexes were loaded at 0.1 nM (on-plate concentration) using 14 single-molecule real-time (SMRT) Cells. Single-molecule sequences with C4 chemistry were constructed with PacBio sequel platform. Thereafter, a single 10× Genomics Linked-Read library from the Illumina HiSeq X Ten platform was constructed, and then, a Hi-C library was prepared with formaldehyde fixation, enzyme restriction, and biotinylated labelling. Finally, 350-bp paired-end libraries from the Illumina HiSeq X Ten platform were constructed.
2.3. Genome size estimation
Black rockfish genome-size was estimated using the k-mer method11 (Supplementary Fig. S1).
2.4. Genome assembly
2.4.1. PacBio assembly
FALCON assembler12 was used to assemble third-generation long reads to contigs of the S. schlegelii genome. The FALCON assembly process was as follows. (i) DALIGNER was used to perform error correction,13 according to the probability of insertion, deletion, and sequence errors. After error correction, we obtained pre-assemble reads. (ii) LASort and LAMerge were used for overlap-detection using the pre-assemble reads. To generate a layout of overlapping reads, we obtained de novo assembled reference contigs. (iii) The single-pass long reads were re-sequenced, mapped to de novo assembled reference contigs, and obtained for base-quality-aware consensus of uniquely mapped reads. In addition to FALCON, wtdbg2 was also used to assemble third-generation long reads by blast (KBM), assemble (FBG), and error correction (daccord).
2.4.2. 10× genomics assembly
Quiver14 was used to refine the genome. Initially, PacBio contigs were scaffolded, and then fragScaff was used to obtain super-scaffolds using 10× Genomics Linked-Read data.15
2.4.3. Chromosomal-level genome assembly using Hi-C
To enhance a chromosomal-level assembly, we used the Hi-C sequence library with Lachesis software.16,17 Initially, we compared the sequence with the draft version. BWA was used to map Hi-C clean reads to the polished S. schlegelii genome. Thereafter, cluster, order, and orientations were determined. Contigs were clustered into chromosome groups, according to the interaction of paired reads between two contigs. If the number of paired reads was much larger and the contigs interaction greater, they were clustered into one group according to the number of interactions reads which interacted with each other between two contigs, clustered, and classified into groups based on the number of the S. schlegelii chromosome, and then they were ordered within groups and assigned contig orientations in line with the strength and location of the interaction between the reads. Juicebox was used to correct the contig orientation; finally, chromosomes were anchored. Chromosomal-level assembly of the black rockfish genome was based on restriction sites in sequences and the link relationship from Hi-C; then we constructed a map, computed the weight, and connected the contigs (scaffolds) for each chromosome.
2.4.4. Final assembly refinement
Illumina short reads were initially mapped to the chromosomal-level genome assembly version using the BWA software. Subsequently, we applied Pilon18 to correct the remaining base errors with short reads according to the map results.
2.5. Genome quality evaluation
The accuracy of the assembled S. schlegelii genome was evaluated by mapping short sequence reads to the S. schlegelii genome using the BWA program,19 and we performed variant calling based on SAMtools. CEGMA20 with the core genes from vrt dataset and BUSCO21 analyses for completeness of evaluation of the S. schlegelii genome assembly. The genome assemblies by falcon and wtdbg2 were compared to obtain a more reliable genome assembly. Furthermore, we compared characteristics of the S. schlegelii genome with those of other teleost species.
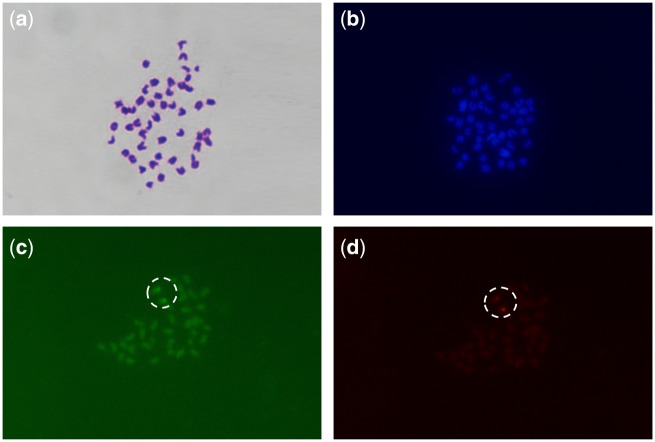
In addition, after completing the genome assembly, we confirmed the quality by FISH probes obtained from an identical chromosome assembled that could be anchored on the same chromosome. Two genes of interested, 3.816 and 3.70, from chr3 were used. Firstly, we created the local blast database of the S. schlegelii genome. Secondly, we extracted their gene sequence of them. Thirdly, we blasted each of them to the local database and selected the chr3-specific section for further design. Fourthly, PCR amplification, gel electrophoresis detection and PCR product purification sequencing were performed. Primers that were PCR single banded, size and sequence corrected were used for further probes preparation. The probes were synthetized by PCR. 3.816 was labelled with digoxin, and 3.70 was labelled with fluorescein. The PCR system was according to a modified ExTaq multiplex system (TAKARA) with 1 μg high purity DNA template. The probes were purified using sin sequencing reaction clean-up kit (Sigma). The detection was conducted by anti-dig and anti-fluorescein POD antibodies. Signal amplification was conducted with the TSA plus fluorescein/TMR kit (PerkinElmer). Mounting was performed with prolonged gold anti-fade (molecular probes by Life Technologies). Images were obtained by a microscope (Niko Eclipse Ni).
2.6. Annotation
2.6.1. Repetitive-sequences annotation
Tandem Repeat Finder22 was used to detect repetitive elements in the S. schlegelii genome. RepeatModeler (http://www.repeatmasker.org/RepeatModeler.html) was used to de novo identify genomic transposable elements (TE) and Repbase23 was used for the known repeats library. The de novo and known libraries were then combined. RepeatMasker23–25 was used to identify the TEs in the S. schlegelii genome.
2.6.2. Gene structural and functional annotation
The structural and functional annotations of the assembled genome were conducted using de novo, homolog-based, and RNA-seq methods. Augustus,26 GeneID,27 GeneScan,28 GlimmerHMM,29 and SNAP30 were used for de novo genome prediction. Thereafter, protein sequences from Cynoglossus semilaevis, Paralichthys olivaceus, Takifugu rubripes, Oreochromis niloticus, Monopterus albus, Hippocampus comes, Oryzias latipes, Xiphophorus maculatus, Oncorhynchus mykiss, and Danio rerio were searched against the S. schlegelii genome using TBLASTN.31 RNA-seq data assembled using Trinity32 were aligned against the S. schlegelii genome. Putative exon regions and splice junctions were identified by mapping RNA-seq data to the genome with Tophat,33 then, mapped reads were assembled into gene models using Cufflinks.34 All the gene models were integrated using Evidence Modeler (EVM).35 We compared the genomic structural characters of the S. schlegelii genome with those of the genomes of closely related species. Gene functions were annotated using BLAST with the SwissProt,36 Nr, Pfam,37 GO,38 and KEGG,39 and InterPro databases. We predicted the gene structure first, and blast the gene functional clusters against known databases by comparison software, then we obtained the function information for the genes. First, we blast S. schlegelii and other homologous species with blastall, with parameters set as follows: -p: tblastn (procedure), -e 1e-05 (expectation value), -F: T (low complexity regions, LCR filter). In a second step, we combined the hits of blast results with Solar software set as follows: -a prot2genome2 (-cCn 100000-d -1), -c cluster and constructed multi-blocks, -C do not examine the overlap in query, -n INUM maximum gap length 100000, -d -1 minimum depth for repeats (-1 stands for no masking). Finally, we predicted the full gene structure based on the blast hits with GeneWise with the following commands: -trev Compare on the reverse strand, -tfor Compare on the forward strand, -gensef show gene structure with supporting evidence, -gff Gene Feature Format file, -sum show summary output.
2.6.3. ncRNA annotation
Non-coding RNA in the S. schlegelii genome was predicted by BLAST against the human rRNA database, tRNAscan-SE,40 INFERNAL,41 and the Rfam database.37
2.7. Phylogenetic analysis and estimation of divergence time
The OrthoMCL42 method was used to cluster into gene families. Maximum likelihood (ML) was used for phylogenetic analysis. PAML43 was used for estimation time of divergence.
2.8. Microenvironment of the female ovary
Six cDNA libraries (FII, FIII–IV) were constructed using total RNA from pre-copulatory and post-copulatory female ovaries. Clean reads were assembled into non-redundant transcripts, and then, these transcripts were clustered into Unigenes. There were three biological replicates at each stage. The differential expression of genes was analysed between pre- and post-copulatory stages.
2.9. Sperm analysis
Fresh sperm was collected into a 200-μl centrifuge tube by gently hand stripping the testis dissected from ripe males in November. Five male individuals were prepared. Three individuals showing sperm motility>80% were used in subsequent experiments. The sperm of the three individuals were mixed together to eliminate individual differences. They were divided into two groups, a control group and a treatment group. The sperm activator of male serum was added to each group. Suppression of glycolysis was attained with sodium iodoacetate at 0.125 mM. The two groups were placed at 4 °C. Sperm motility parameters and longevity were determined using an SCA Evolution CASA sperm class analyser (Barcelona, Spain).
3. Results
3.1. Genome sequencing and assembly
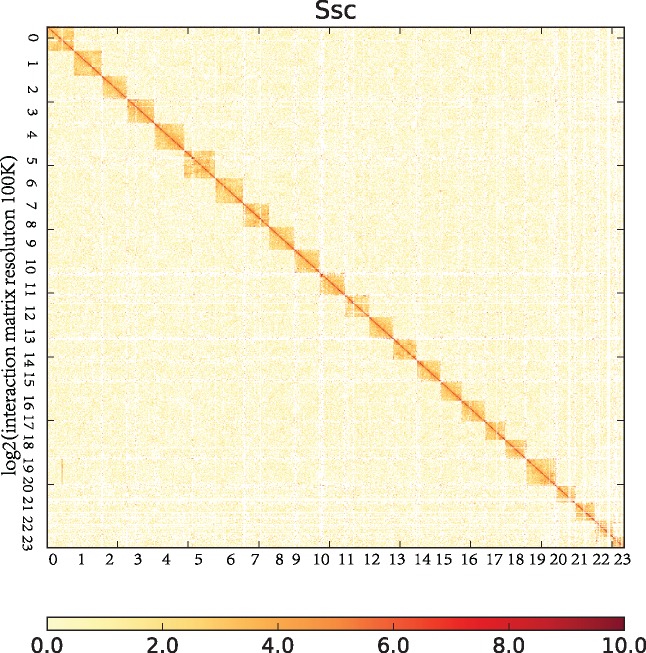
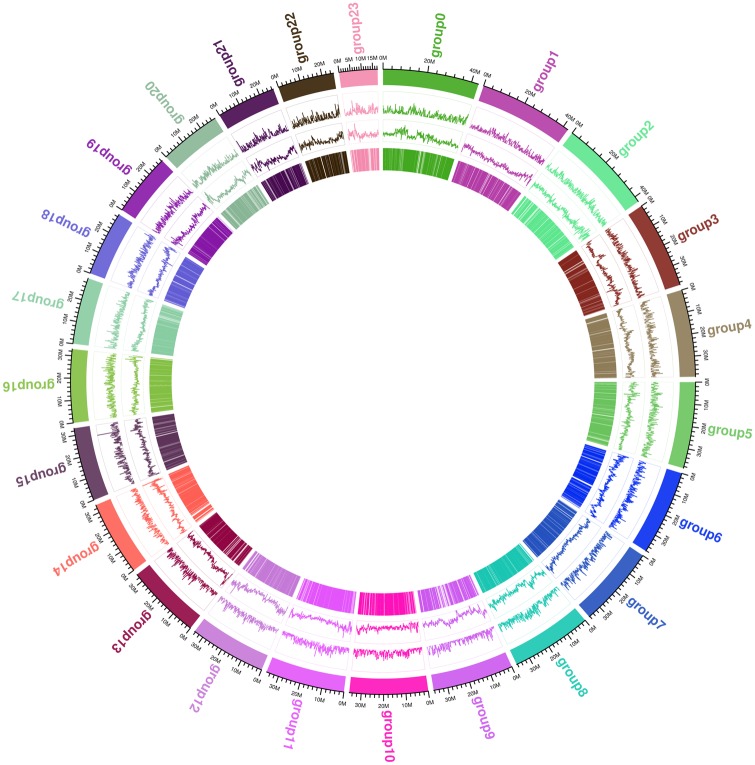
The size of the S. schlegelii genome was estimated at 842.97 Mb (Supplementary Fig. S1), and the assembled genome size was 848.31 Mb. The initial 85.78 Gb (101.76× coverage) PacBio data (Table 1) determined N50 length to be between 15.66 and 25.20 kb. Subsequently, a 129.75-Gb (153.92× coverage) of sequencing data were obtained from the 10× Genomics Linked-Read library (Table 1). The addition resulted in an 847.88-Mb draft genome comprising 1,471 scaffolds, with N50 value being improved to between 2.92 and 4.34 Mb (Table 2). Following this step, a total of 118.90 Gb (141.05× coverage) of Hi-C data were generated to assisted the assembly at the chromosomal level. We then successfully clustered 951 contigs into 24 groups using Lachesis (Fig. 2), resulting in 641 contigs that were reliably anchored on chromosomes by Hi-C. The cluster number was at 67.40% and the base count of the total genome was 96.19%. This third refinement resulted in a draft genome size of 847.94 Mb with 854 scaffolds, and an enhanced N50 value of 35.60 Mb (Table 2). Finally, we corrected the remaining errors using Pilon (Table 2). The genome size of the finally draft was 848.31 Mb, comprising 854 scaffolds, with a Contig N50 of 2.96 Mb and a Scaffold N50 of 35.63 Mb. A schematic representation of the characteristics of the genome of S. schlegelii is shown in Figure 3.
Table 1.
Summary of sequence data from S. schlegelii
| Platform | Insert size | Raw data (Gb) | Clean data (Gb) | Read length(bp) | Sequence coverage (×) | SRA accession number |
|---|---|---|---|---|---|---|
| PacBio reads | 30k | 85.78 | — | — | 101.76 | SRP173183 |
| 10× Genomics | 500–700 bp | 129.75 | 126.37 | 150 | 153.92 | SRP173183 |
| Hi-C | 350 bp | 118.90 | 118.46 | 150 | 141.05 | SRP173183 |
| Illumina reads | 350 bp | 88.08 | 88.05 | 150 | 104.49 | SRP173183 |
| In total | — | 422.51 | — | — | 501.22 |
Table 2.
Genome assembly of S. schlegelii
| Description | First assembly | Second assembly | Third assembly | Fourth error correction |
|---|---|---|---|---|
| Platform | PacBio | 10× Genomics | Hi-C | Illumina reads |
| Software | Falcon | FragScaff | Lachesis | Pilon |
| No. of contig | 2,031 | 2,031 | 2,031 | 2,019 |
| Total length of contig (Mb) | 842.15 | 843.91 | 843.91 | 843.86 |
| Contig N50 (Mb) | 2.92 | 2.93 | 2.93 | 2.96 |
| Minimum length (bp) | 129 | 129 | 129 | 130 |
| Maximum length (Mp) | 10.97 | 10.99 | 10.99 | 10.99 |
| No. of Scaffold | 2,031 | 1,471 | 854 | 854 |
| Total length of Scaffold (Mb) | 842.15 | 847.88 | 847.94 | 848.31 |
| Scaffold N50 (Mp) | 2.92 | 4.34 | 35.60 | 35.63 |
| Minimum length (bp) | 129 | 129 | 129 | 130 |
| Maximum length (Mp) | 10.97 | 15.60 | 43.18 | 43.20 |
| N (%) | 0 | 0.47 | 0.48 | 0.52 |
Figure 2.
The contig contact matrix from the genome of Sebastes schlegelii derived from Hi-C data. In the plot, the red colour indicates a high-density logarithm and the white colour indicates a low contact density logarithm. In Hi-C analysis, the genome was divided into bin by 100k. The number of interactions between bin reads was calculated, that is, the number of interactions between bins. Each point in the figure represents the number of interactions between bins with horizontal and vertical coordinates, and the colour intensity represents the strength of the interactions. Genome-wide interactions tend to be more intra-chromosomal than inter-chromosomal.
Figure 3.
A schematic representation of the characteristics of the genome of Sebastes schlegelii. From the outer to the inner circles: I, chromosomes; II, gene density; III, repeat density; IV, coding-sequence region.
3.2. Genome quality evaluation
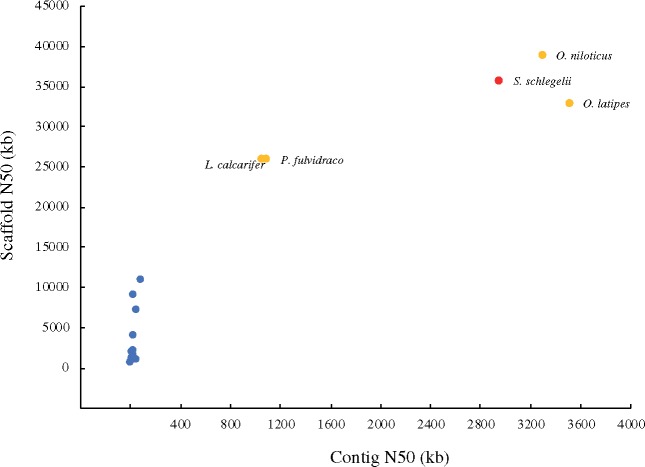
A total of 97.93% of the short sequence reads covered 99.61% map of the genome assembly map. We used samtools (http://dept.qdio.cas.cn/emblc/ktzjs/hyjg/zncy/) to deal with the comparison result of BWA, order the chromosome coordinate, dispose of the repeat reads, SNP calling, filter the raw data, and finally get the homozygous single-nucleotide polymorphisms (SNP) percentage. The homology for SNP was 0.00038%. As the percentage of homology for SNP reflects the accuracy of genome assembly, and 0.00038% indicates that the level of genome assembly shows high quality at the single-base level. Moreover, CEGMA and BUSCO analyses were used to evaluate the genome assembly quality, providing scores of 92.34% and 95.5%, respectively (Table 3). In the BUSCO analysis summarized in Table 3, 2.4% of the genes were missing and 2.1% of the genes were fragmented, together adding up to 4.5%. There were 127 genes missing in the BUSCO dataset. We extracted the pep ID of the missing genes, and blast with the pep sequence of S. schlegelii. The percentage of the alignments was all <50%, indicating that they were not in the genome of S. schlegelii. Therefore, the results confirmed that the missing genes from BUSCO’S aligner could not be aligned. Furthermore, the genome assembly versions of S. schlegelii were compared (Table 4). The scaffold N50 and genome coverage assembly as per the falcon version (35.63 Mb, 99.61) was higher than that of the wtdbg2 version (33.81 Mb, 99.36) while the contig N50 and the homology SNP (%) assembly as per the falcon version (2.92 Mb, 0.00038) is lower than that of the wtdbg2 version (15.39 Mb, 0.0009). Assembled S. schlegelii genome was compared with those of other teleost species (Fig. 4 and Supplementary Table S1). The N50 lengths of both contigs and scaffolds are shown in Supplementary Table S2. Two-colour DNA probes obtained from an identical chromosome (chr3) anchored on the same chromosome (Fig. 5).
Table 3.
Statistics for genome characteristic of S. schlegelii
| Genome characteristic | |
|---|---|
| Estimated genome size (Mb) | 842.97 |
| Assembled genome size (Mb) | 848.31 |
| Reads mapping rate (%) | 97.93 |
| Genome coverage (%) | 99.61 |
| GC content (%) | 40.75 |
| Homology SNP (%) | 0.00038 |
| CEGMA evaluate (%) | 92.34 |
| BUSCO genome completence | n=2586 |
| Complete | 2470 (95.5%) |
| Complete and single copy | 2400 (92.8%) |
| Complete and duplicated | 70 (2.7%) |
| Fragmented | 54(2.1%) |
| Missing | 62 (2.4%) |
The percentage of homology SNP reflects the accuracy of genome assemble, and the results Homology SNP 0.00038% shows that the level of the genome assembly possesses high quality at single base level.
Table 4.
Genome assembly versions comparison of Sebastes schlegelii
| Dataset | Metric | FALCON+FragScaff+Lachesis+Pilon | Wtdbg2+FragScaff+Lachesis+Pilon |
|---|---|---|---|
| S. schlegelii | Contig N50 (Mb) | 2.92 | 15.39 |
| Illumina reads | Scaffold N50 (Mb) | 35.63 | 33.81 |
| Pacbio reads | Assembled genome size (Mb) | 848.31 | 784.94 |
| 10× Genomics | Reads mapping rate (%) | 97.93 | 98.29 |
| Hi-C | Genome coverage (%) | 99.61 | 99.36 |
| GC content (%) | 40.75 | 40.81 | |
| Homology SNP (%) | 0.00038 | 0.0009 | |
| N (%) | 0.52 | 0.18 | |
| CEGMA evaluate (%) | 92.34 | 94.76 | |
| BUSCO genome completence | 2,586 (95.5%) | 2,586 (98.0%) |
Figure 4.
Comparison of the Sebastes schlegelii genome with other publicly available teleost genomes. The x axis represents the contig N50 values and the y axis represents the scaffold N50 values. The genomes sequenced with PacBio are highlighted in orange and the genome of S. schlegelii is highlighted in red.
Figure 5.
FISH DNA probes obtained from an identical chromosome (Chr 3) anchored on the same chromosome to confirm the quality of chromosome-scale assembly using Hi-C. (a) Giemsa staining, (b) DAPI, (c) fluorescein-labelled, and (d) DIG-labelled, 100×.
3.3. Genome annotation of black rockfish
The RNA-seq data for the S. schlegelii genome and that of the genomes of 10 other teleost species were used for the structural and functional annotations (Supplementary Table S2). The annotated results revealed the following information: repetitive elements, 39.98%; in the genome of S. schlegelii, the main repetitive transposable elements were the DNA transposons (18.06%) and retrotransposable elements (17.93%) (Table 5). Among 26,979 protein-coding genes, 26,775 (99.20%) were functionally annotated with terms (Table 6). We compared the structure of the genome of S. schlegelii with those of closely related species. The mean number of exons per gene was 8.63 (Supplementary Table S3).
Table 5.
Summary of genome annotation for S. schlegelii
| Annotation | |
|---|---|
| Repetitive sequence content | 39.98% |
| DNA | 18.06% |
| LINE | 9.59% |
| SINE | 1.08% |
| LTR | 7.26% |
| Protein-coding genes | 26,979 |
| Mean transcript length | 14,159.49 bp |
| Mean CDS length | 1,452.03 bp |
| Mean exon per gene | 8.63 |
| Mean exon length | 168.32 bp |
| Mean intron length | 1,666.16 bp |
Table 6.
Statistics for genome annotation of S. schlegelii
| Database | Number of annotated transcripts | % |
|---|---|---|
| Swissprot | 23,337 | 86.50 |
| Nr | 24,963 | 92.50 |
| KEGG | 21,449 | 79.50 |
| InterPro | 26,698 | 99.00 |
| GO | 24,857 | 92.10 |
| Pfam | 20,818 | 77.20 |
| Annotated | 26,775 | 99.20 |
| Unannotated | 204 | 0.80 |
3.4. Phylogenetic and divergence-time analysis
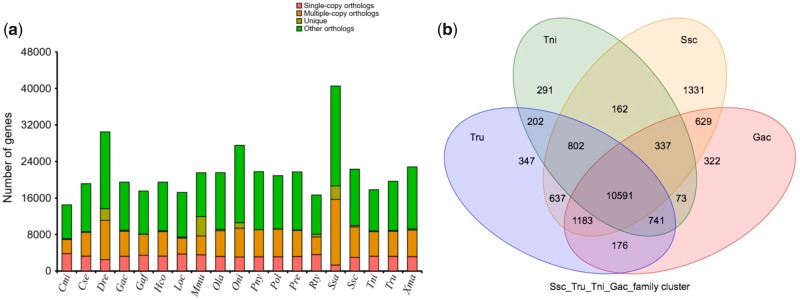
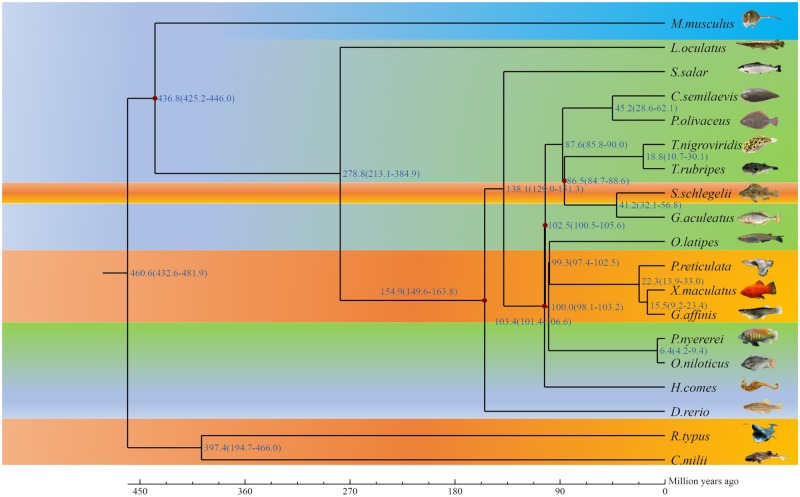
In the present study, we constructed 24,636 gene family clusters with 648 single-copy gene families (Fig. 6). S. schlegelii diverged from the common ancestor of Gasterosteus aculeatus ∼32.1–56.8 million years ago (Fig. 7). The retrotransposable elements (17.93%) were more than in zebrafish (11%), and less than in humans (44%). In contrast, the DNA transposable elements of S. schlegelii were 18.06%, more than in humans (3.2%), and medaka (<10%) but less than in zebrafish (39%). In addition, there were 1,331 specific family clusters in S. schlegelii, over four times more than that in G. aculeatus (322). We identified 422 gene families to be expanded in the S. schlegelii genome. The functional enrichment by GO and KEGG of those expanded gene families identified 282 and 45 significantly enriched (P < 0.05) GO terms and pathways, respectively. The expanded gene families were mainly found on NOD-like receptor signal pathways (P = 2.91E-23), circadian entrainment (P = 1.48E-17), taste transduction (P = 3.39E-15), calcium signal pathway (P = 6.40E-13), olfactory transduction signal pathway (P = 4.06E-09), dynein complex term (P = 5.12E-21), homophilic cell adhesion term (P = 7.27E-17), transmembrane transport term (P = 7.35e-15), and microtubule motor activity term (P = 5.25E-14). Additionally, we identified 76 gene families that were enriched significantly contracted in this work. The lineage-specific gene families may contribute to reproductive traits that are specific to the S. schlegelii.
Figure 6.
Gene-family cluster analysis. (a) The comparison of gene families from Sebastes. schlegelii and other teleosts. The horizontal axis indicates the species and the vertical axis represents the number of genes. The pink colour represents single-copy genes; yellow represents multiple-copy genes; deep yellow represents unique paralogues; green represents other orthologues and unclustered genes. Here, other means except the above three types. Some genes were not clustered in the gene family or clustered in a gene family from some of the species. (b) The gene-family Venn diagram. Ssc, Sebastes schlegelii; Gac, Gasterosteus aculeatus; Tru, Takifugu rubripes; Tni, Tetraodon nigroviridis.
Figure 7.
Estimation of the time of divergence of Sebastes. Schlegelii. Note: The numbers on the nodes represent the divergence times (millions of years ago, mya).
3.5. The interaction between ovary microenvironment and sperm storage
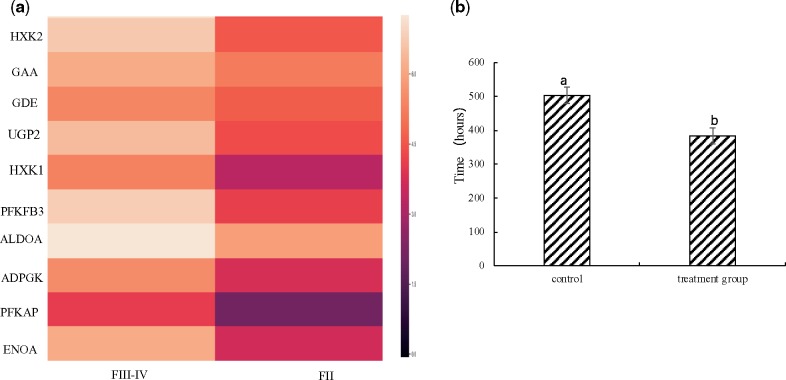
Female black rockfish have been found to store sperm in their ovaries for up to 6 months. The maintenance of sperm viability is dependent upon exogenous energy sources derived from the ovary microenvironment. Carrier protein SLC2 showed significantly positive selection based on comparative genome analysis. The expression of carbohydrate metabolism-related KEGG pathways was significantly up-regulated in ovaries from pre-copulation to post-copulation, based on differential genes expression analysis of transcriptome. Based on FPKM value, gene expression of carbohydrate metabolism-related genes, such as HXK2, GAA, GDE, UGP2, HXK1, PFKFB3, ALDOA, ADPGK, PFKAP, and ENOA were all significantly up-regulated from pre-copulation (FII) to post-copulation (FIII–IV), as per KEGG (Fig. 8a). Moreover, glycolysis is one of the ATP-energy producing pathways enhanced by energy-substrate availability. Sodium iodoacetate is a specific inhibitor of glycolysis acting on glyceraldehyde-3-phosphate dehydrogenase (GAPDH). In the present study, sperm longevity in the experimental group subjected to in vitro suppression of glycolysis by sodium iodoacetate was significantly reduced sperm longevity from 504 ± 24 h to 384 ± 48 h (control group) (Fig. 8b). These results indicated that carbohydrate sources from the microenvironment surrounding the ovaries may play an important role in maintaining sperm survivability during long-term storage.
Figure 8.
The interaction of ovary microenvironment and sperm storage. (a) The heatmap of carbohydrate metabolism-related gene expression from Pre-copulation (FII) to post-copulation (FIII–IV); the higher the gene expression, the lighter the colour. The quantities expression was calculated based on FPKM (expected number of Fragments Per Kilobase of transcript sequence per Millions base pairs sequenced); (b) the time of sperm survivability of control and experimental groups (sodium iodoacetate treatment) in vitro. The error bars were calculated by mean value ± standard deviation, and are shown as standard deviation.
4. Discussion
Black rockfish is a viviparous marine teleost characterized by internal fertilization associated with long-term (up to 6 months) sperm storage in the female ovary. However, although the genomes of numerous oviparous fish species have been previously been sequenced, to date, few genomic resources have been reported for viviparous marine teleosts. Currently, data are available for the viviparous freshwater fish platyfish44 and for the chondrichthyes elephant shark.45 The S. schlegelii genome described herein expands the information available on genome evolution of viviparous marine teleost species. Moreover, the chromosomal-level genome assembly of S. schlegelii provides an opportunity to examine the appearance (reproductive strategy, sperm storage, sperm competition, and sexual selection) of viviparty at the genome level.
In recent years, long-read sequences have experienced an important growth spurt with PacBio technologies. There are many assemblers for long-read assembly, and it is necessary to generate multiple genome assemblies and compare the results to obtain a more reliable genome assembly for the genome community. In the present study, the genome assembly was done using FALCON and wtdbg2. Currently, many genome assemblies obtained for teleosts by FALCON are available, such as those of Antarctic blackfin icefish,46 snailfish,47 yellow catfish,48 Cephalopods,49 barkley,50 and mountain carps.51 In addition, in other species, such as great ape,52 koala,53 water buffalo,54 maize,55 stout camphor tree,56 and apple,57 the FALCON assembler has been widely used in long-read assembly of the genome. At first, we selected FALCON as the assembler, and then, we also used wtdbg2 to reassembly and compared the two in order to assess the quality of the two assemblies. Although FALCON may not be the best assembler, it is reliable enough in long-read assembly. The overall quality of the FALCON assembly of S. schlegelii genome resides in its reliability.
On the basis of comparison of the genome assembly of S. schlegelii with that available for other teleosts, the contig and scaffold N50 lengths were both of considerable continuity. In the present study, we used a combination of Pacific Biosciences sequel and Illumina sequencing platforms and 10× Genomics and Hi-C technology to obtain a genome assembly size of 848.31 Mb comprising 24 chromosomes, and contig and scaffold N50 lengths of 2.96 and 35.63 Mb, respectively. Moreover, the sequenced S. schlegelii genome was found to be considerably longer than those obtained for other fish species using next-generation sequencing technology, and even far surpassed some genome sequencing obtained using PacBio. We also compared basic genome structural features, including genes lengths, coding regions, and non-coding regions of the S. schlegelii genome with those of closely related species, all of which reached a reasonable high level. Genome annotation, revealed that the S. schlegelii genome contains 39.98% repetitive elements (Table 5), which is considerably higher than the corresponding percentage of the three-spine stickleback,58 but lower than that of the zebrafish.59
Among the 19 species, we used to construct the phylogenetic tree in the present study, there are two types of reproductive strategy, namely, viviparity44,45 and oviparity.58,59 Interestingly, we found that those species characterized by viviparous and oviparous modes of reproduction did not show any particular evolutionary relationship (Fig. 6). The results showed that the reproductive mode is not significantly or no directly related to an evolutionary relationship. Vivipary is not an attribute of phyletic evolution but of specialization from closely related oviparous species. In particular, black rockfish and platy fish are both viviparous, and we found that they diverged from the three-spined stickleback fish and medaka several tens of millions of years ago, respectively. The specialization of viviparity from the closely related oviparous species may be ascribed to environmental influences. Currently, there is limited information available regarding reproductive development in viviparous species, and thus, the black rockfish is considered an attractive viviparous fish model for studies on sperm storage, reproductive mode, and fertilization biology, among other biological issues of importance.
Sperm storage is a common reproductive strategy among vertebrate species that are characterized by internal fertilization. Nevertheless, sperm storage time is a species-specific characteristic that varies from minutes to years.5 In black rockfish, females have been found to store sperm in their ovaries for up to 6 months. Furthermore, the state of sperm changes concomitant with ovary development, from swimming in the ovarian fluid to penetration of the ovigerous lamellae epithelium, subsequent reactivation, and finally fertilizing the eggs.2 The maintenance of sperm viability is dependent upon exogenous energy sources derived from the ovary microenvironment. The solute carriers (SLCs) superfamily is one of the most important membrane transporter families; SLCs are involved in the intercellular transport of substances, and transfer of energy, nutrients, and metabolites.60 In the present study, we found that the glucose transporter protein SLC2, a member of SLC superfamily, showed significantly positive selection in black rockfish genome. In mammals,61 including humans62 and mice,63 carbohydrates are positively correlated with the duration of sperm viability. Furthermore, in the present study, we found that many carbohydrate metabolism-related KEGG pathways that provide energy substrates sources showed significant up-regulation from pre- to post-copulation. These observations agree with our belief that during the storage stage, sperm in the female ovary is dependent on energy substrates derived from the surrounding microenvironment. We accordingly provided evidence in support of this hypothesis in vitro by demonstrating that in vitro suppression of glycolysis significantly reduced sperm longevity, thereby indicating the importance of carbohydrate sources in maintaining sperm survivability.
In conclusion, this is the first study to conduct chromosomal-level sequencing of the genome of a viviparous marine teleost characterized by long-term sperm storage (up to 6 months) in female ovaries. Here, we obtained a genome assembly size of 848.31 Mb comprising 24 chromosomes, and contig and scaffold N50 lengths of 2.96 and 35.63 Mb, respectively. We predicted 39.98% repetitive elements, and 26,979 protein-coding genes; further our analysis determined that S. schlegelii diverged from Gasterosteus aculeatus ∼32.1–56.8 million years ago. Genome, transcriptome, and in vitro sperm physiological analyses provided an insight into the carbohydrate substances produced in female ovaries in support of long-term sperm storage. Therefore, we believe our findings will provide an important genomic resource for researchers in the fields of marine and reproductive biology.
Supplementary Material
Acknowledgements
This research was supported by National Key R&D Program of China (2018YFD0901205, 2018YFD0901204), National Natural Science Foundation of China (31572602, 31802278), China Agriculture Research System (CARS-47), Marine S & T Fund of Shandong Province for Pilot Qingdao National Laboratory for Marine Science and Technology (2018SDKJ0302-4, 2018SDKJ0302-5), Chinese Academy of Science and Technology Service Network Planning (KFJ-EW-STS-060), Shandong Province Key Research and Invention Program (2017CXGC010K), and the National Infrastructure of Fishery Germplasm Resource (2019DKA30470).
Accession numbers
The DNA sequence of PacBio, Illumina-short reads, 10× Genomic, and Hi-C were deposited in NCBI Sequence Read Archive database, under the accession number, SRP173183; the BioProject number is PRJNA509745.
Conflict of interest
None declared.
References
- 1. Breder C.M. Jr, Rosen D.E.. 1966, Modes of Reproduction in Fishes. Natural History Press: Garden City, NY, p.957. [Google Scholar]
- 2. Mori H., Nakagawa M., Soyano K., Koya Y.. 2003, Annual reproductive cycle of black rockfish Sebastes schlegeli in captivity, Fisheries Sci., 69, 910–23. [Google Scholar]
- 3. Boehlert G.W., Love M.S., Wourms J.P., Yamada J.. 1991, A summary of the symposium on rockfishes and recommendations for future research, Environ. Biol. Fish., 30, 273–80. [Google Scholar]
- 4. Kusakari M. 1995, Studies on the reproductive biology and artificial juvenile production of kurosoi Sebastes schlegeli, Sci. Rep. Hokkaido Fish. Exp. Stn., 47, 41–124. [Google Scholar]
- 5. Holt W.V., Lloyd R.E.. 2010, Sperm storage in the vertebrate female reproductive tract: how does it work so well?, Theriogenology, 73, 713–22. [DOI] [PubMed] [Google Scholar]
- 6. Kumar L., Yadav S.K., Kushwaha B., et al. 2016, Energy utilization for survival and fertilization—parsimonious quiescent sperm turn extravagant on motility activation in rat, Biol. Reprod., 94, 1–9. [DOI] [PubMed] [Google Scholar]
- 7. Sasanami T., Matsuzaki M., Mizushima S., Hiyamm G.. 2013, Sperm storage in the female reproductive tract in birds, J. Reprod. Dev., 59, 334–8. [DOI] [PMC free article] [PubMed] [Google Scholar]
- 8. Paynter E., Millar A.H., Welch M., Baer-Imhoof B., Cao D.Y., Baer B.. 2017, Insights into the molecular basis of long-term storage and survival of sperm in the honeybee (Apis mellifera), Sci. Rep., 7, 1–9. [DOI] [PMC free article] [PubMed] [Google Scholar]
- 9. Orr T.J., Zuk M.. 2012, Sperm storage, Curr. Biol., 22, R8–10. [DOI] [PubMed] [Google Scholar]
- 10. Orr T.J., Brennan P.L.R.. 2015, Sperm storage: distinguishing selective processes and evaluating criteria, Trends Ecol. Evol., 30, 261–72. [DOI] [PubMed] [Google Scholar]
- 11. Liu B., Shi Y.J., Yuan J.Y., et al. 2013, Estimation of genomic characteristics by analyzing k-mer frequency in de novo genome projects, Quant. Biol., 35, 62–7. [Google Scholar]
- 12. Chin C.S., Peluso P., Sedlazeck F.J., et al. 2016, Phased diploid genome assembly with single molecule real-time sequencing, Nat. Methods, 13, 1050–4. [DOI] [PMC free article] [PubMed] [Google Scholar]
- 13. Myers G. 2014, Efficient local alignment discovery amongst noisy long reads, Algorithms Bioinformatics, 8701, 52–67. [Google Scholar]
- 14. Chin C.S., Alexander D.H., Marks P., et al. 2013, Nonhybrid, finished microbial genome assemblies from long-read SMRT sequencing data, Nat. Methods, 10, 563–9. [DOI] [PubMed] [Google Scholar]
- 15. Adey A., Kitzman J.O., Burton J.N., et al. 2014, In vitro, long-range sequence information for de novo genome assembly via transposase contiguity, Genome Res., 24, 2041–9. [DOI] [PMC free article] [PubMed] [Google Scholar]
- 16. Dudchenko O., Batra S.S., Omer A.D., et al. 2017, De novo assembly of the Aedes aegypti genome using Hi-C yields chromosome-length scaffolds, Science, 356, 92–5. [DOI] [PMC free article] [PubMed] [Google Scholar]
- 17. Burton J.N., Adey A., Patwardhan R.P., Qiu R.L., Kitzman J.O., Shendure J.. 2013, Chromosome-scale scaffolding of de novo genome assemblies based on chromatin interactions, Nat. Biotechnol., 31, 1119–25. [DOI] [PMC free article] [PubMed] [Google Scholar]
- 18. Walker B.J., Abeel T., Shea T., et al. 2014, Pilon: an integrated tool for comprehensive microbial variant detection and genome assembly improvement, PLoS One, 9, 1–14. [DOI] [PMC free article] [PubMed] [Google Scholar]
- 19. Li H., Durbin R.. 2009, Fast and accurate short read alignment with Burrows-Wheeler transform, Bioinformatics, 25, 1754–60. [DOI] [PMC free article] [PubMed] [Google Scholar]
- 20. Parra G., Bradnam K., Korf I.. 2007, CEGMA: a pipeline to accurately annotate core genes in eukaryotic genomes, Bioinformatics, 23, 1061–7. [DOI] [PubMed] [Google Scholar]
- 21. Simao F.A., Waterhouse R.M., Ioannidis P., Kriventseva E.V., Zdobnov E.M.. 2015, BUSCO: assessing genome assembly and annotation completeness with single-copy orthologs, Bioinformatics, 31, 3210–2. [DOI] [PubMed] [Google Scholar]
- 22. Benson G. 1999, Tandem repeats finder: a program to analyze DNA sequences, Nucleic Acids Res., 27, 573–80. [DOI] [PMC free article] [PubMed] [Google Scholar]
- 23. Bao W.D., Kojima K.K., Kohany O.. 2015, Repbase update, a database of repetitive elements in eukaryotic genomes, Mob. DNA, 6, 1–6. [DOI] [PMC free article] [PubMed] [Google Scholar]
- 24. Chen N.S. 2004, Using RepeatMasker to identify repetitive elements in genomic sequences, Curr. Protoc. Bioinformatics, 4, 1–14. [DOI] [PubMed] [Google Scholar]
- 25. Bergman C.M., Quesneville H.. 2007, Discovering and detecting transposable elements in genome sequences, Brief. Bioinformatics, 8, 382–92. [DOI] [PubMed] [Google Scholar]
- 26. Stanke M., Waack S.. 2003, Gene prediction with a hidden Markov model and a new intron submodel, Bioinformatics, 19(Suppl 2), ii215–25. [DOI] [PubMed] [Google Scholar]
- 27. Guigo R. 1998, Assembling genes from predicted exons in linear time with dynamic programming, J. Comput. Biol., 5, 681–702. [DOI] [PubMed] [Google Scholar]
- 28. Burge C., Karlin S.. 1997, Prediction of complete gene structures in human genomic DNA, J. Mol. Biol., 268, 78–94. [DOI] [PubMed] [Google Scholar]
- 29. Majoros W.H., Pertea M., Salzberg S.L.. 2004, TigrScan and GlimmerHMM: two open source ab initio eukaryotic gene-finders, Bioinformatics, 20, 2878–9. [DOI] [PubMed] [Google Scholar]
- 30. Korf I. 2004, Gene finding in novel genomes, BMC Bioinformatics, 5, 1–9. [DOI] [PMC free article] [PubMed] [Google Scholar]
- 31. Altschul S.F., Gish W., Miller W., Myers E.W., Lipman D.J.. 1990, Basic local alignment search tool, J. Mol. Biol., 215, 403–10. [DOI] [PubMed] [Google Scholar]
- 32. Grabherr M.G., Haas B.J., Yassour M., et al. 2011, Full-length transcriptome assembly from RNA-Seq data without a reference genome, Nat. Biotechnol., 29, 644–52. [DOI] [PMC free article] [PubMed] [Google Scholar]
- 33. Kim D., Pertea G., Trapnell C., Pimentel H., Kelley R., Salzberg S.L.. 2013, TopHat2: accurate alignment of transcriptomes in the presence of insertions, deletions and gene fusions, Genome Biol., 14, 1–13. [DOI] [PMC free article] [PubMed] [Google Scholar]
- 34. Trapnell C., Roberts A., Goff L., et al. 2012, Differential gene and transcript expression analysis of RNA-seq experiments with TopHat and Cufflinks, Nat. Protoc., 7, 562–78. [DOI] [PMC free article] [PubMed] [Google Scholar]
- 35. Haas B.J., Salzberg S.L., Zhu W., et al. 2008, Automated eukaryotic gene structure annotation using EVidenceModeler and the program to assemble spliced alignments, Genome Biol., 9, 1–22. [DOI] [PMC free article] [PubMed] [Google Scholar]
- 36. Bairoch A. 2000, The SWISS-PROT protein sequence database and its supplement TrEMBL in 2000, Nucleic Acids Res., 28, 45–48. [DOI] [PMC free article] [PubMed] [Google Scholar]
- 37. Finn R.D., Coggill P., Eberhardt R.Y., et al. 2016, The Pfam protein families database: towards a more sustainable future, Nucleic Acids Res., 44, D279–85. [DOI] [PMC free article] [PubMed] [Google Scholar]
- 38. Carbon S., Dietze H., Lewis S.E., et al. 2017, Expansion of the Gene Ontology knowledgebase and resources, Nucleic Acids Res., 45, D331–8. [DOI] [PMC free article] [PubMed] [Google Scholar]
- 39. Ogata H., Goto S., Sato K., Fujibuchi W., Bono H., Kanehisa M.. 1999, KEGG: Kyoto encyclopedia of genes and genomes, Nucleic Acids Res., 27, 29–34. [DOI] [PMC free article] [PubMed] [Google Scholar]
- 40. Lowe T.M., Eddy S.R.. 1997, tRNAscan-SE: a program for improved detection of transfer RNA genes in genomic sequence, Nucleic Acids Res., 25, 955–64. [DOI] [PMC free article] [PubMed] [Google Scholar]
- 41. Nawrocki E.P., Kolbe D.L., Eddy S.R.. 2009, Infernal 1.0: inference of RNA alignments, Bioinformatics, 25, 1335–7. [DOI] [PMC free article] [PubMed] [Google Scholar]
- 42. Edgar R.C. 2004, MUSCLE: multiple sequence alignment with high accuracy and high throughput, Nucleic Acids Res., 32, 1792–7. [DOI] [PMC free article] [PubMed] [Google Scholar]
- 43. Yang Z.H. 2007, PAML 4: phylogenetic analysis by maximum likelihood, Mol. Biol. Evol., 24, 1586–91. [DOI] [PubMed] [Google Scholar]
- 44. Schartl M., Walter R.B., Shen Y.J., et al. 2013, The genome of the platyfish, Xiphophorus maculatus, provides insights into evolutionary adaptation and several complex traits, Nat. Genet., 45, 567–U150. [DOI] [PMC free article] [PubMed] [Google Scholar]
- 45. Venkatesh B., Lee A.P., Ravi V., et al. 2014, Elephant shark genome provides unique insights into gnathostome evolution, Nature, 505, 174–9. [DOI] [PMC free article] [PubMed] [Google Scholar]
- 46. Kim B.M., Amores A., Kang S., et al. 2019, Antarctic blackfin icefish genome reveals adaptations to extreme environments, Nat. Ecol. Evol., 3, 469–78. [DOI] [PMC free article] [PubMed] [Google Scholar]
- 47. Wang K., Shen Y.J., Yang Y.Z., et al. 2019, Morphology and genome of a snailfish from the Mariana Trench provide insights into deep-sea adaptation, Nat. Ecol. Evol., 3, 823–33. [DOI] [PubMed] [Google Scholar]
- 48. Gong G.R., Dan C., Xiao S.J., et al. 2018, Chromosomal-level assembly of yellow catfish genome using third-generation DNA sequencing and Hi-C analysis, Gigascience, 7, 1–9. [DOI] [PMC free article] [PubMed] [Google Scholar]
- 49. Kim B.M., Kang S., Ahn D.H., et al. 2019, The genome of common long-arm octopus Octopus minor, Gigascience, 7, 1–7. [DOI] [PMC free article] [PubMed] [Google Scholar]
- 50. Liu H.P., Liu Q.Y., Chen Z.Q., et al. 2018, Draft genome of Glyptosternon maculatum, an endemic fish from Tibet Plateau, Gigascience, 7, 1–7. [DOI] [PMC free article] [PubMed] [Google Scholar]
- 51. Liu H.P., Xiao S.J., Wu N., et al. 2019, The sequence and de novo assembly of Oxygymnocypris stewartii genome, Sci. Data, 6, 1–11. [DOI] [PMC free article] [PubMed] [Google Scholar]
- 52. Kronenberg Z.N., Fiddes I.T., Gordon D., et al. 2018, High-resolution comparative analysis of great ape genomes, Science, 360, 1–11. [DOI] [PMC free article] [PubMed] [Google Scholar]
- 53. Johnson R.N., O’Meally D., Chen Z.L., et al. 2018, Adaptation and conservation insights from the koala genome, Nat. Genet., 50, 1102–11. [DOI] [PMC free article] [PubMed] [Google Scholar]
- 54. Low W.Y., Tearle R., Bickhart D.M., et al. 2019, Chromosome-level assembly of the water buffalo genome surpasses human and goat genomes in sequence contiguity, Nat. Commun., 10, 1–11. [DOI] [PMC free article] [PubMed] [Google Scholar]
- 55. Sun S.L., Zhou Y.S., Chen J., et al. 2018, Extensive intraspecific gene order and gene structural variations between Mo17 and other maize genomes, Nat. Genet., 50, 1289–95. [DOI] [PubMed] [Google Scholar]
- 56. Chaw S.M., Liu Y.C., Wu Y.W., et al. 2019, Stout camphor tree genome fills gaps in understanding of flowering plant genome evolution, Nat. Plants., 5, 63–73. [DOI] [PMC free article] [PubMed] [Google Scholar]
- 57. Zhang L.Y., Hu J., Han X.L., et al. 2019, A high-quality apple genome assembly reveals the association of a retrotransposon and red fruit colour, Nat. Commun., 10, 1–13. [DOI] [PMC free article] [PubMed] [Google Scholar]
- 58. Jones F.C., Grabherr M.G., Chan Y.F., et al. 2012, The genomic basis of adaptive evolution in threespine sticklebacks, Nature, 484, 55–61. [DOI] [PMC free article] [PubMed] [Google Scholar]
- 59. Howe K., Clark M.D., Torroja C.F., et al. 2013, The zebrafish reference genome sequence and its relationship to the human genome, Nature, 496, 498–503. [DOI] [PMC free article] [PubMed] [Google Scholar]
- 60. Mitchell P. 1967, Translocations through natural membranes, Adv. Enzymol. Relat. Area. Mol. Biol., 29, 33–87. [DOI] [PubMed] [Google Scholar]
- 61. Storey B.T. 2008, Mammalian sperm metabolism: oxygen and sugar, friend and foe, Int. J. Dev. Biol., 52, 427–37. [DOI] [PubMed] [Google Scholar]
- 62. Williams A.C., Ford W.C.L.. 2001, The role of glucose in supporting motility and capacitation in human spermatozoa, J. Androl., 22, 680–95. [PubMed] [Google Scholar]
- 63. Mukai C., Okuno M.. 2004, Glycolysis plays a major role for adenosine triphosphate supplementation in mouse sperm flagellar movement, Biol. Reprod., 71, 540–7. [DOI] [PubMed] [Google Scholar]
Associated Data
This section collects any data citations, data availability statements, or supplementary materials included in this article.


