Abstract
Background and Purpose:
Volumes of hemorrhage and perihematomal edema (PHE) are well-established biomarkers of primary and secondary injury, respectively, in spontaneous intracerebral hemorrhage (ICH). An automated imaging pipeline capable of accurately and rapidly quantifying these biomarkers would facilitate large cohort studies evaluating underlying mechanisms of injury.
Methods:
Regions of hemorrhage and PHE were manually delineated on CT scans of patients enrolled in two ICH studies. Manual “ground-truth” masks from the first cohort were used to train a fully convolutional neural network to segment images into hemorrhage and PHE. The primary outcome was automated-versus-human concordance in hemorrhage and PHE volumes. The secondary outcome was voxel-by-voxel overlap of segmentations, quantified by the Dice similarity coefficient (DSC). Algorithm performance was validated on 84 scans from the second study.
Results:
224 scans from 124 patients with supratentorial ICH were used for algorithm derivation. Median volumes were 18 ml (IQR 8–43) for hemorrhage and 12 ml (IQR 5–30) for PHE. Concordance was excellent (0.96) for automated quantification of hemorrhage and good (0.81) for PHE, with DSC of 0.90 (IQR 0.85–0.93) and 0.54 (0.39–0.65), respectively. External validation confirmed algorithm accuracy for hemorrhage (concordance 0.98, DSC 0.90) and PHE (concordance 0.90, DSC 0.55). This was comparable with the consistency observed between two human raters (DSC 0.90 for hemorrhage, 0.57 for PHE).
Conclusions:
We have developed a deep learning-based imaging algorithm capable of accurately measuring hemorrhage and PHE volumes. Rapid and consistent automated biomarker quantification may accelerate powerful and precise studies of disease biology in large cohorts of ICH patients.
Keywords: Cerebral Hemorrhage, Brain Edema, Deep Learning, Neural Networks, Volumetry
Subject Terms: Intracranial Hemorrhage, Imaging, Computerized Tomography (CT)
INTRODUCTION
Spontaneous intracerebral hemorrhage (ICH) leads to significant disability through a combination of primary and secondary injury mechanisms. Advancing the understanding of these mechanisms is facilitated by reproducible measurement of imaging biomarkers of injury. The best-established biomarkers of primary and secondary injury are hemorrhage volume and perihematomal edema (PHE) volume, respectively. While the former is easy to measure, the latter is time-consuming and susceptible to human variability, becoming infeasible in clinical trials and large population studies.1 We developed an imaging algorithm capable of automatically and accurately segmenting both hemorrhage and PHE from serial CT scans of patients with ICH. Such a tool will allow the ascertainment of these neuroimaging biomarkers from thousands of ICH patients, propelling investigations in multiple areas of ICH research.
METHODS
Study Design and Participants
We utilized data from two cohorts of ICH: the Yale Longitudinal ICH study (derivation cohort) and the Ethnic/Racial Variations of Intracerebral Hemorrhage (ERICH) study (validation cohort).2 Study participants in both provided informed consent. Imaging data are available upon reasonable request.
Delineation of Ground Truth Imaging Measures
Regions of hemorrhage and PHE were manually outlined on each slice of baseline and follow-up non-contrast CTs by three trained investigators (one assigned to each scan) using Analyze (version 11.0) or 3D Slicer (version 4.1) software to visualize the images, following guidelines outlined previously.3 All masks were reviewed for consistency and accuracy by a single investigator. We excluded infratentorial ICH cases and scans with excessive motion/artifacts. In 20 cases, we had one rater repeat delineation one week apart to assess intra-rater reliability, while in 40 cases we had two raters independently perform manual segmentation of hemorrhage and PHE.
Training of Automated Segmentation Algorithm
We implemented a fully convolutional neural network with 4 layers following the U-Net architecture (Supplemental Figure I).4 Output was a probability map of the likelihood that each voxel represented brain, hemorrhage, or PHE. For training, we used a stochastic gradient descent algorithm (Adam) with cross-entropy cost as the loss function. We used a mini-batch size of 10, a learning rate of 0.001, and dropout rate was set to 0.75 for network regularization.
Evaluation of the Algorithm Accuracy
Our primary measure of performance was the concordance between manual and automated hemorrhage and PHE volumes using Lin’s concordance coefficient (ρ). We also assessed bias as the median difference between automated and manual measurements and present limits of agreement (1.96 times the standard deviation) with Bland-Altman plots. Our secondary outcome was the Dice similarity coefficient (DSC), a measure of spatial overlap between two segmentations, with 0 being no overlap and 1 representing complete voxel-by-voxel agreement. These outcome measures were evaluated firstly using 10-fold cross-validation within the training dataset. Subsequently, in the testing phase, the resulting algorithm was applied to segment scans from ERICH. We also evaluated accuracy of human-versus-human segmentation in order to compare algorithm performance with intra- and inter-rater reliability among human experts.
RESULTS
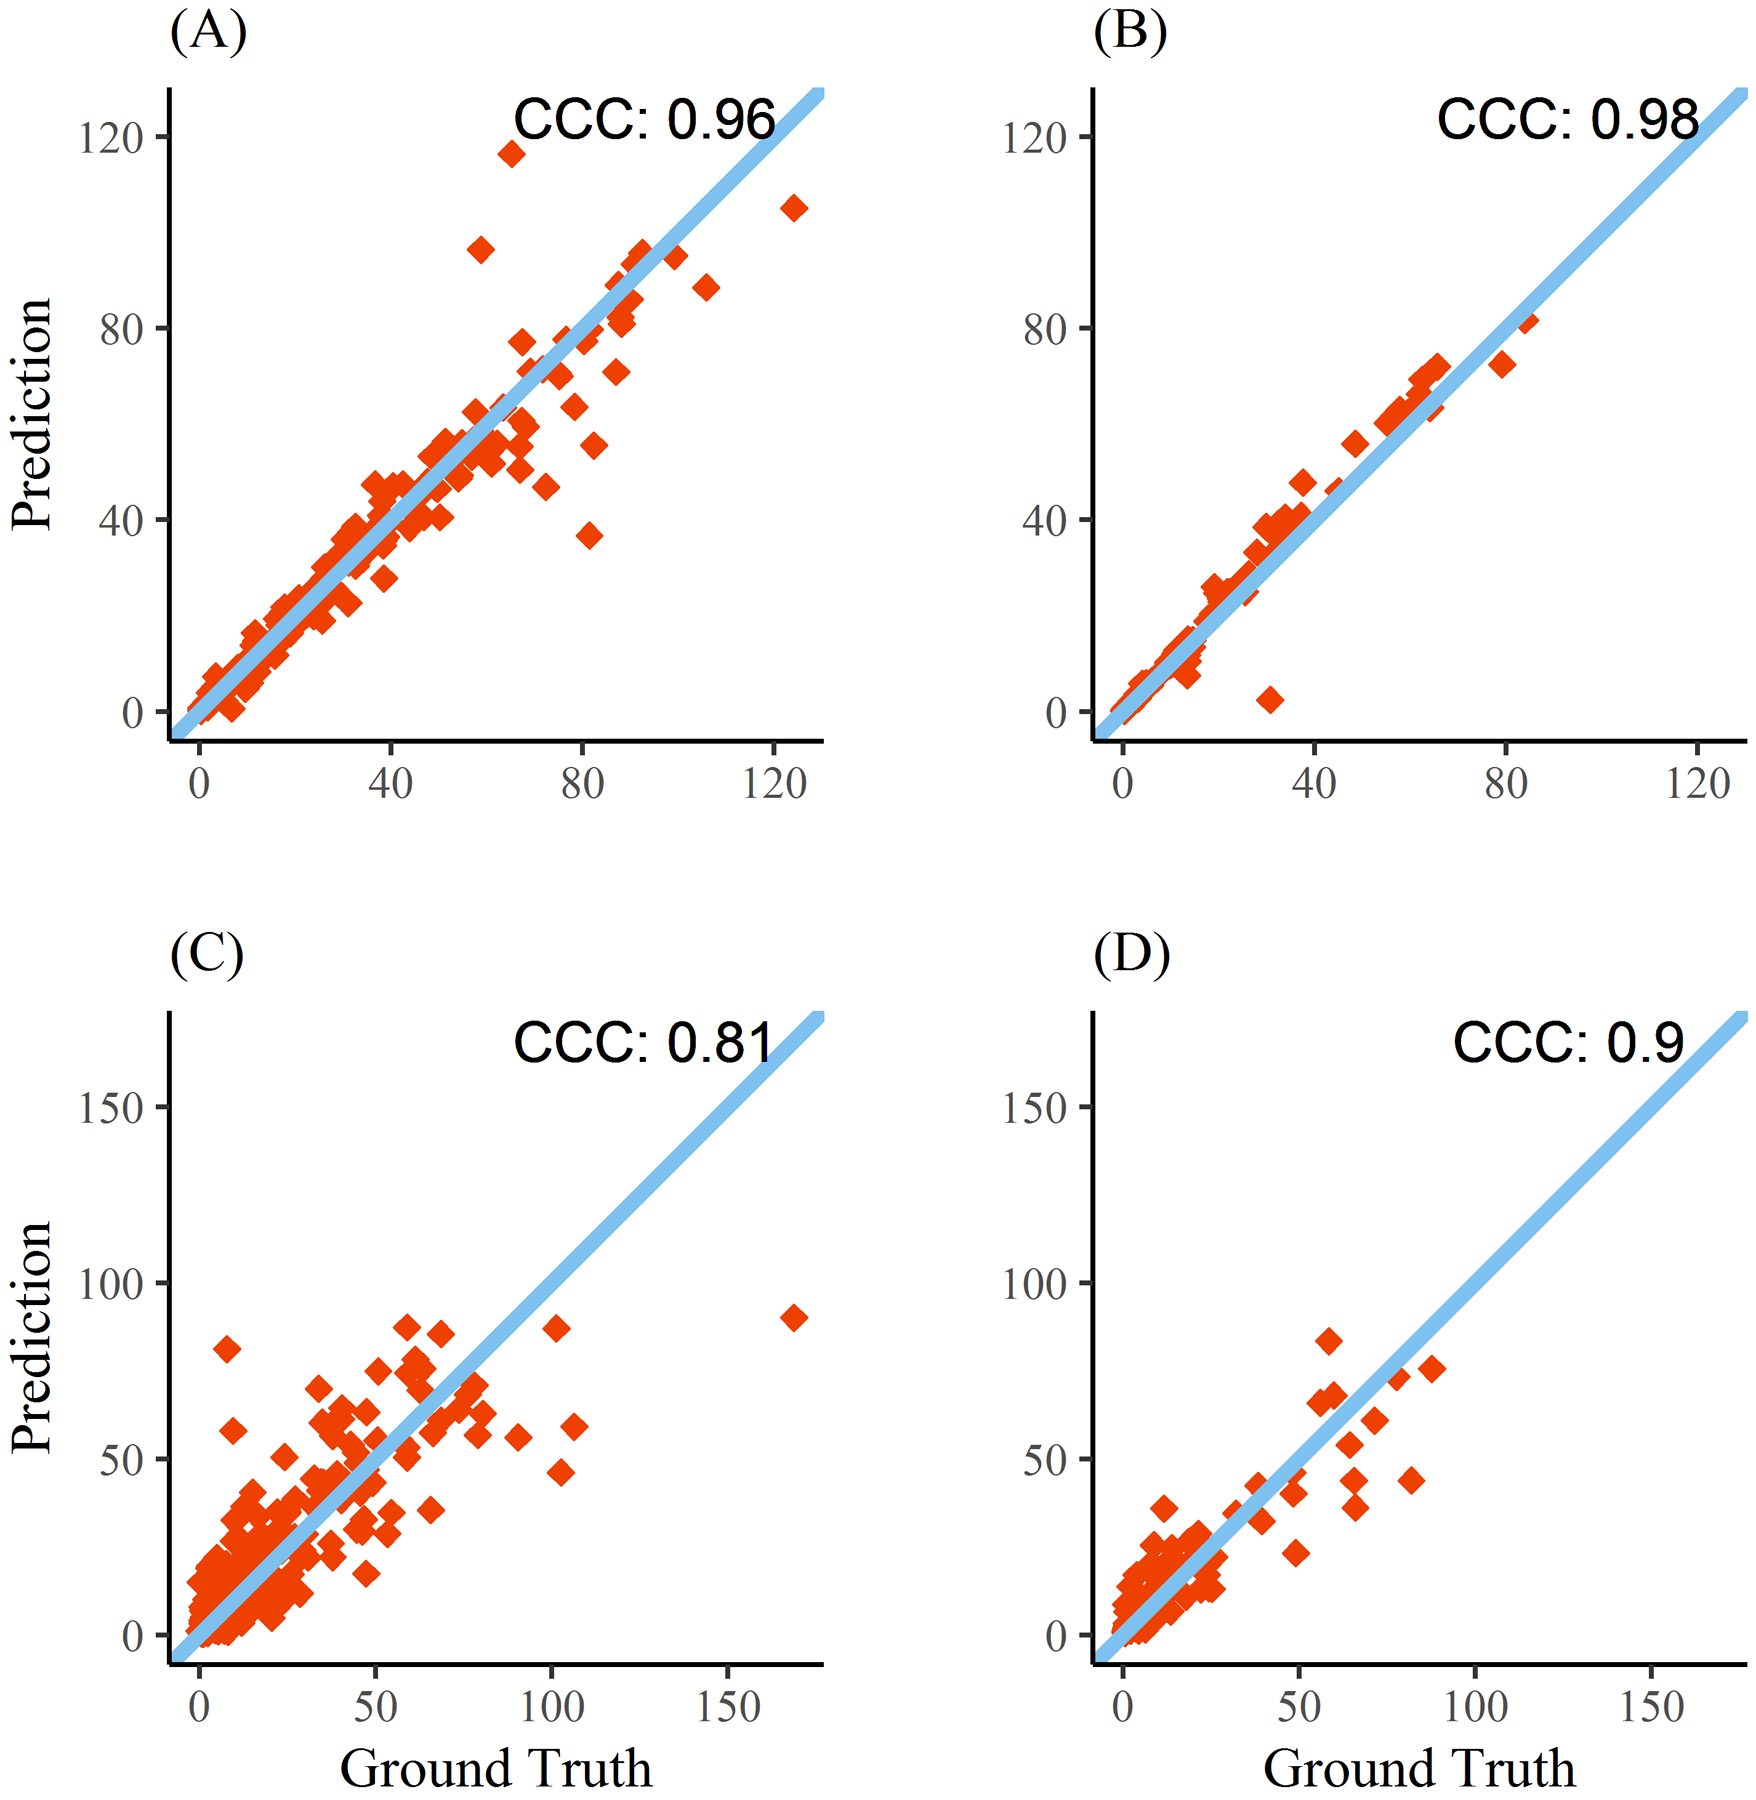
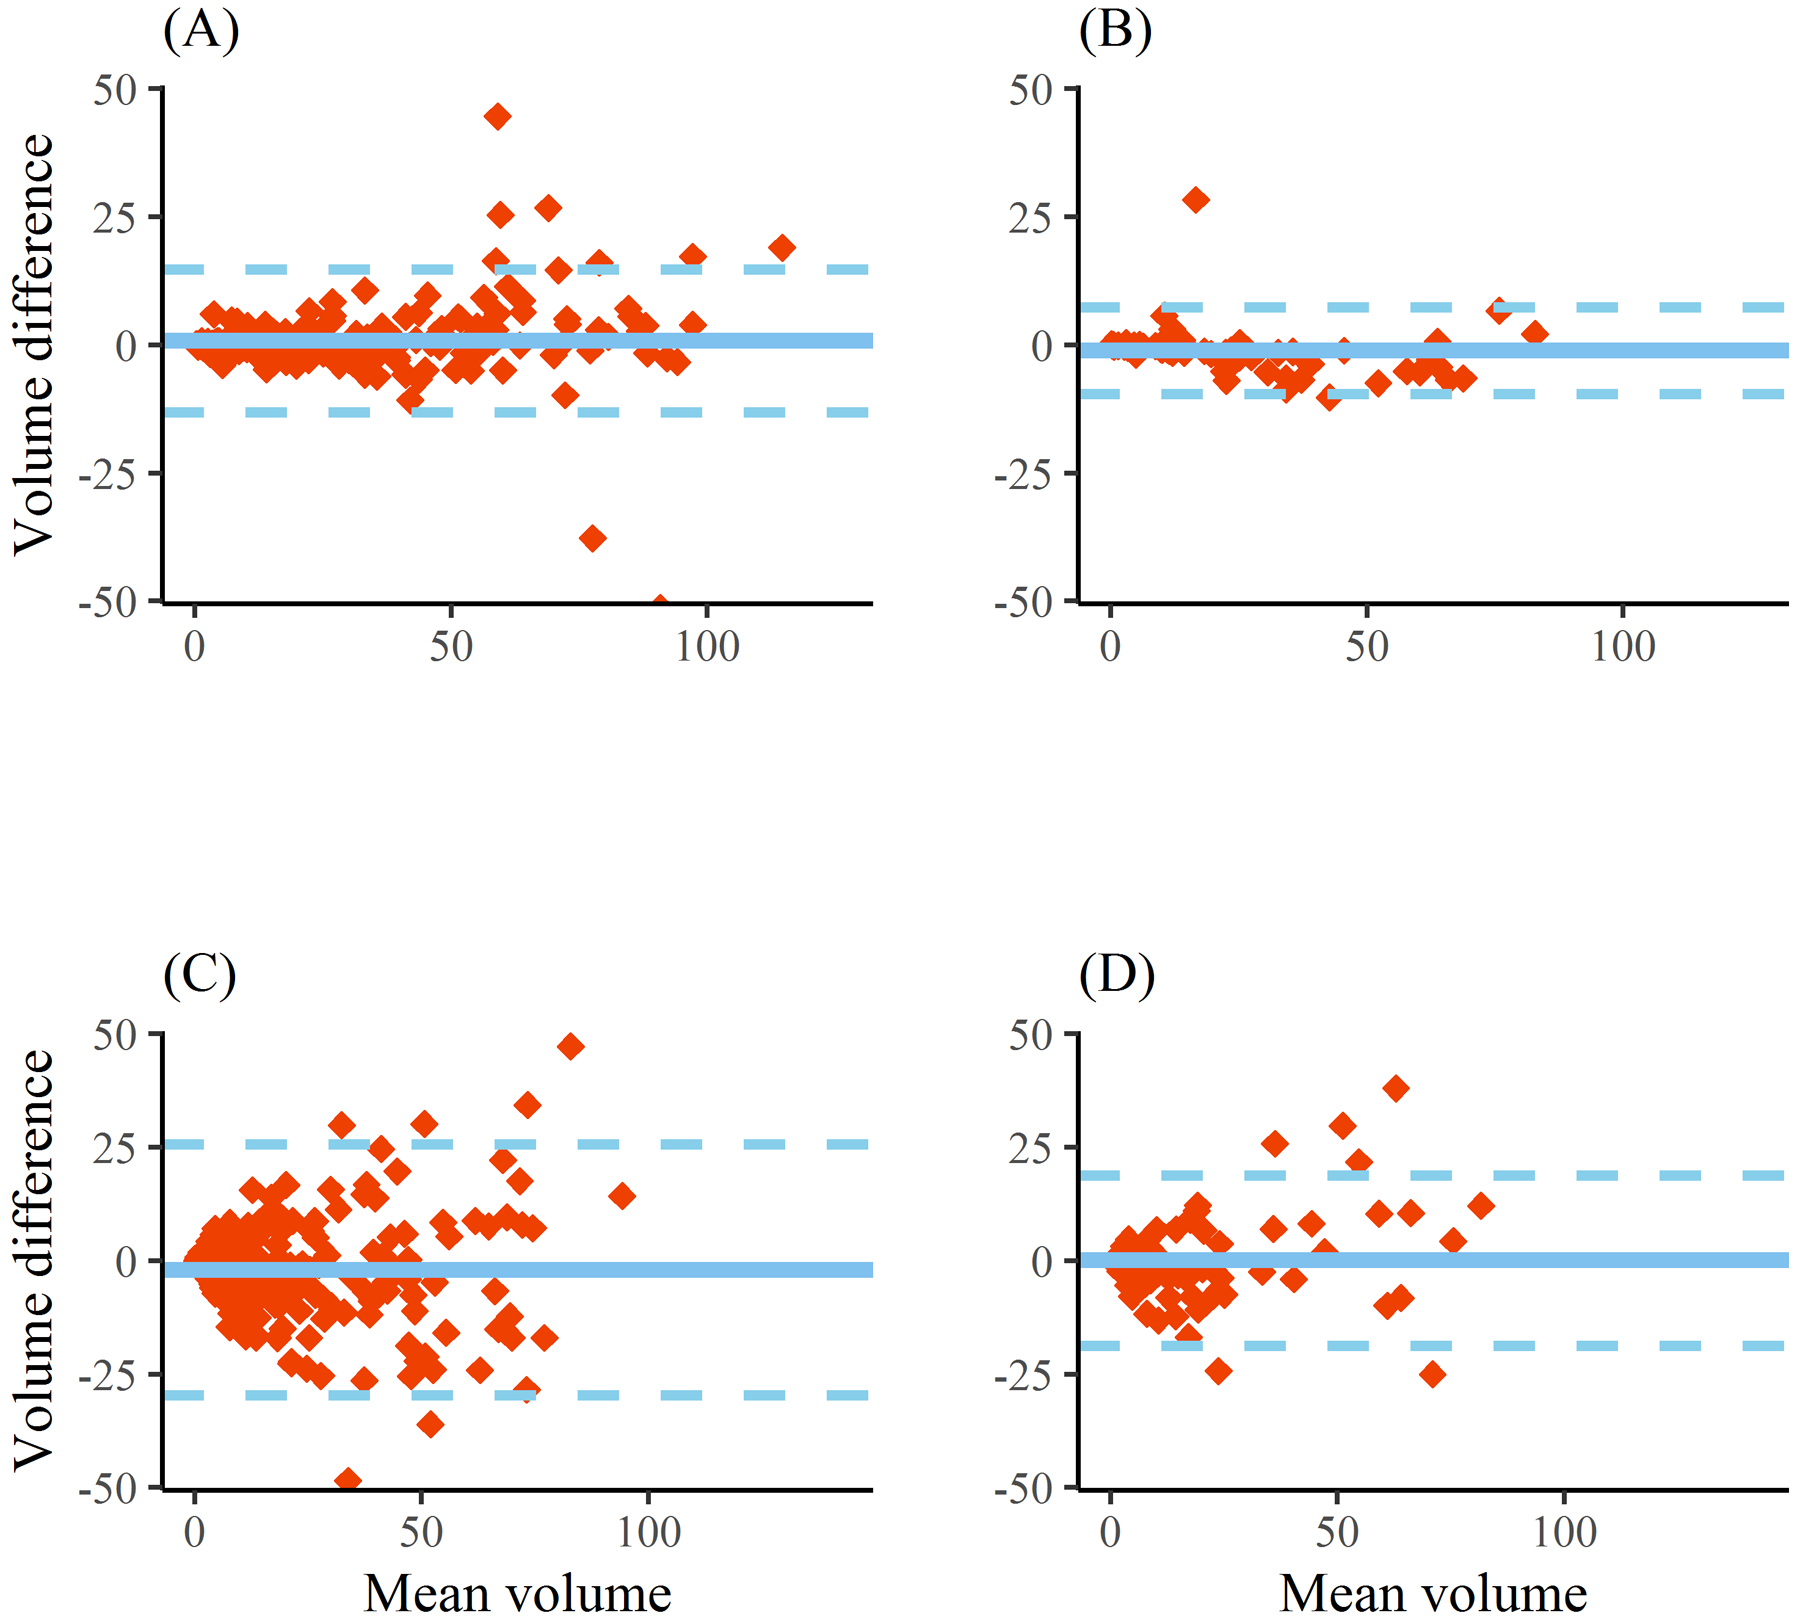
224 CTs from 124 patients with supratentorial ICH were utilized for algorithm derivation and cross-validation (Supplemental Table I). Processing time per CT using a single CPU/GPU machine was four minutes to segment both hemorrhage and PHE (see Supplemental Figure II for illustration). Automated hemorrhage volume displayed excellent concordance with manual measurements (ρ = 0.96, Figure 1, panel A). The median difference in measured volumes was 0.15-ml with limits of agreement from 14-ml below to 13-ml above ground-truth volume (Figure 2, panel A). DSC for hemorrhage segmentation was excellent at 0.90 (0.85–0.93) and did not vary by hemorrhage location, scan timing (baseline vs. follow-up) or whether IVH was present. Automated PHE volume also displayed good concordance (ρ = 0.81, Figure 1, panel C). The median difference in PHE volumes between methods was 1.5-ml with limits of agreement from −25 to +29 (Figure 2, panel C). Median DSC for PHE segmentation was 0.54 (IQR 0.39–0.65) and did not vary by scan timing. However, segmentation accuracy was significantly improved when IVH was absent than when it was present (0.57 vs.0.46), even after adjusting for hemorrhage and PHE volume (p=0.02).
Figure 1:

Concordance of manual with automated hemorrhage (top) and perihematomal edema (bottom) volumes. Results from the cross-validation (Yale cohort) are shown in panels A and C while results from the external (ERICH) cohort are shown in panels B and D. Line of identity is also plotted.
Figure 2:

Bland-Altman plots of automated measurement of hemorrhage volume (top) and perihematomal edema volume (bottom) compared with manual ground-truth for the entire derivation cohort (panels A and C) and for the validation (ERICH) cohort (panels B and D). Dotted lines represents limits of agreement (1.96 times standard deviation).
The algorithm was further evaluated on 84 scans from 45 subjects enrolled in ERICH. Concordance for hemorrhage volume was 0.98 (Figure 1, panel B) with median difference of 1-ml (limits of agreement −9 to +7-ml). Concordance of PHE volumes was 0.90 (0.85–0.93, Figure 1, panel D) with median difference 0.9-ml (limits of agreement −18 to +19-ml). Segmentation accuracy was almost identical to that seen with cross-validation (DSC 0.90 for hemorrhage, 0.55 for PHE).
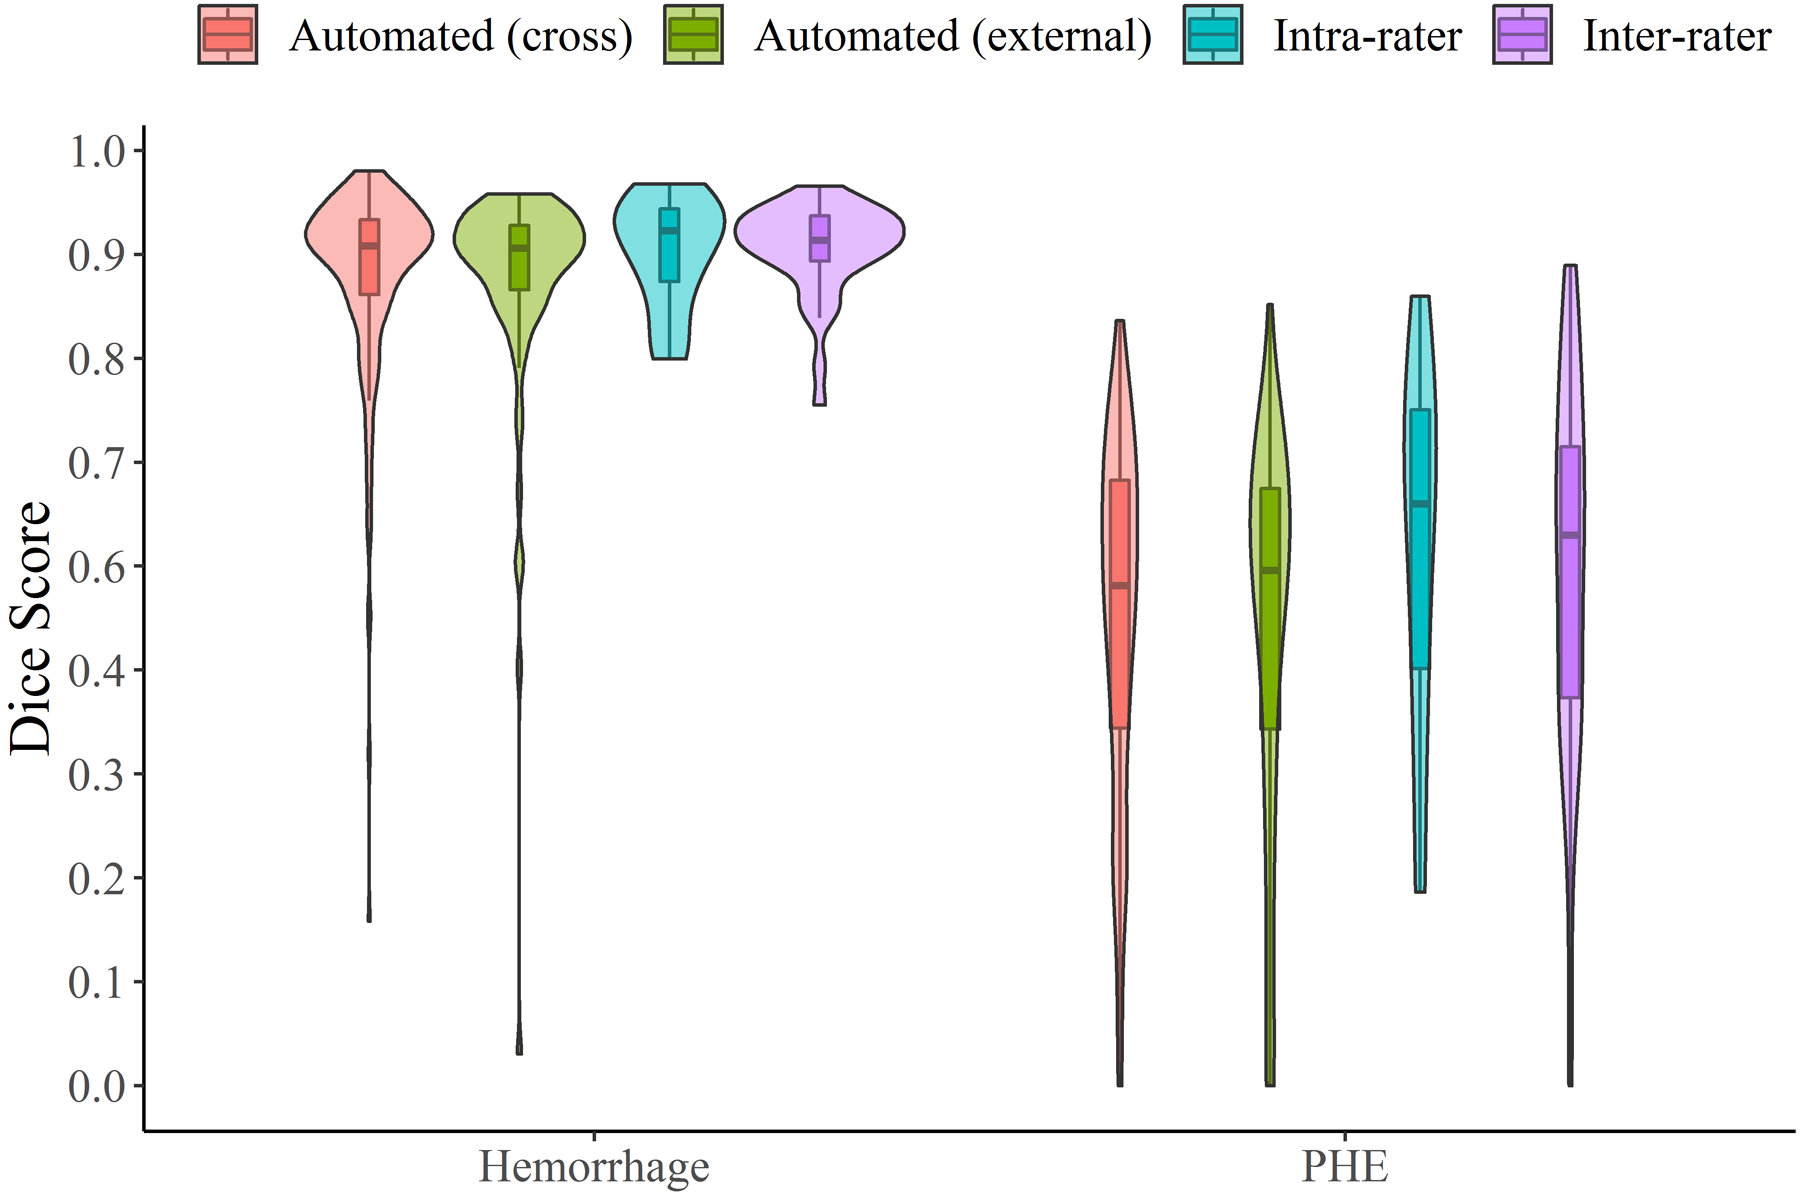
Among 40 scans with hemorrhage and PHE outlined by two different raters, median DSC between raters was 0.90 for hemorrhage and 0.57 for PHE. Concordance of volumes between raters was 0.97 for hemorrhage and 0.92 for PHE. For intra-rater reliability, DSC was 0.89 for segmentation of hemorrhage and 0.62 for PHE (Figure 3). Concordance of volumes was 0.99 for hemorrhage and 0.83 for PHE. See Supplemental Table II for detailed results comparing algorithm performance to human segmentation.
Figure 3:

Dice similarity coefficients for segmentation of hemorrhage and perihematomal edema comparing manual to automated algorithm (red for cross-validation, green for external validation cohorts) and repeat testing by the same rater (i.e. intra-rater reliability, blue) and different rater (inter-rater, purple)
DISCUSSION
We trained and externally validated a neural network to automatically segment CT images of patients with ICH into regions of hemorrhage and perihematomal edema. Our algorithm is equivalent to the accuracy of humans to capture hemorrhage and PHE (as measured by inter-rater reliability). Accuracy was higher for automated and human delineation of hemorrhage than for PHE, as expected given than the latter is a poorly demarginated area of hypodensity around the ICH. In fact, the lower DSC for PHE may primarily reflect the variability and inaccuracies of human “gold standard” labeling of edema around ICH, which varied on retest even for a single rater.
Our algorithm is capable of rapidly and accurately measuring hemorrhage and PHE at different time points, capturing their evolution over time and enabling dynamic studies of these biomarkers in large cohorts. Manual measurement of ICH and PHE takes up to an hour per scan while our automated algorithm can obtain volumes in minutes; this means that biomarker ascertainment can be easily performed on thousands of ICH patients.. It may also provide more consistency in large datasets than human raters who manifest significant variability, especially for PHE. Moreover, because the algorithm eliminates “intra-rater” variability, longitudinal measures may be more accurate than human raters, even if the rater is the same individual. Our algorithm exhibited consistently high accuracy when applied to scans from several external sites, a critical but often under-appreciated validation step for machine learning algorithms.
Although some prior reports have used machine learning approaches to segment regions of hematoma in ICH, they have mostly relied on feature-based methods, such as random forests.5, 6 In contrast, our deep learning network does not rely on a priori imaging features, but instead learns and extracts the optimal network of features from the training data. In addition, there have been no published reports of algorithms able to segment both hemorrhage and PHE from the same scans.
This study has limitations. Machine learning approaches are susceptible to over-fitting and may lose accuracy when applied to disparate data. We validated the algorithm on a relatively small cohort of scans from outside sites and larger-scale validation should still be performed. Our algorithm was trained on ground-truth masks created by one of three different human raters, introducing variability in subjective human estimation. These “ground-truth” delineations might have been improved by utilizing the overlap of two concurrent human segmentations (which, as we have shown in a subset, varies between raters, especially for PHE). Furthermore, PHE was defined and therefore delineated as the hypodensity around ICH, a subjective estimate of secondary injury that still requires additional evaluation to better understand its biological significance. In addition, comparative studies should explore whether intensity-based thresholding (as has been proposed in the past) could extract PHE volumes as accurately as our neural network-based approach.7
Finally, we did not segment IVH separately from ICH, so hemorrhage volume encompasses both components. The accurate delineation of IVH from adjacent parenchymal hematoma has proven challenging even for experienced human raters.8 We are currently working to implement a processing pipeline capable of automatically importing, preprocessing, and segmenting CT scans to obtain volumetric results seamlessly in large cohorts.9 An imaging pipeline capable to processing thousands of images and extracting multiple relevant phenotypes would facilitate much deeper evaluations of injury mechanisms and outcomes after ICH.
Supplementary Material
Sources of Funding:
RD is supported by the NIH (K23NS099440); GF is supported by the NIH (K76AG059992, R03NS112859, and P30AG021342), the American Heart Association (18IDDG34280056), the Yale Pepper Scholar Award, and the Neurocritical Care Society Research Fellowship; DW is supported by the NIH (U01NS036695); TMG is supported by the NIH (P30AG021342, R01AG01756018, and K07AG043587); KS is supported by the NIH (U24NS107215, U24NS107136, U01NS106513, RO1NR018335), and the American Heart Association (17CSA335500004); JML is supported by the NIH (R01NS085419, U24NS107230, and R37NS110699)
Disclosures: KS receives grant support unrelated to this work from Astrocyte, Bard, Biogen, Hyperfine, and Novartis. KS also has a relevant patent issued from Alva Health; JML receives grant support unrelated to this work from Biogen and the Barnes-Jewish Hospital Foundation.
REFERENCES
- 1.Li N, Worthmann H, Heeren M, Schuppner R, Deb M, Tryc AB, et al. Temporal pattern of cytotoxic edema in the perihematomal region after intracerebral hemorrhage: A serial magnetic resonance imaging study. Stroke. 2013;44:1144–1146. [DOI] [PubMed] [Google Scholar]
- 2.Woo D, Rosand J, Kidwell C, McCauley JL, Osborne J, Brown MW, et al. The ethnic/racial variations of intracerebral hemorrhage (ERICH) study protocol. Stroke. 2013;44:e120–125. [DOI] [PMC free article] [PubMed] [Google Scholar]
- 3.Urday S, Beslow LA, Goldstein DW, Vashkevich A, Ayres AM, Battey TW, et al. Measurement of perihematomal edema in intracerebral hemorrhage. Stroke. 2015;46:1116–1119. [DOI] [PMC free article] [PubMed] [Google Scholar]
- 4.Ronneberger O, Fisher P, Brox T. U-net: Convolutional neural networks for biomedical image segmentation. In: Navab N, Hornegger J, Well W, Frangi A, eds. Medical image computing and computer-assisted intervention - miccai 2015 Lecture notes in computer science, vol 9351 Springer; 2015. [Google Scholar]
- 5.Muschelli J, Sweeney EM, Ullman NL, Vespa P, Hanley DF, Crainiceanu CM. Pitchperfect: Primary intracranial hemorrhage probability estimation using random forests on ct. Neuroimage Clin. 2017;14:379–390. [DOI] [PMC free article] [PubMed] [Google Scholar]
- 6.Scherer M, Cordes J, Younsi A, Sahin YA, Gotz M, Mohlenbruch M, et al. Development and validation of an automatic segmentation algorithm for quantification of intracerebral hemorrhage. Stroke. 2016;47:2776–2782. [DOI] [PubMed] [Google Scholar]
- 7.Volbers B, Staykov D, Wagner I, Dorfler A, Saake M, Schwab S, et al. Semi-automatic volumetric assessment of perihemorrhagic edema with computed tomography. Eur J Neurol. 2011;18:1323–1328. [DOI] [PubMed] [Google Scholar]
- 8.Dowlatshahi D, Kosior JC, Idris S, Eesa M, Dickhoff P, Joshi M, et al. Planimetric hematoma measurement in patients with intraventricular hemorrhage: is total volume a preferred target for reliable analysis. Stroke. 2012; 43:1961–1963. [DOI] [PubMed] [Google Scholar]
- 9.Dhar R, Chen Y, An H, Lee JM. Application of machine learning to automated analysis of cerebral edema in large cohorts of ischemic stroke patients. Front Neurol. 2018;9:687. [DOI] [PMC free article] [PubMed] [Google Scholar]
Associated Data
This section collects any data citations, data availability statements, or supplementary materials included in this article.


