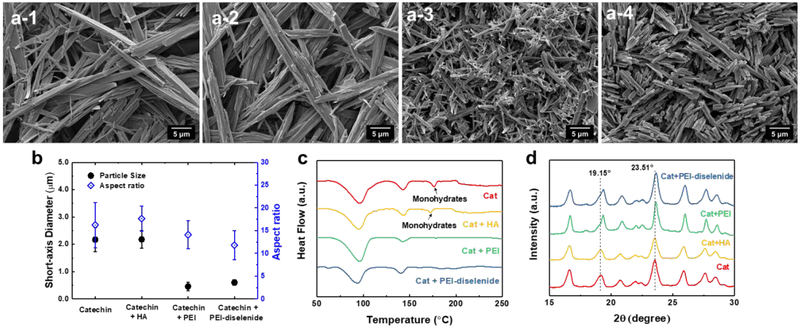
Figure 2.
Scanning electron micrographs of (a) pure catechin crystals (a-1), catechin recrystallized with (a-2) hyaluronic acid (HA), (a-3) polyethylenimine (PEI), and (a-4) PEI-diselenide. (b) Average short-axis diameter and aspect ratio of the catechin recrystallized with different polymers. (c) DSC thermogram and (d) X-ray diffraction patterns of the recrystallized catechin. In (b), data points and error bars represent mean values and standard deviation of 100 samples per condition, respectively.

