PLOS One logoLink to PLOS One
. 2020 Jan 31;15(1):e0228359. doi: 10.1371/journal.pone.0228359

Immune responses to Mycobacterium tuberculosis membrane-associated antigens including alpha crystallin can potentially discriminate between latent infection and active tuberculosis disease

Shashi Kant Kumar 1, Suvrat Arya 1, Amita Aggarwal 1, Prerna Kapoor 2, Alok Nath 3, Ramnath Misra 1, Sudhir Sinha 1,*
Editor: Katalin Andrea Wilkinson4
PMCID: PMC6994005  PMID: 32004357

Abstract

Changes in expression of membrane antigens may accompany the transition of Mycobacterium tuberculosis (Mtb) from ‘dormant’ to ‘active’ states. We have determined whether antibody and T cell responses to Mtb membrane (MtM)-associated antigens, especially the latency-induced protein alpha crystallin (Acr), can discriminate between latent tuberculosis infection (LTBI) and active TB (ATB) disease. Study subjects comprised a previously described cohort of healthcare workers (HCWs, n = 43) and smear-positive ATB patients (n = 10). HCWs were further categorized as occupational contacts (OC, n = 30), household contacts of TB (HC, n = 8) and cured TB (CTB, n = 5). Levels (ΔOD) of serum antibody isotypes (IgG, IgA and IgM) were determined by ELISA and blood T cell proliferative responses were determined by flow cytometry using Ki67 protein as marker for DNA synthesis. Antibodies to MtM and Acr were predominantly IgG and their levels in HCWs and ATB did not differ significantly. However, HCWs showed a significantly higher level of anti-MtM IgM and a significantly lower level of anti-Acr IgA antibodies than the ATB patients. Also, a larger proportion of HCWs showed a high (>1) ΔODAcr/ΔODMtM ratio for IgG. HCWs also showed a higher, though not significantly different from ATB, avidity of anti-MtM (IgG) antibodies. A higher proportion of HCWs (35% of OC, 62.5% of HC and 20% of CTB), compared with ATB (10%) showed a positive T cell response to Acr along with significant difference (P <0.05) between HC and ATB. A significant correlation (r = 0.60, P <0.0001) was noted between T cell responses of HCWs towards Acr and MtM (reported earlier by us) and both responses tended to decline with rising exposure to the infection. Even so, positive responses to Acr (38.5%) were significantly lower than to MtM (92%). Neither antibody nor T cell responses to either antigen appeared affected by BCG vaccination or reactivity to tuberculin. Results of the study suggest that the levels of IgM antibodies to MtM, IgA antibodies to Acr and proliferative T cell responses to both the antigens can potentially discriminate between LTBI and active TB disease. They also underscore the necessity of SOPs for antibody assays.

Introduction

A sustained 20% decline in incidence of tuberculosis (TB) is needed to meet the goals of ‘End TB’ strategy whereas current rate of decline is only about 2% [1]. The situation is particularly alarming in TB hyperendemic countries such as India, where a significant proportion of disease remains undetected [1]. A major population of these countries also harbors ‘latent TB infection (LTBI)’ defined as ‘a state of persistent immune responsiveness to Mycobacterium tuberculosis (Mtb) without clinically manifested disease’. The lifetime (mostly 5-year) risk of reactivation of LTBI leading to active TB disease is about 10% [1]. In this scenario, a biomarker which can distinguish between quiescent and active infections may help identify persons who could benefit from prophylactic measures [2].

The widely used tuberculin skin test (TST) and interferon-gamma release assays (IGRAs) estimate an existing immune response to Mtb hence provide only a ‘presumptive’ evidence of infection. Given that they show low specificity and sensitivity in low- and middle-income countries, WHO strongly recommends that both (IGRAs and TST) should not be used for diagnosis of TB or identification of persons at risk of developing TB [3]. Further, due to their comparable performances in different settings, replacing the TST by IGRAs as a public health intervention is not recommended [3]. The fact that neither test has the desired sensitivity to detect LTBI is also evident from a recent study from north India in which, during the follow-up period, incidence of TB in test-positive (TST or IGRA) and test-negative contacts was comparable [4]. Another recent report has suggested that certain differences in adaptive immunity in a subset of persons who are exposed to Mtb could be responsible for their test-negativity for TST and IGRA [5]. The authors did however not rule out the possibility that such test-negative subjects could actually be harboring LTBI.

Constituents of mycobacterial plasma membrane are potent inducers of innate and adaptive immune responses in humans [68]. We have reported on their capability to induce T cells of Indian leprosy and TB patients [9] as well as healthcare workers (HCWs) [10]. A genome-wide search has identified over 80 Mtb proteins, mostly of membrane origin, which were strong inducers of T cells from subjects with LTBI [11]. Recently, Li et al [12] used a panel of Mtb membrane proteins to identify antigens which produced stronger T cell responses in TB patients than did ESAT6 (a component of IGRA). With respect to B cell responses also, we have shown that sera of healthy Indians contain significantly higher levels of antibodies to membrane-associated than cytosolic antigens of Mtb [13, 14]. In another study, serum antibodies of TB patients reacted strongly with Mtb membrane (MtM) proteins [15]. In yet another study, antibodies secreted by B cells of TB patients and HCWs preferentially targeted MtM [16]. In an analysis of sera of TB suspects it was concluded that the Mtb ‘immunoproteome’ is rich in membrane-associated or secreted proteins and not cytoplasmic proteins [7]. One study [17] has reported that active TB patients produce low avidity antibodies, along with low IgG/IgM ratio, to ‘cell surface’ antigens of Mtb.

The Mtb membrane-associated heat-shock protein alpha crystallin (Acr/Rv2031c/HspX) is believed to sustain the bacilli during latent or dormant phase of infection [18, 19]. Its abundant production by dormant bacilli and restriction to Mtb complex [19, 20] qualify Acr as a potential biomarker for LTBI. Indeed, it is a strong inducer of both T and B cell responses and figures among most immunogenic proteins of Mtb [7, 21]. Compared to active TB disease, persons with LTBI have shown a stronger T cell response to Acr [2123] which was not influenced by BCG vaccination [23]. High levels of anti-Acr antibodies have been reported in TB patients and their contacts [21, 24, 25], HCWs exposed to Mtb [26] and cerebrospinal fluid of patients with tuberculous meningitis [27]. Conversely, some studies have found lower antibody levels in active than in inactive or latent TB [28]. Some of the studies have laid emphasis on isotype of anti-Acr antibody. Two of them have reported that IgA and IgG levels are higher in patients than in contacts or healthy subjects [29, 30] and one study has reported that children with TB have higher IgG and IgM levels as compared to healthy children [31]. Another study has found that the level of anti-Acr IgM is significantly higher in LTBI than in active TB [32].

The above-mentioned studies suggest that antibody and T cell responses to Mtb membrane and the membrane-associated antigen Acr can potentially discriminate between LTBI and active TB disease. It is therefore eminently desirable to explore if these responses can be translated into the much needed biomarkers for latent and/or active infections, particularly in TB hyperendemic situations. A critical requirement for their fair evaluation, which has not been met in past studies, is that they should be determined in the same study population. It also appears pertinent to ascertain whether antibody isotypes have any role as predictors of the state of infection. We have tried to address these and related queries in this study using a cohort of Indian HCWs and TB patients whose baseline characteristics, along with T cell responses to PPD (purified protein derivative of Mtb) and MtM were reported previously by us [10]. Our choice for HCWs was based on the fact that they, compared to population-at-large, carry a greater risk of contracting the Mtb infection [1, 33].

Materials and methods

Ethics statement

The study protocol was approved by the Institutional Ethics Committee of Sanjay Gandhi Postgraduate Institute of Medical Sciences (SGPGIMS), Lucknow (IEC Code No. 2016-149-IMP-EXP). Written informed consent was obtained from all participants.

Materials

A list of purchased materials used in this study is annexed as S1 Text.

Study subjects

The study subjects (n = 53) comprised a previously described cohort of HCWs and TB patients [10]. In brief, 30 of the 43 HCWs who had not lived with a TB patient in their households were classified as occupational contacts (OC). Eight HCWs, who had lived (> 1 year prior to the study) with a bacteriologically positive patient for at least 3 months were classified as household contacts (HC, according to WHO/HTM/TB/2012.9). Five HCWs had a history of cured TB (CTB, according to WHO/HTM/TB/2013.2). BCG scar was present in 81% and positive TST (≥ 10 mm induration) was recorded in 56% HCWs [10]. All 10 TB patients had bacteriologically confirmed active disease (according to WHO/HTM/TB/2013.2), with sputum-smears positive (1+ to 3+) for acid-fast bacilli. Xpert MTB/RIF assay (WHO/HTM/TB/2013.16) was performed in 2 patients who were suspected of drug resistance. However, both were found sensitive for RIF. Clinical records of remaining 8 patients did not suggest drug resistance. Nine patients were tested and found seronegative for HIV. In the remaining one patient (transferred to us from another clinic) also, we did not suspect HIV from her medical history.

Blood samples

Blood was collected by standard venipuncture in sodium heparin tubes (1 ml) for T cell assays and in plain tubes (3 ml) to prepare sera for antibody assays.

Mtb antigens

Mtb cell membrane (MtM) was isolated using the previously reported protocol [10]. In brief, 3 week old culture of Mtb (strain H37Ra, ATCC 25177) on Lowenstein-Jensen (L-J) medium was harvested and bacterial sediment was washed and suspended in PBS (0.2 g wet wt/ ml). The cell lysate obtained by sonication was centrifuged (23,000g) to settle unbroken cells and cell wall debris. The supernatant was re-centrifuged (150,000g) to obtain the membrane (sediment) and cytosol (supernatant). Membrane was washed and reconstituted with PBS and protein was estimated using a modified Lowry’s method suitable for membrane proteins [34]. This method was converted to micro-well plate format as follows. Dilutions of test protein and bovine serum albumin (BSA, as standard) were dispensed in flat-bottom 96-well plates (100 μl/ well). To each well, 200 μl alkaline copper reagent (containing 1% SDS) was added and mixed immediately by repeated pipeting. After 15 min, 20 μl of 1 N Folin’s reagent was also added to each well and mixed immediately. Color was developed (30 min) and absorbance was read at 750 nm on a plate reader. Standard curve was prepared by plotting the average (blank corrected) OD values for the applied BSA concentrations. The recombinant Mtb Acr protein was purchased from Lionex GmbH (Braunschweig, Germany, Cat. No. LRP-0019C). All protein aliquots were stored at -80°C. As a quality control measure, identity of Mtb growing on the L-J medium was validated periodically by immunochromatographic detection of MPT64 antigen [35] using a kit (‘SD Bioline TB Ag MPT64 Rapid’, Abbott, USA).

Enzyme-linked immunosorbent assay

A previously described protocol [13, 14] was used after necessary modifications. The used antigen concentrations and serum dilutions had provided optimal results during protocol development. Antigens (10 μg/ml MtM or 1 μg/ml Acr) in coating-buffer (0·05 M carbonate, pH 9·5) or coating-buffer alone were dispensed (50 μl/well) in U-bottom ELISA plates (Nunc Maxisorp) and incubated overnight at 4°C. After washing with tris-buffered saline (0·05 M Tris, 0·1 M NaCl, pH 7·4) containing 0·05% Tween 20 (TBS-T), the plates were incubated (2 h, 37°C) with blocking solution (2% skimmed milk powder dissolved in TBS-T, 100 μl/well). After removing the blocking solution, test sera (diluted 1:500 for MtM and 1:100 for Acr, in 1% milk-TBS-T) were dispensed in antigen- and buffer-coated wells (50 μl/ well, in duplicate wells) and incubated (2 h, 37°C). Plates were later washed with TBS-T and incubated (50 μl/ well, 2 h, 37°C) with affinity-purified peroxidase-conjugated antibodies to human IgG (diluted 1:4000 in 1% milk-TBS-T), IgA and IgM (both diluted 1:2000). Plates were finally washed with TBS-T and the substrate solution (0·04% o-phenylene diamine + 0·03% H2O2 in 0·05 M citrate phosphate buffer, pH 5) was added (50 μl/ well) and incubated at room temperature (20 min, in dark). Reaction was stopped by adding 7% H2SO4 (50 μl/ well). ODs were read at 492 nm on a plate reader. For each serum, difference in mean ODs of antigen- and buffer-coated wells was calculated and expressed as ΔOD.

Determination of subclass of IgG antibodies

A modification of the ELISA protocol described above was used. Briefly, after incubation of antigen-coated wells with test sera and subsequent washings, monoclonal antibodies to human IgG1, G2, G3 or G4 were added (50 μl/ well) and incubated (2 h, 37°C). After another round of washing, wells were incubated (2 h, 37°C) with peroxidase-conjugated anti-mouse IgG antibody (diluted 1:1000). Washed plates were finally incubated with substrate and stop solutions, and ODs were read.

Determination of avidity index

A previously reported protocol [36] was used for estimation of avidity index (AI) of IgG antibodies to MtM. In brief, the ELISA protocol described above was followed up to the stage of incubation of antigen-coated wells with test sera. Later, washed wells (in duplicate) were filled (50 μl/ well) with either PBS-T (PBS containing 0.05% Tween 20) or PBS-T containing 8 M urea and incubated for 10 min at 37°C. Washed wells were treated with peroxidase-conjugated secondary antibody, substrate and stop solutions as per above ELISA protocol. AI was calculated as follows: mean OD of urea-treated wells/ mean OD of untreated wells x 100.

We also tried an alternative protocol [5] for avidity determination. Accordingly, ELISA wells (after incubation with test sera) were treated with increasing concentrations of urea (0, 2, 4, 6 and 8 M) in order to determine its IC50 (50% inhibitory concentration). However, in 5 out of 6 tested sera, IC50 values were not achieved (S1 Fig); the reason for which could be difference in the nature of test antigens (PPD vs. MtM) and/or avidity of corresponding antibodies.

T cell proliferation assay

We used the previously described protocol [10] with some modifications. In brief, blood samples (diluted 1:10 in RPMI medium) were dispensed in 24-well culture plates (1 ml/ well) and incubated with test antigen (Acr, 5 μg/ml) and controls (culture medium as negative and PHA, 5 μg/ml, as positive control) for 5 days in a CO2 incubator. The cells were treated with EDTA (2 mM) and harvested. To re-suspended cells, fluorescent anti-CD3 antibody was added and incubated. For RBC lysis, cells were treated (2 ml/tube, 15 min, in dark) with a lysing solution (150 mM ammonium chloride, 14 mM sodium bicarbonate, 0.1 mM EDTA and 1% paraformaldehyde). Leukocytes (sediment) obtained after centrifugation were washed with PBS and fixed with 2% para-formaldehyde. Cells were again washed with PBS containing 0.05% BSA (PBS-BSA) and permeabilized with 0.2% Triton X100. After another wash with PBS-BSA, cells were incubated with fluorescent anti-Ki67 antibody. Cells were finally washed with PBS-BSA and re-suspended in PBS. Data on 105 cells in `lymphocyte gate' was acquired on a FACS Canto-II flow cytometer (BD) and analysed using FlowJo software v10.0.7 (Tree Star, USA). The gating strategy is shown in S2 Fig. Cut-off for a positive response was determined as 0.7% (= mean + 3 x SD of all responses to medium alone).

We also looked for a possible loss in T cell viability or their capacity to proliferate after 5 days in culture. Whole blood cultures were harvested and stained for CD3 as described above. After washing with PBS, cells were resuspended in PBS (0.5 ml). Without lysing the RBCs, 10 μl (1 μg) propidium iodide (PI) was added to each sample tube and immediately thereafter (within 5–10 min) cells were acquired on a flow cytometer [37]. For positive control, cells were fixed with 2% paraformaldehyde after CD3 staining and permeabilized with 0.2% Triton X-100 prior to PI treatment. S3 Fig shows results for a smear-positive (3+) ATB patient. In this case, over 90% of T cells remained viable after 5 days in culture and also showed a strong (95%) proliferative response to PHA.

Statistical analysis

As most datasets did not show normal distribution, they were analysed by non-parametric methods. Differences between grouped datasets were computed by Kruskal-Wallis test and those between two datasets were computed by either Wilcoxon matched pair signed rank test (for paired data) or Mann-Whitney test (for unpaired data). Correlation between two datasets was computed by Spearman’s method, and Fisher’s exact test (using 2x2 contingency tables) was used to compare two proportions. P values (two-tailed) of < 0.05 were considered as significant. All statistical analyses were performed using GraphPad Prism software.

Results

Study population

Demography of the study cohort (n = 53), comprising 43 HCWs and 10 ATB patients, has been described in our previous report [10]. Key demographic data are also provided in Materials and Methods.

Anti-MtM IgM and anti-Acr IgA antibodies can potentially discriminate between LTBI and active TB

Isotype-specific antibody responses of the study subjects against Mtb antigens- MtM and Acr are shown in Fig 1 and Table 1. The most readily detectable antibody isotype against both antigens was IgG. Anti-MtM IgG levels in OC, HC and ATB were significantly higher than the corresponding IgA and IgM levels (Fig 1A, S1 Table). Similarly, anti-Acr IgG levels were significantly higher than IgA levels in OC and HC and IgM levels in OC, HC and CTB (Fig 1B, S1 Table). Regarding other 2 antibody isotypes, levels of anti-MtM IgA and IgM did not differ in any of the 4 categories. However, anti-Acr IgA levels were significantly higher than IgM in OC, HC and ATB (S1 Table). Conspicuously, almost all ΔOD values for anti-Acr IgM were < 0, which occurred because OD values of buffer-coated ELISA wells were higher than those of antigen-coated wells. This phenomenon is further described below.

Fig 1.

Fig 1

Levels (ΔOD) of antibody isotypes (IgG, IgA and IgM) against MtM (panel A) and Acr (panel B) in HCWs (OC, n = 30; HC, n = 8; and CTB, n = 5) and ATB patients (n = 10). Each column shows individual values (dots) along with median and IQR (boxes). Whiskers connect minimum and maximum values. P values (< 0.05 considered as significant) for multiple comparisons (Kruskal-Wallis test) for each Ig class across 4 groups and 2 antigens are shown below x axis (below the horizontal lines). P values for differences within the groups (Mann-Whitney test) which had shown significant differences in Kruskal-Wallis test are given on top of corresponding columns.

Table 1. Levels of antibody isotypes against MtM and Acr in study subjects.

MtM Acr
IgG IgA IgM IgG IgA IgM
OC@ 0.30 (0.18–0.55)# 0.04 (0.03–0.08) 0.06 (0.03–0.16) 0.25 0.15–0.39) 0.03 (0.02–0.05) -0.09 (-0.15- -0.05)
HC 0.35 (0.25–0.46) 0.04 (0.03–0.07) 0.12 (0.04–0.20) 0.16 (0.11–0.49) 0.03 (0.01–0.03) -0.10 (-0.14- -0.08)
CTB 0.27 (0.20–0.48) 0.06 (0–0.16) 0.15 (0.03–0.18) 0.20 (0.19–0.43) 0.03 (0.02–0.05) -0.06 (-0.09- -0.04)
ATB 0.26 (0.12–0.72) 0.11 (0.03–0.14) -0.01 (-0.04–0.02) 0.08 (0.03–0.26) 0.06 (0.04–0.09) -0.07 (-0.10- -0.01)

@ Subject category (OC, occupational contact; HC, household contact; CTB, cured TB; ATB, active smear-positive TB).

# Median ΔOD (inter-quartile range, IQR).

Though the four subject categories did not differ from each other with respect to IgG responses against MtM or Acr (Fig 1), some differences were seen in corresponding IgM and IgA responses. The anti-MtM IgM antibody levels were significantly higher and anti-Acr IgA levels were significantly lower in HCWs (OC/HC/CTB) than in ATB. ROC (receiver operating characteristic) curves (Fig 2) also indicated that levels of both the antibodies could potentially discriminate between HCWs and ATB. AUC (ATB vs HCW pool) for anti-MtM IgM was 0.84 (95% CI, 0.65–1.02, P = 0.0009) and that for anti-Acr IgA, 0.83 (95% CI, 0.72–0.94, P = 0.0012). The ROC curves for all 3 HCW categories are also depicted in Fig 2. Accordingly, AUC for anti-MtM IgM were as follows: OC, 0.83 (95% CI, 0.64–1.02, P = 0.0022); HC, 0.86 (95% CI, 0.67–1.06, P = 0.01) and CTB, 0.87 (95% CI, 0.67–1.07, P = 0.0235). Likewise, AUC for anti-Acr IgA were: OC, 0.80 (95% CI, 0.65–0.93, P = 0.0057); HC, 0.93 (95% CI, 0.80–1.07, P = 0.0022) and CTB, 0.89 (95% CI, 0.68–1.1, P = 0.0169). These data also suggest that the AUC values for HCW pool and HCW categories were comparable.

Fig 2.

Fig 2

ROC curves with anti-MtM IgM (panel A) and anti-Acr IgA (panel B) antibody levels in HCWs (n = 43) and active TB (n = 10). The thick grey curve in both panels shows results with entire HCW pool and thin, colored curves (key in panel B) depict results for each HCW category: OC (n = 30), HC (n = 8) and CTB (n = 5).

We also looked for IgG subtype(s) against MtM in a subset of sera (n = 12, S4 Fig). IgG2 was found to be the most readily detectable subtype, with levels significantly higher than G1 (P = 0.001), G3 (P = 0.0127) or G4 (P = 0.002).

Essentially, these results indicated that serum antibodies against MtM or Acr were predominantly IgG (subtype IgG2) and its levels in HCWs and ATB patients did not differ significantly. Nonetheless, compared with ATB, the HCWs exhibited a significantly higher level of anti-MtM IgM and a significantly lower level of anti-Acr IgA antibodies.

IgG antibody levels against Acr were high or low in relation to the levels against MtM

A weak, though statistically significant correlation was seen between IgG responses to MtM and Acr (n = 53, r = 0.27, P = 0.0494; Fig 3A). Remarkably, in a proportion of subjects Acr produced a higher level of antibody than did MtM (Fig 3B) despite the former being only one of the many antigenic constituents of the latter [8, 12]. The proportion of subjects showing such a high (> 1) ΔODAcr/ΔODMtM ratio was as follows: OC, 27%; HC, 37.5%; CTB, 20% and ATB, 10% (Fig 3B). These results (particularly the trend between HC and ATB) suggested that the ratio of anti-Acr to anti-MtM IgG could decline with escalating exposure to the infection.

Fig 3. Relationship between IgG antibodies to Acr and MtM.

Fig 3

Panel A shows Spearman’s correlation (n = 53, r = 0.27, P = 0.0494) between two antibody levels (ΔODAcr and ΔODMtM). Panel B shows the ratio ΔODAcr/ΔODMtM in OC (n = 30), HC (n = 8), CTB (n = 5) and ATB (n = 10) subjects. Dotted line separates subjects showing a ratio of ≤1 and >1. Inset figure depicts proportion of subjects in each category showing a ratio of >1.

Avidity of anti-MtM IgG in ATB was lower but not significantly different from HCWs

Avidity of IgG antibodies against Mtb ‘cell-surface’ antigens has also been considered as a biomarker which could discriminate between active disease and latent TB infection [17, 38]. We therefore determined the avidity of anti-MtM (IgG) in all 10 ATB patients and 10 HCWs (OC) who had comparable antibody levels. Though the median avidity in ATB (AI = 41.75) was lower than that in OC (AI = 54.5,), the difference was not statistically significant (P = 0.1903) due mainly to a wider spread of data in case of ATB (IQR = 20.22–59.51 for ATB vs. 40.95–61.68 for OC) (Fig 4).

Fig 4. Avidity index of anti-MtM (IgG) antibodies present in HCW (OC) and ATB sera.

Fig 4

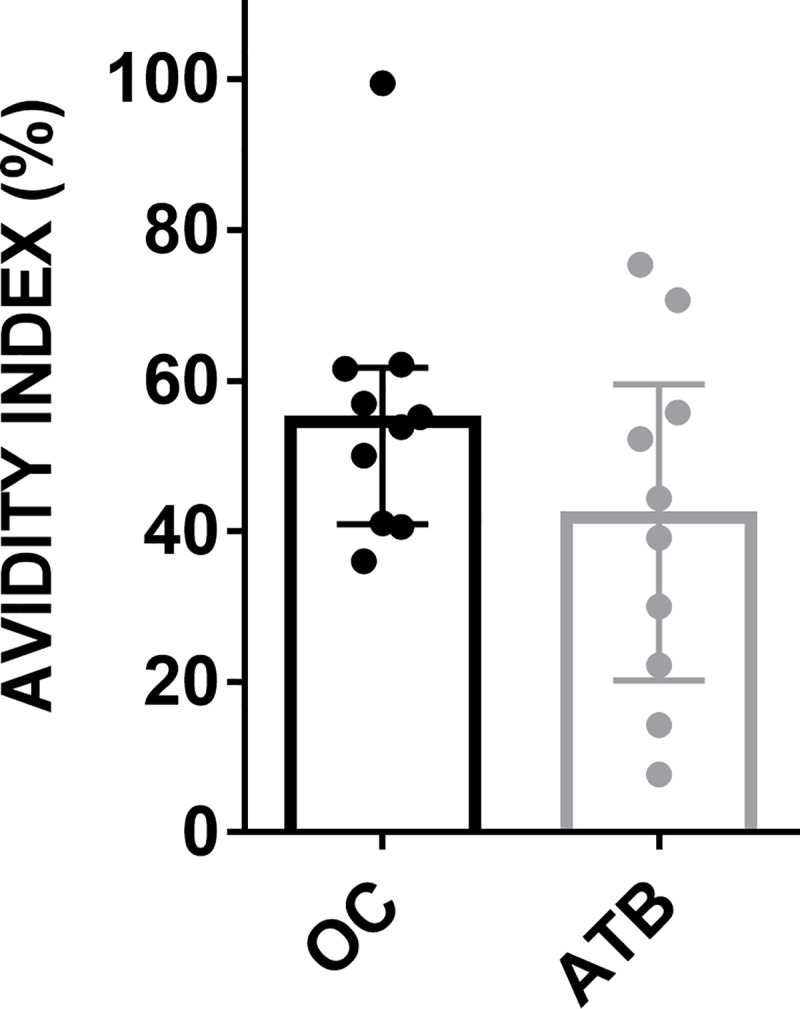
Individual AI values, along with median (bar height) and IQR are shown.

Serum immunoglobulins got bound non-specifically to ‘blocked’ ELISA plates

To our surprise, the calculated ΔOD value for anti-Acr IgM antibodies in most study subjects was < 0 (Fig 1B and Table 1). This happened because OD values of buffer-coated control wells were higher than the antigen-coated wells. To probe this phenomenon, we compared the extent of non-specific binding for all 3 antibody classes. Fig 5 shows the bindings of serum IgG, IgA and IgM to antigen- as well as buffer-coated ELISA wells. The largest difference in OD pairs was seen for IgG (median values for buffer- and antigen-coated wells, respectively, were 0.16 and 0.51 for MtM; and 0.17 and 0.37 for Acr), followed by IgA (0.12 and 0.17 for MtM, 0.07 and 0.12 for Acr) and IgM (0.14 and 0.17 for MtM, 0.28 and 0.22 for Acr). All differences in OD pairs were statistically significant (P = 0.0026 for anti-MtM IgM, and ≤ 0.0001 for the rest).

Fig 5. Non-specific binding of serum immunoglobulins to ELISA plates blocked with milk.

Fig 5

Binding (OD) of IgG, IgA and IgM to ELISA plate-wells coated with buffer (coating buffer) or antigen (MtM or Acr) are shown for 20 sera. Individual pairs of values are connected by solid lines.

While these results show that the test sera (at least at the used dilution) lacked detectable amounts of anti-Acr IgM, they also suggest that coating of ELISA wells with Acr blocked the non-specific binding of IgM more effectively than did milk. This phenomenon (blocking of IgM) may however not be seen with other Mtb antigens, as most study subjects (except ATB) showed a net positive (> 0) ΔOD value for anti-MtM IgM (Fig 1A, Table 1).

We also compared the blocking efficiencies of milk and bovine serum albumin in a subset of sera, which were found to be similar.

Compared to ATB a higher proportion of HCWs showed positive T cell response to Acr

Representative T cell proliferative responses of HCWs and ATB patients towards Acr are depicted in Fig 6. Culture medium alone served as negative control and PHA (a T cell mitogen) was used as a positive control. A relatively weak response to PHA in ATB represents the state of generalized depression in T cell responsiveness in a proportion of such patients [10].

Fig 6. Representative flow plots of proliferative T cell responses to culture medium, PHA and Acr in HCWs (OC, HC and CTB) and ATB patients.

Fig 6

Proliferating T cells (CD3+Ki67+) are located in the upper right quadrant of each plot.

Fig 7 shows individual T cell responses of the study subjects. Proportion of responders (showing a proliferative response above the cut-off for positivity) among HCWs was as follows: OC, 35%; HC, 62.5%; and CTB, 20%. The corresponding value for ATB (10%) was significantly lower than HC (P < 0.05). These results suggest that, akin to its ‘proportional’ antibody levels (Fig 3B), proliferative T cell responses to Acr could also adopt a declining trend following increase in the burden of infection.

Fig 7. Proliferative T cell responses of HCWs (OC, HC and CTB) and ATB patients to Acr.

Fig 7

Columns show individual responses (% CD3+Ki67+ cells) along with median and IQR. The proliferative responses to medium alone comprise all study subjects (n = 53). Dotted horizontal line denotes cut-off for a positive response (see Materials and Methods). Inset figure shows % responders in each category (P < 0.05 for the difference between HC and ATB).

Enhanced exposure to the infection may also enhance concordance between antibody and T cell responses to Acr

Despite a lack of correlation between T cell and antibody responses of HCWs towards Acr, some concordance was seen between the two responses, particularly in subjects of HC and CTB categories (S5 Fig). Three out of 5 HCs and the lone CTB who showed a positive T cell response to Acr also had a high proportional antibody level (ΔODAcr/ΔODMtM >1) against Acr. On the other hand, this overlap was present in only 2 out of 10 OCs. This observation, though not statistically significant, suggested that a higher exposure to infection could enhance concordance between antibody and T cell responses to Acr.

Antibody or T cell responses to Acr and MtM were not affected by responsiveness to tuberculin or vaccination with BCG

There are conflicting reports on association between immune responses to Acr and reactivity to tuberculin or vaccination with BCG [2124]. However, in the present cohort neither antibody nor T cell responses to Acr or MtM appeared affected by these variables. Both responses did not differ significantly between HCWs who were positive or negative for TST or BCG scar (Fig 8). Earlier, we had shown that their T cell responses to MtM were also not affected by TST or BCG [10].

Fig 8. Antibody and T cell responses to Acr and MtM were not affected by the presence or absence of reactivity towards TST or BCG scar.

Fig 8

Panels A-B show antibody responses (ΔOD) to Acr and MtM, and panel C shows proliferative T cell response (% CD3+Ki67+ cells) to Acr in 43 HCWs (pool of OC, HC and CTB). 24 HCWs were positive (+) and 19 negative (-) for TST. The BCG scar was present (+) in 35 and absent (-) in 8 HCWs. Differences between TST+/- or BCG +/- groups were not significant (all P values > 0.05). Dotted horizontal line in panel C depicts cutoff for a positive T cell response.

Proliferative T cell response to MtM antigens could serve as a sensitive marker for LTBI

A significant correlation (r = 0.60, P < 0.0001; Fig 9) was noted between proliferative T cell responses of HCWs to Acr (this study) and MtM (reported earlier by us, [10]). Similar to the trend witnessed for Acr (Fig 7), T cell responses to MtM had also declined with increasing burden of infection. However, despite these similarities, only 15 (38.5%) HCWs showed a positive response for Acr as compared to 36 (92%) who had shown positivity for MtM (P < 0.0001). Altogether, these results suggest that the T cell response to MtM could serve as a more sensitive marker for LTBI.

Fig 9. Correlation (Spearman’s r = 0.60, P < 0.0001) between T cell responses to Acr and MtM in HCWs (pooled data, n = 39).

Fig 9

The responses to MtM were taken from our earlier report [10]. Dotted lines represent cutoffs for a positive response to either antigen. Inset figure depicts % responders for each antigen.

Discussion

Reactivation of LTBI involves resumed multiplication of the dormant bacilli, which could also involve changes in their expressed antigens [7]. Indeed, Mtb overexpresses a characteristic set of genes and proteins, prominent among them being Acr, during the latent phase of infection [1820, 39]. As a corollary to this the immune responses to Mtb may be considered as dynamic, providing a basis for the discovery of novel biomarker(s) of disease progression [21, 22, 30, 40].

Serum antibodies to MtM and its constituent protein Acr were predominantly of IgG class (subclass IgG2), which is consistent with some earlier reports [14, 15, 21]. However, IgG levels against either antigen were unable to differentiate between HCWs and ATB patients. Any prior comparable study on anti-MtM IgG antibodies is not available, whereas available studies on the anti-Acr IgG antibodies have reported equivocal findings. According to some, their levels are low in ATB and high in LTBI [24, 28, 30] and, according to some others, these levels are high in ATB and low in LTBI [21, 25, 29, 41]. While demographic differences in study populations could have led to such diverse results, differences in antibody assay protocols (discussed below) may also have contributed to it.

Compared with ATB, all 3 categories of HCWs (OC, HC and CTB) showed a significantly higher level of anti-MtM IgM and a significantly lower level of anti-Acr IgA antibodies. Though there is no earlier report on the discriminatory potential of anti-MtM IgM antibodies, a study on antibodies to culture-filtrate antigens of Mtb in patients and contacts belonging to the same geographical region (Pakistan) had shown similar results [42]. The authors had reported that, as compared to healthy controls, contacts of TB patients (having cavitory lung disease) had significantly higher levels of IgM antibodies; and concluded that intense exposure of the contacts to Mtb may have led to activation of the innate immune system including IgM antibodies. Polymeric IgM is believed to contribute towards initial defense against invading pathogens until a more specific adaptive immune response takes over. In a model of malaria, IgM+ memory B cells (MBCs) were early responders and dominant producers of antibody-secreting cells [43]. Such MBCs constitutively express toll-like receptors (TLRs) and can proliferate and secrete IgM upon stimulation with TLR-ligands such as cell-wall glycolipids of Mtb. With respect to anti-Acr IgA antibodies, several past studies have highlighted their diagnostic potential. Similar to our findings, Awoniyi et al [44] had also found a significantly higher level of these antibodies in TB patients (compared to LTBI) along with a large area under ROC curves (0.93, in our case it was 0.83). Further, like us, they had also observed a significant decline in their levels after successful treatment. Some other studies highlighting the diagnostic potential of anti-Acr IgA antibodies have been conducted by Abebe at al [29], Davidow et al [30], Legesse et al [41] and Talavera-Paulin et al [45]. Collectively, these studies emphasize the need to further explore the potential of anti-MtM IgM and anti-Acr IgA antibodies for the discrimination between HCWs and ATB.

In a proportion of study subjects the levels of IgG antibodies against Acr were higher than those against MtM, despite the fact that Acr is only one of the several antigenic constituents of MtM [8, 12]. More interestingly, the proportion of subjects showing a high (>1) ΔODAcr/ΔODMtM ratio declined with increasing severity of the infection. This observation is consistent with the reported excessive production of Acr by the dormant bacilli and its reversion to normal levels upon resumption of their exponential growth [18]. It also finds support in some prior studies which have shown that anti-Acr IgG levels are lower in active TB than in LTBI [24, 28, 30]. It could therefore be worthwhile to determine whether a decline in the ratio of anti-Acr to anti-MtM antibodies signals reactivation of LTBI.

We also compared the avidity of anti-MtM IgG antibodies in the sera of HCWs and ATB patients, since it has been proposed that the difference in their avidities could help discriminate between ATB and LTBI. We found that the avidity of antibodies in ATB were lower than that in HCWs. However, this difference was not statistically significant due to a wide variation in avidity in the patients. Earlier studies on the avidity of IgG antibodies against Mtb ‘cell-surface’ antigens have shown contradictory results. Perley et al [17] had shown a lower avidity, whereas Arias-Bouda et al [38] had shown a higher avidity of these antibodies in ATB patients compared to LTBI. Such variation in results is not entirely unexpected, considering the known heterogeneity in antibody responses of patients [46]. In addition, these variations could also have been caused by differences in the used protocol for avidity determinations [5, 17, 38].

Binding of serum Igs to plastic surfaces is a well known phenomenon, the reason for which is rather obscure [47]. Since none of the blocking agents completely block this non-specific adsorption, it is considered essential to determine the binding of Igs to antigen-coated as well as buffer-coated ELISA plate-wells so as to deduce antigen-specific bindings. Indeed, there are examples where OD values of buffer-coated wells were equal to or even higher than the antigen-coated wells [48, 49]. We encountered a similar phenomenon in this study, which resulted in ‘negative’ (< 0) ΔOD values for anti-Acr IgM antibodies. This observation was in complete contrast to some of the earlier studies which have shown high levels (OD >1.5) of anti-Acr IgM antibodies in ATB patients as well as healthy contacts [29, 32, 45, 50]. Apart from the demographic differences in study populations, such discrepant results may also occur due to purely technical reasons. Determination of non-specific Ig bindings is frequently given a miss by investigators and corresponding controls are not even included in the commercial ELISA kits. False positive results are a major concern for serological antibody assays and the problem is worsened with the use of lower serum dilutions so as to achieve higher assay sensitivities. Lack of SOPs for ELISA has been flagged repeatedly [51] and is the main reason behind their descent as a diagnostic tool for TB [52].

Compared with ATB, a higher proportion of HCWs was positive for the proliferative T cell response to Acr. Indeed, this proportion was significantly high in HC. These results are consistent with those reported for British [21] and African [22] cohorts wherein strongest T cell responses to Acr were seen in latently infected healthy individuals and the responses of TB patients were significantly low. TB patients in the British cohort were further classified according to severity of the infection which revealed its inverse relationship with the response to Acr. Based on this observation, the authors concluded that containment of Mtb infection may partly be mediated by T cells responding to Acr [21]. Likewise, our results also suggest that the T cell response to Acr may adopt a downward trend with increasing exposure to the infection. With respect to association between T cell and antibody responses to Acr, both did coexist in a small proportion of subjects- particularly those who had elevated exposure to infection. This finding was also consistent with that of Wilkinson et al [21] and underscores the emerging view that containment of Mtb infection is a finely orchestrated phenomenon wherein both T cells and antibodies are likely to play complementary roles [14].

The T cell responses of HCWs towards Acr correlated significantly with those towards MtM (reported earlier by us [10]). Even so, a significantly higher proportion of them had shown a positive response to MtM suggesting that it could serve as a more sensitive marker of LTBI. Several studies in the past have reported that the T cell response in subjects with LTBI is primarily directed at MtM-associated antigens [1012]. In our previous study [10], it also closely reflected the prevalence of LTBI in India which, according to a study based on T cell responses to Mtb antigens ESAT6, CFP10 and PPD, was found to be over 90% [53]. This estimate may appear alarmingly high but is commensurate the fact that India is home to over a quarter of TB patients worldwide, nearly a million of whom may be ‘missing’ from the records [1].

We did not see any effect of reactivity towards tuberculin or vaccination with BCG on the antibody or T cell responses to Acr, which is in agreement with some earlier reports [22, 23]. Though in some other studies [21, 24] the BCG vaccinees had shown a positive T cell or antibody response to Acr, the possibility of such persons being exposed to Mtb was not ruled out. Earlier, we had shown that the T cell response to MtM was also not influenced by tuberculin reactivity or BCG vaccination [10].

A relatively small sample size may be considered as a limitation of this study as it could potentially dilute the robustness of drawn conclusions. Even so, these results generate a reasonable degree of confidence since key findings are well-supported by earlier studies. Another important limitation of the study is that, being cross-sectional nature, it did not attempt to determine the predictive value of the described biomarkers. Here it is worth recalling that the primary objective of this study was to comparatively evaluate some of the potential biomarkers with the view to narrow down the choices rather than choosing any one of them. It is well recognized that, due to the low rate of reactivation of LTBI over a protracted period of time, validation of any new biomarker would require a long prospective follow-up of a much larger cohort [2].

To conclude, this study has evaluated the immune responses to Mtb membrane (MtM) and the membrane-associated antigen Acr for detection as well as prediction of the outcome of LTBI in a TB hyperendemic setting. With respect to the value of antibody responses, IgM and IgA class of antibodies to MtM and Acr showed a much greater promise than corresponding IgG antibodies. However, it must be emphasized that the antibody levels reported in this study (and also in most of earlier studies) are ‘semi-quantitative’ in nature, hence may lack the required degree of robustness. For the present, it appears prudent to focus attention on the T cell responses which also find good support from earlier studies. In this respect, this study draws attention, apart from Acr, to MtM as a rich source of antigens which could serve as more reliable predictors of LTBI. However, a more extensive study of Mtb membrane antigens would give a better understanding to select the correct antigens for these assays.

Supporting information

S1 Text. Purchased materials.

(PDF)

S1 Fig. Avidity determination for anti-MtM antibodies.

(PDF)

S2 Fig. Gating strategy.

(PDF)

S3 Fig. Representative data on viability and proliferative capacity of T cells.

(PDF)

S4 Fig. Levels of IgG subclasses against MtM.

(PDF)

S5 Fig. Concordance between T cell and antibody responses to Acr.

(PDF)

S1 File. Raw data for figures and table.

(PDF)

S1 Table. Significance of differences (P values) in antibody levels.

(PDF)

Acknowledgments

We are grateful to the host Institute (SGPGIMS, Lucknow) for laboratory support. SS is an Emeritus Scientist and SKK is a Senior Research Fellow of Indian Council of Medical Research.

Data Availability

All relevant data are within the paper and its Supporting Information files.

Funding Statement

The authors received no specific funding for this work.

References

  • 1.World Health Organization. 2018. Global Tuberculosis Report 2018.
  • 2.World Health Organization. 2017. Consensus meeting report: development of a Target Product Profile (TPP) and a framework for evaluation for a test for predicting progression from tuberculosis infection to active disease (WHO/HTM/TB/2017.18).
  • 3.World Health Organization. 2011. Use of tuberculosis interferon-gamma release assays (IGRAs) in low- and middle-income countries: policy statement (WHO/HTM/TB/2011.18). [PubMed]
  • 4.Sharma SK, Vashishtha R, Chauhan LS, Sreenivas V, Seth D. 2017. Comparison of TST and IGRA in Diagnosis of Latent Tuberculosis Infection in a High TB-Burden Setting. PLoS ONE 12: e0169539 10.1371/journal.pone.0169539 [DOI] [PMC free article] [PubMed] [Google Scholar]
  • 5.Lu LL, Smith MT, Yu KKQ, Luedemann C, Suscovich TJ, Grace PS, et al. 2019. IFN-γ-independent immune markers of Mycobacterium tuberculosis exposure. Nat Med 25:977–987. 10.1038/s41591-019-0441-3 [DOI] [PMC free article] [PubMed] [Google Scholar]
  • 6.Underhill DM, Ozinsky A, Smith KD, Aderem A. 1999. Toll-like receptor-2 mediates mycobacteria-induced proinflammatory signaling in macrophages. Proc. Natl. Acad. Sci. USA 96:14459–14463. 10.1073/pnas.96.25.14459 [DOI] [PMC free article] [PubMed] [Google Scholar]
  • 7.Kunnath-Velayudhan S, Salamon H, Wang HY, Davidow AL, Molina DM, Huynh VT, et al. 2010. Dynamic antibody responses to the Mycobacterium tuberculosis proteome. Proc Natl Acad Sci USA 107: 14703–14708. 10.1073/pnas.1009080107 [DOI] [PMC free article] [PubMed] [Google Scholar]
  • 8.Sinha S, Kosalai K, Arora S, Namane A, Sharma P, Gaikwad AN, et al. 2005. Immunogenic membrane-associated proteins of Mycobacterium tuberculosis revealed by proteomics. Microbiology 151:2411–2419. 10.1099/mic.0.27799-0 [DOI] [PubMed] [Google Scholar]
  • 9.Mehrotra J, Mittal A, Rastogi AK, Jaiswal AK, Bhandari NK, Sinha S. 1999. Antigenic definition of plasma membrane proteins of BCG: Predominant activation of human T cells by low molecular weight integral proteins. Scand J Immunol 50: 411–419. 10.1046/j.1365-3083.1999.00616.x [DOI] [PubMed] [Google Scholar]
  • 10.Arya S, Kumar SK, Nath A, Kapoor P, Aggarwal A, Misra R, et al. 2018. Synergy between tuberculin skin test and proliferative T cell responses to PPD or cell-membrane antigens of Mycobacterium tuberculosis for detection of latent TB infection in a high disease-burden setting. PLoS One 13: e0204429 10.1371/journal.pone.0204429 [DOI] [PMC free article] [PubMed] [Google Scholar]
  • 11.Lindestam Arlehamn CS, Gerasimova A, Mele F, Henderson R, Swann J, Greenbaum JA, et al. 2013. Memory T Cells in Latent Mycobacterium tuberculosis Infection Are Directed against Three Antigenic Islands and Largely Contained in a CXCR3+CCR6+ Th1 Subset. PLoS Pathog 9: e1003130 10.1371/journal.ppat.1003130 [DOI] [PMC free article] [PubMed] [Google Scholar]
  • 12.Li H, Liu L, Zhang W, Zhang X, Zheng J, Li L, et al. 2019. Analysis of the Antigenic properties of membrane proteins of Mycobacterium tuberculosis. Scientific Reports 9: 3042 10.1038/s41598-019-39402-z [DOI] [PMC free article] [PubMed] [Google Scholar]
  • 13.Gaikwad AN, Sinha S. 2008. Determinants of natural immunity against tuberculosis in an endemic setting: factors operating at the level of macrophage- Mycobacterium tuberculosis interaction. Clin Exp Immunol. 151: 414–422. 10.1111/j.1365-2249.2007.03585.x [DOI] [PMC free article] [PubMed] [Google Scholar]
  • 14.Kumar SK, Singh P, Sinha S. 2015. Naturally produced opsonizing antibodies restrict the survival of Mycobacterium tuberculosis in human macrophages by augmenting phagosome maturation. Open Biol 5:150171 10.1098/rsob.150171 [DOI] [PMC free article] [PubMed] [Google Scholar]
  • 15.Ziegenbalg A, Prados-Rosales R, Jenny-Avital ER, Kim RS, Casadevall A, Achkar JM. 2013. Immunogenicity of mycobacterial vesicles in humans: identification of a new tuberculosis antibody biomarker. Tuberculosis 93:448–55. 10.1016/j.tube.2013.03.001 [DOI] [PMC free article] [PubMed] [Google Scholar]
  • 16.Zimmermann N, Thormann V, Hu B, Köhler AB, Imai-Matsushima A, Locht C, et al. 2016. Human isotype-dependent inhibitory antibodies responses against Mycobacterium tuberculosis. EMBO Mol Med. 8:1325–1339. 10.15252/emmm.201606330 [DOI] [PMC free article] [PubMed] [Google Scholar]
  • 17.Perley CC, Frahm M, Click EM, Dobos KM, Ferrari G, Stout JE, et al. 2014. The human antibody response to the surface of Mycobacterium tuberculosis. PLoS ONE 9: e98938 10.1371/journal.pone.0098938 [DOI] [PMC free article] [PubMed] [Google Scholar]
  • 18.Hu Y, Movahedzadeh F, Stoker NG, Coates AR.2006. Deletion of the Mycobacterium tuberculosis alpha-crystallin-Like hspX gene causes increased bacterial growth in vivo. Infect Immun. 74:861–868. 10.1128/IAI.74.2.861-868.2006 [DOI] [PMC free article] [PubMed] [Google Scholar]
  • 19.Sherman DR, Voskuil M, Schnappinger D, Liao R, Harrell MI, Schoolnik GK. 2001. Regulation of the Mycobacterium tuberculosis hypoxic response gene encoding a-crystallin. Proc. Natl. Acad. Sci. USA. 98:7534–7539. 10.1073/pnas.121172498 [DOI] [PMC free article] [PubMed] [Google Scholar]
  • 20.Yuan Y, Crane DD, Barry CE III. 1996. Stationary phase-associated protein expression in Mycobacterium tuberculosis: function of the mycobacterial a-crystallin homolog J. Bact 178: 4484–4492. [DOI] [PMC free article] [PubMed] [Google Scholar]
  • 21.Wilkinson RJ, Wilkinson KA, De Smet KAL, Haslov K, Pasvol G, Singh M, et al. 1998. Human T and B-Cell Reactivity to the 16 kDa a-Crystallin Protein of Mycobacterium tuberculosis. Scand J Immunol 48: 403–409. 10.1046/j.1365-3083.1998.00420.x [DOI] [PubMed] [Google Scholar]
  • 22.Demissie A, Leyten EM, Abebe M, Wassie L, Aseffa A, Abate G, et al. VACSEL Study Group. 2006. Recognition of stage-specific mycobacterial antigens differentiates between acute and latent infections with Mycobacterium tuberculosis. Clin Vaccine Immunol. 13:179–186. 10.1128/CVI.13.2.179-186.2006 [DOI] [PMC free article] [PubMed] [Google Scholar]
  • 23.Geluk A, Lin MY, van Meijgaarden KE, Leyten EM, Franken KL, Ottenhoff TH, et al. 2007. T-cell recognition of the HspX protein of Mycobacterium tuberculosis correlates with latent M. tuberculosis infection but not with M. bovis BCG vaccination. Infect Immun. 75:2914–2921. 10.1128/IAI.01990-06 [DOI] [PMC free article] [PubMed] [Google Scholar]
  • 24.Jackett PS, Bothamley GH, Batra HV, Mistry A, Young DB, Ivanyi J. 1988. Specificity of antibodies to immunodominant mycobacterial antigens in pulmonary tuberculosis. J Clin Microbiol 26:2313–2318. [DOI] [PMC free article] [PubMed] [Google Scholar]
  • 25.Senoputra MA, Shiratori B, Hasibuan FM, Koesoemadinata RC, Apriani L, Ashino Y, et al. 2015. Diagnostic value of antibody responses to multiple antigens from Mycobacterium tuberculosis in active and latent tuberculosis. Diagn Microbiol Infect Dis. 83:278–285. 10.1016/j.diagmicrobio.2015.07.021 [DOI] [PubMed] [Google Scholar]
  • 26.Bothamley GH, Beck JS, Potts RC, Grange JM, Kardjito T, Ivanyi J. 1992. Specificity of antibodies and tuberculin response after occupational exposure to tuberculosis. J Infect Dis 166: 182–186. 10.1093/infdis/166.1.182 [DOI] [PubMed] [Google Scholar]
  • 27.Chandramuki A, Bothamley GH. Brennan PJ, Ivanyi J. 1989. Levels of antibody to defined antigens of Mycobacterium tuberculosis in tuberculous meningitis. J Clin Microbiol I7:821–825. [DOI] [PMC free article] [PubMed] [Google Scholar]
  • 28.Silva VMC, Kanaujia G, Gennaro ML, Menzies D. 2003. Factors associated with humoral response to ESAT-6, 38 kDa and 14 kDa in patients with a spectrum of tuberculosis. Int J Tuberc Lung Dis 7: 478–484. [PubMed] [Google Scholar]
  • 29.Abebe F, Belay M, Legesse M, Franken KLMC, Ottenhoff THM. 2018. IgA and IgG against Mycobacterium tuberculosis Rv2031 discriminate between pulmonary tuberculosis patients, Mycobacterium tuberculosis-infected and non-infected individuals. PLoS ONE 13: e0190989 10.1371/journal.pone.0190989 [DOI] [PMC free article] [PubMed] [Google Scholar]
  • 30.Davidow A, Kanaujia GV, Shi L, Kaviar J, Guo X, Sung N, et al. 2005. Antibody profiles characteristic of Mycobacterium tuberculosis infection state. Infect. Immun. 73: 6846–6851. 10.1128/IAI.73.10.6846-6851.2005 [DOI] [PMC free article] [PubMed] [Google Scholar]
  • 31.Sireci G, Dieli F, Di Liberto D, Buccheri S, La Manna MP, Scarpa F, et al. 2007. Anti-16-kilodalton mycobacterial protein immunoglobulin m levels in healthy but purified protein derivative-reactive children decrease after chemoprophylaxis. Clin Vaccine Immunol. 14:1231–1234. 10.1128/CVI.00057-07 [DOI] [PMC free article] [PubMed] [Google Scholar]
  • 32.Castro-Garza J, GarcõÂa-Jacobo P, Rivera- Morales LG, Quinn FD, Barber J, Karls R, et al. 2017. Detection of anti-HspX antibodies and HspX protein in patient sera for the identification of recent latent infection by Mycobacterium tuberculosis. PLoS ONE 12: e0181714 10.1371/journal.pone.0181714 [DOI] [PMC free article] [PubMed] [Google Scholar]
  • 33.Khayyam KU, Patra S, Sarin R, Behera D. Tuberculosis among healthcare workers in tertiary care institute for respiratory disease in New Delhi. Indian J Tuberc. 2010, 57: 192–198. [PubMed] [Google Scholar]
  • 34.Markwell MA, Haas SM, Bieber LL, Tolbert NE. 1978. A modification of the Lowry procedure to simplify protein determination in membrane and lipoprotein samples. Anal Biochem 87: 206–210. 10.1016/0003-2697(78)90586-9 [DOI] [PubMed] [Google Scholar]
  • 35.Byeon H, Ji MJ, Kang S, Kim SW, Kim S, Park S, et al. 2015. Performance of the SD Bioline TB Ag MPT64 Rapid test for quick confirmation of Mycobacterium bovis isolates from animals. J Vet Sci 16: 31–35. 10.4142/jvs.2015.16.1.31 [DOI] [PMC free article] [PubMed] [Google Scholar]
  • 36.Klimashevskaya S, Obriadina A, Ulanova T, Bochkova G, Burkov A, Araujo A, et al. 2007. Distinguishing Acute from Chronic and Resolved Hepatitis C Virus (HCV) Infections by Measurement of Anti-HCV Immunoglobulin G Avidity Index. J Clin Microbiol 45: 3400–3403. 10.1128/JCM.01012-07 [DOI] [PMC free article] [PubMed] [Google Scholar]
  • 37.Carter PH, Resto-Ruiz S, Washington GC, Ethridge S, Palini A, Vogt R, et al. 1992. Flow cytometric analysis of whole blood lysis, three anticoagulants, and five cell preparations. Cytometry 13: 68–74. 10.1002/cyto.990130111 [DOI] [PubMed] [Google Scholar]
  • 38.Arias-Bouda LMP, Kuijper S, Werf AVD, Nguyen LN, Jansen HM, Kolk AHJ. 2003. Changes in avidity and level of immunoglobulin G antibodies to Mycobacterium tuberculosis in sera of patients undergoing treatment for pulmonary tuberculosis. Clin Diag Lab Immunol 10: 702–709. [DOI] [PMC free article] [PubMed] [Google Scholar]
  • 39.Shi L, Jung YJ, Tyagi S, Gennaro ML, North RJ. 2003. Expression of Th1-mediated immunity in mouse lungs induces a Mycobacterium tuberculosis transcription pattern characteristic of nonreplicating persistence. Proc. Natl. Acad. Sci. USA 100:241–246. 10.1073/pnas.0136863100 [DOI] [PMC free article] [PubMed] [Google Scholar]
  • 40.Bothamley GH, Rudd R, Festenstein F, Ivanyi J. 1992. Clinical value of the measurement of Mycobacterium tuberculosis-specific antibody in pulmonary tuberculosis. Thorax 47: 270–275. 10.1136/thx.47.4.270 [DOI] [PMC free article] [PubMed] [Google Scholar]
  • 41.Legesse M., Ameni G., Medhin G., Mamo G., Franken K.L.M.C., Ottenhoff T.H.M., et al. (2013), IgA Response to ESAT‐6/CFP‐10 and Rv2031 Antigens Varies in Patients With Culture‐Confirmed Pulmonary Tuberculosis, Healthy Mycobacterium tuberculosis–Infected and Non‐Infected Individuals in a Tuberculosis Endemic Setting, Ethiopia. Scand J Immunol 78: 266–274. 10.1111/sji.12080 [DOI] [PubMed] [Google Scholar]
  • 42.Hussain R, Dawood G, Abrar N, Toossi Z, Minai A, Dojki M, et al. 1995. Selective increases in antibody isotypes and immunoglobulin G subclass responses to secreted antigens in tuberculosis patients and healthy household contacts of the patients. Clin Diag Lab Immunol. 2:726–732. [DOI] [PMC free article] [PubMed] [Google Scholar]
  • 43.Krishnamurty AT, Thouvenel CD, Portugal S, Keitany GJ, Kim KS, Holder A, et al. 2016. Somatically hypermutated plasmodium-specific IgM+ memory B cells are rapid, plastic, early responders upon malaria rechallenge. Immunity 45:402–414. 10.1016/j.immuni.2016.06.014 [DOI] [PMC free article] [PubMed] [Google Scholar]
  • 44.Awoniyi DO, Baumann R, Chegou NN, Kriel B, Jacobs R, Kidd M, et al. 2017. Detection of a combination of serum IgG and IgA antibodies against selected mycobacterial targets provides promising diagnostic signatures for active TB. Oncotarget. 8: 37525–37537. 10.18632/oncotarget.16401 [DOI] [PMC free article] [PubMed] [Google Scholar]
  • 45.Talavera-Paul´ın M, Garc´ıa-Morales L, Ru´ız-Sa´nchez BP, Caamal-Ley AD, Herna´ndez-Solis A, Ram´ırez-Casanova E, et al. 2016. Active tuberculosis patients have high levels of IgA anti-alpha crystallin and isocitrate lyase proteins. Int J Tuberc Lung Dis 20:1681–1688. 10.5588/ijtld.16.0250 [DOI] [PubMed] [Google Scholar]
  • 46.Lyashchenko K, Colangeli R, Houde M, Jahdali HA, Menzies D, Gennaro ML. 1998. Heterogeneous antibody responses in tuberculosis. Infect Immun 66: 3936–3940. [DOI] [PMC free article] [PubMed] [Google Scholar]
  • 47.Conger JD, Pike BL, Nossal GJV. 1988. Analysis of the B lymphocyte repertoire by polyclonal activation hindrance by clones yielding antibodies which bind promiscuously to plastic. J. Immunol. Methods. 106: 181–189. 10.1016/0022-1759(88)90195-0 [DOI] [PubMed] [Google Scholar]
  • 48.Fujii K, Tsuji M, Murota K, Terato K, Shimozuru Y, Nagai Y. 1989. An improved enzyme-linked immunosorbent assay of anti-collagen antibodies in human serum. J. Immunol. Methods 124: 63 10.1016/0022-1759(89)90186-5 [DOI] [PubMed] [Google Scholar]
  • 49.de Vries D, Dekker-Saeys A, Gyodi E, Bohm U, Ivanyi P. 1992. Absence of autoantibodies to peptides shared by HLA-B27.5 and Klebsiella pneumonia nitrogenase in serum samples from HLA-B27 positive patients with ankylosing spondylitis and Reiter's syndrome. Ann. Rheum. Dis. 51: 783 10.1136/ard.51.6.783 [DOI] [PMC free article] [PubMed] [Google Scholar]
  • 50.Rabahi MF, Junqueira-Kipnis AP, dos Reis MCG et al. 2007. Humoral response to HspX and GlcB to previous and recent infection by Mycobacterium tuberculosis. BMC Infect Dis 7: 148 10.1186/1471-2334-7-148 [DOI] [PMC free article] [PubMed] [Google Scholar]
  • 51.Steingart KR, Henry M, Laal S, Hopewell PC, Ramsay A, Menzies D, et al. 2007. Commercial serological antibody detection tests for the diagnosis of pulmonary tuberculosis: A systematic review. PLoS Med 4: e202 10.1371/journal.pmed.0040202 [DOI] [PMC free article] [PubMed] [Google Scholar]
  • 52.World Health Organization. 2011. Commercial serodiagnostic tests for diagnosis of tuberculosis: policy statement. [PubMed]
  • 53.Lalvani A, Nagvenkar P, Udwadia Z, Pathan AA, Wilkinson KA, Shastri JS, et al. 2001. Enumeration of T Cells specific for RD1-encoded antigens suggests a high prevalence of latent Mycobacterium tuberculosis infection in healthy urban Indians. J Infect Dis 183:469–77. 10.1086/318081 [DOI] [PubMed] [Google Scholar]

Decision Letter 0

Katalin Andrea Wilkinson

29 Oct 2019

PONE-D-19-27417

Immune responses to Mycobacterium tuberculosis membrane-associated antigens including alpha crystallin can potentially discriminate between latent infection and active tuberculosis disease

PLOS ONE

Dear Dr Sinha,

Thank you for submitting your manuscript to PLOS ONE. After careful consideration, we feel that it has merit but does not fully meet PLOS ONE’s publication criteria as it currently stands. Therefore, we invite you to submit a revised version of the manuscript that addresses all the points raised during the review process in a point by point manner. This is essential in order to ensure that the manuscript is technically sound, and that the data presented support the conclusions.

We would appreciate receiving your revised manuscript by Dec 13 2019 11:59PM. When you are ready to submit your revision, log on to https://www.editorialmanager.com/pone/ and select the 'Submissions Needing Revision' folder to locate your manuscript file.

If you would like to make changes to your financial disclosure, please include your updated statement in your cover letter.

To enhance the reproducibility of your results, we recommend that if applicable you deposit your laboratory protocols in protocols.io, where a protocol can be assigned its own identifier (DOI) such that it can be cited independently in the future. For instructions see: http://journals.plos.org/plosone/s/submission-guidelines#loc-laboratory-protocols

Please include the following items when submitting your revised manuscript:

  • A rebuttal letter that responds to each point raised by the academic editor and reviewer(s). This letter should be uploaded as separate file and labeled 'Response to Reviewers'.

  • A marked-up copy of your manuscript that highlights changes made to the original version. This file should be uploaded as separate file and labeled 'Revised Manuscript with Track Changes'.

  • An unmarked version of your revised paper without tracked changes. This file should be uploaded as separate file and labeled 'Manuscript'.

Please note while forming your response, if your article is accepted, you may have the opportunity to make the peer review history publicly available. The record will include editor decision letters (with reviews) and your responses to reviewer comments. If eligible, we will contact you to opt in or out.

We look forward to receiving your revised manuscript.

Kind regards,

Katalin Andrea Wilkinson, PhD

Academic Editor

PLOS ONE

Journal Requirements:

1. When submitting your revision, we need you to address these additional requirements.

Please ensure that your manuscript meets PLOS ONE's style requirements, including those for file naming. The PLOS ONE style templates can be found at

http://www.journals.plos.org/plosone/s/file?id=wjVg/PLOSOne_formatting_sample_main_body.pdf and http://www.journals.plos.org/plosone/s/file?id=ba62/PLOSOne_formatting_sample_title_authors_affiliations.pdf

2.  We note that you have included the phrase “data not shown” in your manuscript. Unfortunately, this does not meet our data sharing requirements. PLOS does not permit references to inaccessible data. We require that authors provide all relevant data within the paper, Supporting Information files, or in an acceptable, public repository. Please add a citation to support this phrase or upload the data that corresponds with these findings to a stable repository (such as Figshare or Dryad) and provide and URLs, DOIs, or accession numbers that may be used to access these data. Or, if the data are not a core part of the research being presented in your study, we ask that you remove the phrase that refers to these data.

[Note: HTML markup is below. Please do not edit.]

Reviewers' comments:

Reviewer's Responses to Questions

Comments to the Author

1. Is the manuscript technically sound, and do the data support the conclusions?

The manuscript must describe a technically sound piece of scientific research with data that supports the conclusions. Experiments must have been conducted rigorously, with appropriate controls, replication, and sample sizes. The conclusions must be drawn appropriately based on the data presented.

Reviewer #1: Partly

Reviewer #2: Partly

**********

2. Has the statistical analysis been performed appropriately and rigorously?

Reviewer #1: No

Reviewer #2: Yes

**********

3. Have the authors made all data underlying the findings in their manuscript fully available?

The PLOS Data policy requires authors to make all data underlying the findings described in their manuscript fully available without restriction, with rare exception (please refer to the Data Availability Statement in the manuscript PDF file). The data should be provided as part of the manuscript or its supporting information, or deposited to a public repository. For example, in addition to summary statistics, the data points behind means, medians and variance measures should be available. If there are restrictions on publicly sharing data—e.g. participant privacy or use of data from a third party—those must be specified.

Reviewer #1: Yes

Reviewer #2: Yes

**********

4. Is the manuscript presented in an intelligible fashion and written in standard English?

PLOS ONE does not copyedit accepted manuscripts, so the language in submitted articles must be clear, correct, and unambiguous. Any typographical or grammatical errors should be corrected at revision, so please note any specific errors here.

Reviewer #1: Yes

Reviewer #2: Yes

**********

5. Review Comments to the Author

Please use the space provided to explain your answers to the questions above. You may also include additional comments for the author, including concerns about dual publication, research ethics, or publication ethics. (Please upload your review as an attachment if it exceeds 20,000 characters)

Reviewer #1: The authors have investigated antibody responses to alpha-crystallin and an Mtb cell membrane fraction in a range of individuals with presumed varying exposure to Mtb, as well as active TB and cured TB.

Major comments

1. Clinical cohort description:

i. How was ‘cured TB’ defined?

ii. Presumably none of the patients with active TB were culture positive, and no drug sensitivity testing was performed?

iii. From the referenced paper describing the cohort, it appears that several of the participants in the active TB group were on antitubercular therapy. Is this the case for the samples interrogated here? Although <3 weeks, this is still sufficient time for sputum conversion to occur.

iv. What is the distribution of TST positivity in the HCW groups? For example, groups are divided into OC and HC, but how many of each of these groups are TST+?

v. Why is the data rather not represented then as TST- HCW, and TST+ HCW, as these groups may be more immunologically distinct?

vi. What is meant by ‘suspected, or had tested for HIV?’ How many were tested, and what were the results? If HIV status is unknown, then this should be simply stated.

vii. If the assumption is that the intensity of exposure is greater in previous household contacts than occupational contacts, is the duration of time since exposure known?

2. Methods:

i. The concentration of secondary antibodies should be given in the methods.

2. Statistical analysis

i. Student’s t-test was used with the presumption of normal data distribution. What is the evidence for selecting a parametric test for this ELISA dataset?

ii. For multiple groups, statistical tests with multiple comparison should be used.

iii. It is not indicated in the figure legends where each statistical method listed is applied. For example, for the correlations, no statistical test is mentioned.

3. Figures:

i. The figures supplied are too low resolution to be clearly read. Please provide higher resolution images of figures.

ii. The figure legends would be improved by stating the statistical methods, numbers and quantitative results obtained. It would also make the figures clearer to interpret if statistical significance was included in the figures.

4. Results:

a) Figure 1:

i. Are there any significant differences using multiple comparisons for each Ig, across the 4 groups and 2 antigens?

ii. How was the inference made that IgG was the predominant isotype? The assays used appear semi-quantitative, a limitation of ELISA without a standard curve. They also utilize different secondary antibodies at different concentrations.

b) Figure 2

i. The conclusion that non-specific serum binding is ‘strikingly’ greater than antigen binding for IgM appears to be a technical challenge rather than biological.

ii. The results that IgM are higher in background wells than antigen-coated wells suggests that IgM is not detected at that concentration of sera, and should be stated as such.

iii. Comparing blocking buffers is reasonable, however this did not resolve the issue. Further optimization of antigen concentration, serum and secondary dilution could improve detection specific IgM.

ii. Prior to describing this as a “striking” finding with “unknown mechanism”, could the authors please review the optimization of this IgM assay, or perhaps include positive controls of known IgM responder serum.

c) Figure 3A and 3B:

i. Please revise figures to include statistical tests, p value and numbers.

ii. How is the lack of correlation to be understood, given that Acr is likely a component of the more immunogenic MtM antigen fraction?

iii. Can the ratio of OD be meaningfully interpreted, given that the OD is a semi-quantitative measure, and MtM is at a higher concentration? It could be understood that these ratios are from technical aspects of the assay rather than biological.

b) Figure 4:

i. The avidity experiment is an interesting approach, given observations in a recent publication (Lu et al, IFN-γ-independent immune markers of Mycobacterium tuberculosis exposure, Nature Medicine, 2019).

ii. What is the specific p value on this figure?

iii. Has a concentration curve of urea, per the above article, been tested? Perhaps this could reveal avidity differences in the contacts vs active TB group.

a. It would be interesting to see if an inverse trend existed for cytosolic antigen fraction.

d) Figure 5 and 6:

i. A representative complete gating strategy should be shown, including a live-dead stain.

ii. The positive population for Ki67 seems to be placed quite high and underestimate stimulation, especially in the active TB panel.

iii. The gate should be placed closer to the negative population with gating derived from a secondary antibody FMO panel shown in the figure. Could the authors please show an FMO figure where this gating was validated? This may even improve the results of the assay.

iv. Could the authors show the raw data analysed as frequency of live Ki67+ T cells.

v. It is unclear what is on the Y-axis. What is meant by ‘responder T cells?’ The figure insert is also illegible.

vi. For the stimulation in this assay, is it possible that more antigen-specific cells are present in ‘cured TB’ and active TB, but these cells die during the 5 day stimulation?

e) Figure 7:

i. It is unclear which samples are these – are they all the OC and HC samples pooled?

ii. The axes do not include antigens tested.

iii. What are the numbers in each group?

iv. What is the cut-off for TST, and how was this determined if HIV infection was not determined?

f) Figure 8:

i. What is the concentration of MtM used in the stimulation assay? Is it fair to conclude that more cells respond to MtM when perhaps non-saturating levels of Acr were used, and the concentrations differed?

Minor comments

1. Single quotation marks appear numerous times in the article, perhaps to make the point that some of these notions are contentious in the literature. These could serve to be removed and the point made simply for readability. Ie. it is not needed to put ‘blocking’ buffer in quotation marks for example.

2. What is meant by a front-line antigens?

3. The authors repeatedly preface their results with several citations and literature review in the results section. This information may be more appropriate in the discussion section.

4. The language includes colloquialisms such as ‘turned out to be’ that seem inappropriate per standard academic convention.

5. Could the authors please revise for grammatical errors.

Reviewer #2: In recent years there are several reports about immunological methods to identify TB infected people and to differentiate active TB from latent TB infection. This paper analyze the antibody response as well as T cell response against M. tuberculosis membrane-associated antigens and the protein Acr.

Introduction is well written and enough information has been included to understand the problem. I consider the methods were designed and performed adequately. Still, I have some general comments that authors should consider to improve the article.

Although he actual immunological methods cannot discriminate between active TB and latent TB, the recognized assay to be include, in all works testing new methods, is the Quantiferon Gold as a reference assay. Authors must include the reason why they did not use it and discuss how this could affect the results they found. I mean, how would they compare how good is the method they propose against a recognized one. Also it would be good if they have had the quantiferon data for each patient for a better group distribution. They neither did it in the previous work in reference 9.

Two preparations were tested in this work: membrane-associated antigens and Acr protein. Authors suggest than membrane antigens could be a better marker than Acr for latent TB. However, the 82 antigens identified in the previous study as immunogenic were not analyzed for their specificity for Mtb. The question is if there are some cross reactivity with other mycobacteria species and that could confuse the results and make it harder to interpret them. Authors reported that antibodies and T cell response not being influenced by tuberculin or BCG vaccination, even so, it cannot be excluded a cross reactivity with membrane antigens. Also, it turns out that Acr is one of the main protein of the antigens associated to the membrane; then, how do you know that the response is due to other antigens or mainly due to Acr? A more extensive study about Mtb membrane antigens would give a better understanding to select the correct antigens for the assays.

Another emerging question is the number of samples, I think they are not enough to have right conclusions, but this is already mentioned by the authors in discussion.

**********

6. PLOS authors have the option to publish the peer review history of their article (what does this mean?). If published, this will include your full peer review and any attached files.

If you choose “no”, your identity will remain anonymous but your review may still be made public.

Do you want your identity to be public for this peer review? For information about this choice, including consent withdrawal, please see our Privacy Policy.

Reviewer #1: No

Reviewer #2: No

[NOTE: If reviewer comments were submitted as an attachment file, they will be attached to this email and accessible via the submission site. Please log into your account, locate the manuscript record, and check for the action link "View Attachments". If this link does not appear, there are no attachment files to be viewed.]

While revising your submission, please upload your figure files to the Preflight Analysis and Conversion Engine (PACE) digital diagnostic tool, https://pacev2.apexcovantage.com/. PACE helps ensure that figures meet PLOS requirements. To use PACE, you must first register as a user. Registration is free. Then, login and navigate to the UPLOAD tab, where you will find detailed instructions on how to use the tool. If you encounter any issues or have any questions when using PACE, please email us at figures@plos.org. Please note that Supporting Information files do not need this step.

PLoS One. 2020 Jan 31;15(1):e0228359. doi: 10.1371/journal.pone.0228359.r002

Author response to Decision Letter 0


10 Dec 2019

RESPONSE TO REVIEWERS’ COMMENTS

Reviewer #1:

The authors have investigated antibody responses to alpha-crystallin and an Mtb cell membrane fraction in a range of individuals with presumed varying exposure to Mtb, as well as active TB and cured TB.

Major comments

(We have carried out a major revision of the manuscript in view of these, as well as comments from 2nd Reviewer and Editor.)

1. Clinical cohort description:

Query/comment (i). How was ‘cured TB’ defined?

Response: TB cure was defined as per WHO criteria (WHO/HTM/TB/2013.2).

Q (ii). Presumably none of the patients with active TB were culture positive, and no drug sensitivity testing was performed?

R: All patients were sputum-smear positive (1+ to 3+) which was used as a criterion for determining active disease (WHO/HTM/TB/2013.2). Drug sensitivity testing was not performed in 8 patients whose clinical history did not suggest drug-resistance. In the remaining 2, where drug resistance was suspected, Xpert MTB/RIF assay was performed (WHO/HTM/TB/2013.16). However, both were found sensitive for RIF.

Q (iii). From the referenced paper describing the cohort, it appears that several of the participants in the active TB group were on antitubercular therapy. Is this the case for the samples interrogated here? Although <3 weeks, this is still sufficient time for sputum conversion to occur.

R: As mentioned above, all patients were smear-positive (1+ to 3+) at the time of investigation.

Q (iv). What is the distribution of TST positivity in the HCW groups? For example, groups are divided into OC and HC, but how many of each of these groups are TST+?

R: As shown in our previous report on this cohort (Ref 10), distribution of TST positivity in individual HCW groups was: OC, 13/30; HC, 7/8 and CTB, 4/5.

Q (v). Why is the data rather not represented then as TST- HCW, and TST+ HCW, as these groups may be more immunologically distinct?

R: The TST+/- (as well as BCG +/-) HCW data presented in the manuscript (Fig 8) as well as in our previous report (ref 10) suggested that these groups may not be immunologically distinct.

Q (vi). What is meant by ‘suspected, or had tested for HIV?’ How many were tested, and what were the results? If HIV status is unknown, then this should be simply stated.

R: We follow the policy of HIV testing for all newly diagnosed TB patients. Nine out of 10 patients were tested and found seronegative for HIV. In the remaining 1 patient (who was transferred to us from another clinic) also, we did not suspect HIV based on her clinical records.

Q (vii). If the assumption is that the intensity of exposure is greater in previous household contacts than occupational contacts, is the duration of time since exposure known?

R: As stated in Materials and Methods, the household contacts (HC) had lived with a smear-positive TB patient for at least 3 months (WHO/HTM/TB/2012.9). Duration of tome since exposure was > 1year.

2. Methods:

Q (i). The concentration of secondary antibodies should be given in the methods.

R: This has now been given.

2. Statistical analysis

Q (i). Student’s t-test was used with the presumption of normal data distribution. What is the evidence for selecting a parametric test for this ELISA dataset?

R: Thanks for pointing this out. Indeed, the dataset was not normally distributed. We have therefore reanalyzed the data by non-parametric methods (see revised Materials and Methods) and incorporated the required changes in Results and Discussion.

Q (ii). For multiple groups, statistical tests with multiple comparison should be used.

R: We have now done it and results are shown in Results.

Q (iii). It is not indicated in the figure legends where each statistical method listed is applied. For example, for the correlations, no statistical test is mentioned.

R: The figure legends have now been modified according to this suggestion.

3. Figures:

Q (i). The figures supplied are too low resolution to be clearly read. Please provide higher resolution images of figures.

R: High-resolution images were provided to the journal. They can perhaps be accessed though a hot link on top right corner of each image.

Q (ii). The figure legends would be improved by stating the statistical methods, numbers and quantitative results obtained. It would also make the figures clearer to interpret if statistical significance was included in the figures.

R: The figure legends have been modified as suggested.

4. Results:

a) Figure 1:

Q (i). Are there any significant differences using multiple comparisons for each Ig, across the 4 groups and 2 antigens?

R: These results are now shown in revised Figure 1.

Q (ii). How was the inference made that IgG was the predominant isotype? The assays used appear semi-quantitative, a limitation of ELISA without a standard curve. They also utilize different secondary antibodies at different concentrations.

R: The assay is indeed semi-quantitative and we have now mentioned this limitation in revised Discussion. However, the concentration of secondary antibodies was not limiting as determined during the assay optimization.

b) Figure 2:

Q (i). The conclusion that non-specific serum binding is ‘strikingly’ greater than antigen binding for IgM appears to be a technical challenge rather than biological.

R: This is possible and we have modified the Results and Discussion accordingly.

Q (ii). The results that IgM are higher in background wells than antigen-coated wells suggests that IgM is not detected at that concentration of sera, and should be stated as such.

R: Necessary modification has been made in Results.

Q (iii). Comparing blocking buffers is reasonable, however this did not resolve the issue. Further optimization of antigen concentration, serum and secondary dilution could improve detection specific IgM.

R: We have revised the relevant text in the light of these comments.

Q (iv). Prior to describing this as a “striking” finding with “unknown mechanism”, could the authors please review the optimization of this IgM assay, or perhaps include positive controls of known IgM responder serum.

R: We have revised the relevant text in the light of these comments. It is however possible that blocking of IgM is a unique property of Acr, since MtM did not do so.

c) Figure 3A and 3B:

Q i. Please revise figures to include statistical tests, p value and numbers.

R: This revision has been done.

Q ii. How is the lack of correlation to be understood, given that Acr is likely a component of the more immunogenic MtM antigen fraction?

R: We stand corrected. New analysis by non-parametric methods has revealed a significant (though weak) correlation between the two antibody responses. We have revised the Discussion accordingly.

Q iii. Can the ratio of OD be meaningfully interpreted, given that the OD is a semi-quantitative measure, and MtM is at a higher concentration? It could be understood that these ratios are from technical aspects of the assay rather than biological.

R: We agree with this observation and have incorporated it in Discussion.

b) Figure 4:

Qi. The avidity experiment is an interesting approach, given observations in a recent publication (Lu et al, IFN-γ-independent immune markers of Mycobacterium tuberculosis exposure, Nature Medicine, 2019).

R: Thanks for the suggestion. We have also incorporated this paper in revised manuscript (ref 5}.

Qii. What is the specific p value on this figure?

R: This has now been given.

iii. Has a concentration curve of urea, per the above article, been tested? Perhaps this could reveal avidity differences in the contacts vs active TB group.

R: In absence of a ‘gold standard’ method for avidity determination, the protocol used by us (ref 36) has been used more commonly (recently in Nature Communications, 2019, 10:2174). Though some workers have used thiocyanate, it (being a biohazard) is being replaced by urea. Nonetheless, following your suggestion we also tried the protocol described by Lu et al. In doing so, besides using the pooled sera (as done by them) we also used individual HCW and ATB sera. However, 50% inhibition was not attained in 5 out of 6 sera as well as the pooled sera (S2 Fig). This could have happened due to the difference in nature of antigens (PPD vs MtM) or avidity of antibodies.

a. It would be interesting to see if an inverse trend existed for cytosolic antigen fraction.

R: The immunoproteome of Mtb is rich in membrane and not cytosolic proteins (ref 7). We (refs 13, 14) and others (refs 15-17) have shown that human antibodies are directed mainly towards MtM antigens. We also observed that antibody levels against cytosolic antigens are generally low (ΔOD < 0.2) hence did not proceed with this experiment.

d) Figure 5 and 6:

Q i. A representative complete gating strategy should be shown, including a live-dead stain.

R: A representative gating strategy is shown as S3 Fig. We also determined the viability of T cells (after 5 days of whole blood cultures) using propidium iodide staining and flow cytometry (ref 37). As shown in S4 Fig (data of a smear-positive TB patient), > 90% CD3+ cells were viable on day 6 and 95% of them showed a strong proliferative response to PHA.

Q ii: The positive population for Ki67 seems to be placed quite high and underestimate stimulation, especially in the active TB panel.

R: In deciding the position of quadrants, we followed the adage ‘unstimulated control best teaches where to place the quadrants’ (Cytometry Part A, 2006, 69A:1037–1042). Further, since Ki67 positive and negative populations were distinctly apart, moving the horizontal line a bit lower did not achieve any worthwhile gain in positivity of stimulated cells. However, it frequently (and falsely) enhanced the positivity of unstimulated cells. As shown in our previous report (ref 10), the response of patients (as well as HCWs) to PHA was variable. For example, another patient (with 3+ smear positivity) showed a strong response (S4 Fig).

Q iii: The gate should be placed closer to the negative population with gating derived from a secondary antibody FMO panel shown in the figure. Could the authors please show an FMO figure where this gating was validated? This may even improve the results of the assay.

R: We chose Biological Comparison Control over FMO control for the following reasons.

1. FMO controls are more relevant in multicolor (> 4 colors) experiments (Cytometry Part A, 2006, 69A:1037–1042). Besides, there are also some limitations of FMO controls. Because it does not contain an antibody in the channel of interest, an FMO control does not provide the measure of background staining when that antibody is actually included. Further, FMO addresses spillover-induced background but not non-specific antibody binding.

2. A biological comparison control is recognized as the most relevant control for determining positivity of the test samples (Cytometry Part A, 2006, 69A:1037–1042). In most cases this control is far more relevant than an isotype control or FMO. Like an FMO control, the unstimulated control accounts for spillover effects on the channel of interest as it includes all antibody conjugates present in the test sample. In addition, like an isotype control, it also accounts for nonspecific staining in the channel of interest.

Q iv: Could the authors show the raw data analysed as frequency of live Ki67+ T cells.

R: T cells were fixed and permeabilized prior to staining for Ki67 hence were not alive.

Qv: It is unclear what is on the Y-axis. What is meant by ‘responder T cells?’ The figure insert is also illegible.

R: This figure has been modified and the inset has been enlarged.

Q vi: For the stimulation in this assay, is it possible that more antigen-specific cells are present in ‘cured TB’ and active TB, but these cells die during the 5 day stimulation?

R: As mentioned above (S4 Fig), over 90% T cells of ATB patients were alive on day-6 and also responded strongly to PHA.

e) Figure 7:

Q (i-iii). It is unclear which samples are these – are they all the OC and HC samples pooled? The axes do not include antigens tested. What are the numbers in each group?

R: This information has now been given.

Q (iv). What is the cut-off for TST, and how was this determined if HIV infection was not determined?

R: The cut-off for TST was 10 mm induration (as per IUATLD and WHO guidelines, discussed in Ref 10). TST was done only in HCWs, none of whom was positive for HIV.

f) Figure 8:

i. What is the concentration of MtM used in the stimulation assay? Is it fair to conclude that more cells respond to MtM when perhaps non-saturating levels of Acr were used, and the concentrations differed?

R: Equal concentrations (5 µg/ml) of both Acr and MtM (ref 10) were used. Moreover, as Acr happens to be just one of the 105 proteins identified by us in the MtM proteome (ref 8), it may not be fair to conclude that non-saturating levels of Acr were used.

Minor comments

1. Single quotation marks appear numerous times in the article, perhaps to make the point that some of these notions are contentious in the literature. These could serve to be removed and the point made simply for readability. Ie. it is not needed to put ‘blocking’ buffer in quotation marks for example.

R: We concur with this observation and have removed single quotation marks wherever unnecessary.

2. What is meant by a front-line antigens?

R: We have replaced this phrase with ‘potential biomarker’.

3. The authors repeatedly preface their results with several citations and literature review in the results section. This information may be more appropriate in the discussion section.

R: We have now removed most citations from Results. They are however still needed at some places to emphasize/justify the need for undertaking a particular investigation.

4. The language includes colloquialisms such as ‘turned out to be’ that seem inappropriate per standard academic convention.

R: We fully agree with this and have removed this phrase.

5. Could the authors please revise for grammatical errors.

R: We have re-read the manuscript and have made required corrections.

Reviewer #2:

In recent years there are several reports about immunological methods to identify TB infected people and to differentiate active TB from latent TB infection. This paper analyze the antibody response as well as T cell response against M. tuberculosis membrane-associated antigens and the protein Acr. Introduction is well written and enough information has been included to understand the problem. I consider the methods were designed and performed adequately. Still, I have some general comments that authors should consider to improve the article.

Comment: Although the actual immunological methods cannot discriminate between active TB and latent TB, the recognized assay to be included, in all works testing new methods, is the Quantiferon Gold as a reference assay. Authors must include the reason why they did not use it and discuss how this could affect the results they found. I mean, how would they compare how good is the method they propose against a recognized one. Also it would be good if they have had the quantiferon data for each patient for a better group distribution. They neither did it in the previous work in reference 9.

Response: We have used TST as the reference assay, reasons for which have now been elaborated more explicitly in revised Introduction (2nd paragraph).

Comment: Two preparations were tested in this work: membrane-associated antigens and Acr protein. Authors suggest than membrane antigens could be a better marker than Acr for latent TB. However, the 82 antigens identified in the previous study as immunogenic were not analyzed for their specificity for Mtb. The question is if there are some cross reactivity with other mycobacteria species and that could confuse the results and make it harder to interpret them.

Response: We fully agree with this observation. In fact we have not proposed that the crude membrane should be used as such. In concluding paragraph of Discussion we had said that “In addition to Acr, the study draws attention to MtM as an emerging source of immunodominant T cell antigens”. We have now revised the Discussion to further clarify this point. However, in real life the ‘non-tuberculous mycobacteria’ as well as BCG do not seem to confound the results of TST which also uses a crude antigen (Farhat et al, Int J Tuberc Lung Dis, 2006; 10:1192).

Comment: Authors reported that antibodies and T cell response not being influenced by tuberculin or BCG vaccination, even so, it cannot be excluded a cross reactivity with membrane antigens.

Response: We have revised the relevant text accordingly.

Comment: Also, it turns out that Acr is one of the main protein of the antigens associated to the membrane; then, how do you know that the response is due to other antigens or mainly due to Acr? A more extensive study about Mtb membrane antigens would give a better understanding to select the correct antigens for the assays.

Response: We completely agree with this suggestion and have revised the Discussion accordingly. In fact, we have made some such attempts in the past (ref 8) but have not been able meet any remarkable success. We nevertheless are seized with this problem.

Comment: Another emerging question is the number of samples, I think they are not enough to have right conclusions, but this is already mentioned by the authors in discussion.

(No response needed).

RESPONSE TO EDITOR’S COMMENTS

Comment: We note that you have included the phrase “data not shown” in your manuscript. Unfortunately, this does not meet our data sharing requirements. PLOS does not permit references to inaccessible data. We require that authors provide all relevant data within the paper, Supporting Information files, or in an acceptable, public repository. Please add a citation to support this phrase or upload the data that corresponds with these findings to a stable repository (such as Figshare or Dryad) and provide and URLs, DOIs, or accession numbers that may be used to access these data. Or, if the data are not a core part of the research being presented in your study, we ask that you remove the phrase that refers to these data.

Response: We have now removed this phrase from Results section (in context of Fig 3) without giving any additional data as the corresponding observation is trivial in nature. We have also removed this phrase from Discussion, but have given the data (as S7 Fig) since we needed to make an important discussion point.

Attachment

Submitted filename: Response to Reviewers.docx

Decision Letter 1

Katalin Andrea Wilkinson

3 Jan 2020

PONE-D-19-27417R1

Immune responses to Mycobacterium tuberculosis membrane-associated antigens including alpha crystallin can potentially discriminate between latent infection and active tuberculosis disease

PLOS ONE

Dear Dr Sinha,

Thank you for submitting your manuscript to PLOS ONE. After careful consideration, we feel that it has merit but does not fully meet PLOS ONE’s publication criteria as it currently stands. Therefore, we invite you to submit a revised version of the manuscript that addresses the points raised during the review process.

We would appreciate receiving your revised manuscript by Feb 17 2020 11:59PM. When you are ready to submit your revision, log on to https://www.editorialmanager.com/pone/ and select the 'Submissions Needing Revision' folder to locate your manuscript file.

If you would like to make changes to your financial disclosure, please include your updated statement in your cover letter.

To enhance the reproducibility of your results, we recommend that if applicable you deposit your laboratory protocols in protocols.io, where a protocol can be assigned its own identifier (DOI) such that it can be cited independently in the future. For instructions see: http://journals.plos.org/plosone/s/submission-guidelines#loc-laboratory-protocols

Please include the following items when submitting your revised manuscript:

  • A rebuttal letter that responds to each point raised by the academic editor and reviewer(s). This letter should be uploaded as separate file and labeled 'Response to Reviewers'.

  • A marked-up copy of your manuscript that highlights changes made to the original version. This file should be uploaded as separate file and labeled 'Revised Manuscript with Track Changes'.

  • An unmarked version of your revised paper without tracked changes. This file should be uploaded as separate file and labeled 'Manuscript'.

Please note while forming your response, if your article is accepted, you may have the opportunity to make the peer review history publicly available. The record will include editor decision letters (with reviews) and your responses to reviewer comments. If eligible, we will contact you to opt in or out.

We look forward to receiving your revised manuscript.

Kind regards,

Katalin Andrea Wilkinson, PhD

Academic Editor

PLOS ONE

[Note: HTML markup is below. Please do not edit.]

Reviewers' comments:

Reviewer's Responses to Questions

Comments to the Author

1. If the authors have adequately addressed your comments raised in a previous round of review and you feel that this manuscript is now acceptable for publication, you may indicate that here to bypass the “Comments to the Author” section, enter your conflict of interest statement in the “Confidential to Editor” section, and submit your "Accept" recommendation.

Reviewer #1: (No Response)

Reviewer #2: All comments have been addressed

**********

2. Is the manuscript technically sound, and do the data support the conclusions?

The manuscript must describe a technically sound piece of scientific research with data that supports the conclusions. Experiments must have been conducted rigorously, with appropriate controls, replication, and sample sizes. The conclusions must be drawn appropriately based on the data presented.

Reviewer #1: Yes

Reviewer #2: Yes

**********

3. Has the statistical analysis been performed appropriately and rigorously?

Reviewer #1: (No Response)

Reviewer #2: (No Response)

**********

4. Have the authors made all data underlying the findings in their manuscript fully available?

The PLOS Data policy requires authors to make all data underlying the findings described in their manuscript fully available without restriction, with rare exception (please refer to the Data Availability Statement in the manuscript PDF file). The data should be provided as part of the manuscript or its supporting information, or deposited to a public repository. For example, in addition to summary statistics, the data points behind means, medians and variance measures should be available. If there are restrictions on publicly sharing data—e.g. participant privacy or use of data from a third party—those must be specified.

Reviewer #1: Yes

Reviewer #2: (No Response)

**********

5. Is the manuscript presented in an intelligible fashion and written in standard English?

PLOS ONE does not copyedit accepted manuscripts, so the language in submitted articles must be clear, correct, and unambiguous. Any typographical or grammatical errors should be corrected at revision, so please note any specific errors here.

Reviewer #1: Yes

Reviewer #2: (No Response)

**********

6. Review Comments to the Author

Please use the space provided to explain your answers to the questions above. You may also include additional comments for the author, including concerns about dual publication, research ethics, or publication ethics. (Please upload your review as an attachment if it exceeds 20,000 characters)

Reviewer #1: The authors have undertaken substantial revision of the manuscript exploring humoral immunogenicity of membrane-associated proteins in human TB. The principle findings include (a) higher levels of IgM in contacts than in active TB patients (b) higher Acr IgA in active TB than contacts (c) altered ratios of IgG to Acr vs Mtm across the spectrum of TB disease.

In general, the comments has been addressed.

Further comments:

1. The major concern of statistical analysis has been resolved with the correction of non-parametric and multiple comparison tests.

2. The rebuttal to the flow cytometry gating is accepted. The live/dead stain at day 6 confirms the cells were still alive in active TB.

3. Thank you for the additional experiments regarding the antibody avidity. It is suggested to put the p-value in the figure given that the trend is discussed. Could the heterogeneity in antibody avidity in active TB be due to different durations of disease prior to presentation? Perhaps something to explore in future studies with greater powering.

4. The finding of IgM being greater in contacts than in active TB is interesting, suggesting the chronicity of active TB drives class-switching. Could a mechanism be included in the discussion?

5. The r-squared and p values should be inserted in the scatter plot figures (correlations).

6. The results regarding IgM not detectable against Acr is likely technical (concentration of Acr coating?), but the authors have addressed this clearly in the discussion. In the way it is presented, this could still be of benefit for the research community.

7. Line 268: Can immunoglobulin levels truly be directly compared on an OD basis given it is being compared across different antigens and secondary antibodies? Would this not require a standard curve of subclasses to derive a specific concentration of immunoglobulin? However, it could be correct to state that IgG and then later for figure 6, IgG2 (line 316), is the most readily detectable immunoglobulins in their given assays.

Minor comments:

1. Line 66: What is meant by ‘presumptive’ in single quotation marks?

2. Line 88: Missing a word – Mtb membrane lysate or proteins?

3. Line 97: Why is ‘Mtb complex’ in single quotation marks?

4. Line 95-96: What is meant by sustain the bacilli in

5. Line 188: Should be IgA not AgA

6. Line 200: The concentration of the secondary should be included.

7. Line 256: Missing word – elaborated ‘on’.

8. Line 394: It is unclear what is meant by quantum of infection increasing.

9. Line 556: Typo in semi-quantitative. The point with semi-quantitative is that levels of antibodies cannot be directly compared when using different reagents (secondaries) or assays. Further, it also poses a challenge for defining cut-off values for diagnostic tests as the units are arbitrary and contingent on the individual assay. However, it is accepted that this study is exploratory in nature.

10. Line 451: Why is dynamic in single quotation marks?

11. Line 492: Why is ‘cell-surface’ in single quotation marks?

12. Line 512: “gets worsened” should perhaps be “is worsened”

Reviewer #2: My comments about some of the responses given by authors

Author’s response: We have used TST as the reference assay, reasons for which have now been elaborated more explicitly in revised Introduction (2nd paragraph).

Authors have explained the reason why they used TST as the reference assay. I may consider this a valid reason, but it would be easier to compare their results with others reports using IGRAs. Still the data provided in this paper may be useful to complement the information about this topic.

Author’s response: We fully agree with this observation. In fact we have not proposed that the crude membrane should be used as such. In concluding paragraph of Discussion we had said that “In addition to Acr, the study draws attention to MtM as an emerging source of immunodominant T cell antigens”. We have now revised the Discussion to further clarify this point. However, in real life the ‘non-tuberculous mycobacteria’ as well as BCG do not seem to confound the results of TST which also uses a crude antigen (Farhat et al, Int J Tuberc Lung Dis, 2006; 10:1192).

I agree with the paragraph mentioned in discussion. But the fact that MtM is a rich source of antigens, most of them unstudied, reveals that it is not close to determine which protein may actually function as biomarker. As author also responded: we have made some such attempts in the past (ref 8) but have not been able meet any remarkable success.

Additional comment:

I expected to see the changes made to the paper highlighted to facilitate the second review, instead I had to go through all the paper to see the changes

**********

7. PLOS authors have the option to publish the peer review history of their article (what does this mean?). If published, this will include your full peer review and any attached files.

If you choose “no”, your identity will remain anonymous but your review may still be made public.

Do you want your identity to be public for this peer review? For information about this choice, including consent withdrawal, please see our Privacy Policy.

Reviewer #1: No

Reviewer #2: No

[NOTE: If reviewer comments were submitted as an attachment file, they will be attached to this email and accessible via the submission site. Please log into your account, locate the manuscript record, and check for the action link "View Attachments". If this link does not appear, there are no attachment files to be viewed.]

While revising your submission, please upload your figure files to the Preflight Analysis and Conversion Engine (PACE) digital diagnostic tool, https://pacev2.apexcovantage.com/. PACE helps ensure that figures meet PLOS requirements. To use PACE, you must first register as a user. Registration is free. Then, login and navigate to the UPLOAD tab, where you will find detailed instructions on how to use the tool. If you encounter any issues or have any questions when using PACE, please email us at figures@plos.org. Please note that Supporting Information files do not need this step.

PLoS One. 2020 Jan 31;15(1):e0228359. doi: 10.1371/journal.pone.0228359.r004

Author response to Decision Letter 1


9 Jan 2020

Review Comments to the Author

Reviewer #1: The authors have undertaken substantial revision of the manuscript exploring humoral immunogenicity of membrane-associated proteins in human TB. The principle findings include (a) higher levels of IgM in contacts than in active TB patients (b) higher Acr IgA in active TB than contacts (c) altered ratios of IgG to Acr vs Mtm across the spectrum of TB disease.

In general, the comments has been addressed.

Further comments:

Comment-1. The major concern of statistical analysis has been resolved with the correction of non-parametric and multiple comparison tests.

(No response required)

C2. The rebuttal to the flow cytometry gating is accepted. The live/dead stain at day 6 confirms the cells were still alive in active TB.

(No response required)

C3. Thank you for the additional experiments regarding the antibody avidity. It is suggested to put the p-value in the figure given that the trend is discussed. Could the heterogeneity in antibody avidity in active TB be due to different durations of disease prior to presentation? Perhaps something to explore in future studies with greater powering.

Response: In the cited work [ref 5], authors had determined the avidity of anti-PPD antibodies in terms of molar concentration of urea required to reduce antibody bindings by 50% (IC50). Since they attained IC50 values in their experiment, statistical significance of differences could be calculated by t-test. However, in our case, the IC50 values were not attained (the possible reasons for which had been stated in revised manuscript R1). We nonetheless considered analysing the trends, but the data was insufficient. In any case, the two trends (HCW and ATB) appear comparable (S2 Fig). We had already stated in our previous revision (R1 Discussion) that the known heterogeneity in antibody responses of patients (which could be due to various reasons, including disease duration) and (perhaps more importantly) the differences in used protocol for avidity determinations could have caused these variations in avidity.

C4. The finding of IgM being greater in contacts than in active TB is interesting, suggesting the chronicity of active TB drives class-switching. Could a mechanism be included in the discussion?

Response: Thanks for pointing this out. We have modified the Discussion as suggested.

C5. The r-squared and p values should be inserted in the scatter plot figures (correlations).

Response: This has been done.

C6. The results regarding IgM not detectable against Acr is likely technical (concentration of Acr coating?), but the authors have addressed this clearly in the discussion. In the way it is presented, this could still be of benefit for the research community.

(No response required)

C7. Line 268: Can immunoglobulin levels truly be directly compared on an OD basis given it is being compared across different antigens and secondary antibodies? Would this not require a standard curve of subclasses to derive a specific concentration of immunoglobulin? However, it could be correct to state that IgG and then later for figure 6, IgG2 (line 316), is the most readily detectable immunoglobulins in their given assays.

Response: Thanks for pointing this out. The words ‘most abundant’ (line 268) and ‘dominant’ (line 316) have now been replaced by ‘most readily detectable’.

Minor comments:

1. Line 66: What is meant by ‘presumptive’ in single quotation marks?

R: It emphasizes the need for exercising caution while interpreting TST/IGRA results.

2. Line 88: Missing a word – Mtb membrane lysate or proteins?

R: Proteins (correction done).

3. Line 97: Why is ‘Mtb complex’ in single quotation marks?

R: Quotation marks have been removed.

4. Line 95-96: What is meant by sustain the bacilli in

R: Some of the dictionary meanings of sustain are: ‘to keep alive’, ‘strengthen’ or ‘support’.

5. Line 188: Should be IgA not AgA

R: Corrected.

6. Line 200: The concentration of the secondary should be included.

R: Included.

7. Line 256: Missing word – elaborated ‘on’.

R (line 276): Replaced the word elaborated with described.

8. Line 394: It is unclear what is meant by quantum of infection increasing.

R: We have replaced the word quantum with burden.

9. Line 556: Typo in semi-quantitative. The point with semi-quantitative is that levels of antibodies cannot be directly compared when using different reagents (secondaries) or assays. Further, it also poses a challenge for defining cut-off values for diagnostic tests as the units are arbitrary and contingent on the individual assay. However, it is accepted that this study is exploratory in nature.

R: Typo in line 566 has been corrected.

10. Line 451: Why is dynamic in single quotation marks?

R: Single quotation marks have been removed.

11. Line 492: Why is ‘cell-surface’ in single quotation marks?

R: To emphasize that ‘cell-surface’ is an ill-defined entity.

12. Line 512: “gets worsened” should perhaps be “is worsened”

R: Corrected.

Reviewer #2: My comments about some of the responses given by authors

Author’s response: We have used TST as the reference assay, reasons for which have now been elaborated more explicitly in revised Introduction (2nd paragraph).

Authors have explained the reason why they used TST as the reference assay. I may consider this a valid reason, but it would be easier to compare their results with others reports using IGRAs. Still the data provided in this paper may be useful to complement the information about this topic.

(No response required)

Author’s response: We fully agree with this observation. In fact we have not proposed that the crude membrane should be used as such. In concluding paragraph of Discussion we had said that “In addition to Acr, the study draws attention to MtM as an emerging source of immunodominant T cell antigens”. We have now revised the Discussion to further clarify this point. However, in real life the ‘non-tuberculous mycobacteria’ as well as BCG do not seem to confound the results of TST which also uses a crude antigen (Farhat et al, Int J Tuberc Lung Dis, 2006; 10:1192).

I agree with the paragraph mentioned in discussion. But the fact that MtM is a rich source of antigens, most of them unstudied, reveals that it is not close to determine which protein may actually function as biomarker. As author also responded: we have made some such attempts in the past (ref 8) but have not been able meet any remarkable success.

(No response required)

Additional comment:

I expected to see the changes made to the paper highlighted to facilitate the second review, instead I had to go through all the paper to see the changes

Response: As required by the journal, we had also submitted a copy of the manuscript showing corrections.

Attachment

Submitted filename: Response to Comments on R1.docx

Decision Letter 2

Katalin Andrea Wilkinson

14 Jan 2020

Immune responses to Mycobacterium tuberculosis membrane-associated antigens including alpha crystallin can potentially discriminate between latent infection and active tuberculosis disease

PONE-D-19-27417R2

Dear Dr. Sinha,

We are pleased to inform you that your manuscript has been judged scientifically suitable for publication and will be formally accepted for publication once it complies with all outstanding technical requirements.

Within one week, you will receive an e-mail containing information on the amendments required prior to publication. When all required modifications have been addressed, you will receive a formal acceptance letter and your manuscript will proceed to our production department and be scheduled for publication.

Shortly after the formal acceptance letter is sent, an invoice for payment will follow. To ensure an efficient production and billing process, please log into Editorial Manager at https://www.editorialmanager.com/pone/, click the "Update My Information" link at the top of the page, and update your user information. If you have any billing related questions, please contact our Author Billing department directly at authorbilling@plos.org.

If your institution or institutions have a press office, please notify them about your upcoming paper to enable them to help maximize its impact. If they will be preparing press materials for this manuscript, you must inform our press team as soon as possible and no later than 48 hours after receiving the formal acceptance. Your manuscript will remain under strict press embargo until 2 pm Eastern Time on the date of publication. For more information, please contact onepress@plos.org.

With kind regards,

Katalin Andrea Wilkinson, PhD

Academic Editor

PLOS ONE

Additional Editor Comments (optional):

Reviewers' comments:

Acceptance letter

Katalin Andrea Wilkinson

15 Jan 2020

PONE-D-19-27417R2

Immune responses to Mycobacterium tuberculosis membrane-associated antigens including alpha crystallin can potentially discriminate between latent infection and active tuberculosis disease

Dear Dr. Sinha:

I am pleased to inform you that your manuscript has been deemed suitable for publication in PLOS ONE. Congratulations! Your manuscript is now with our production department.

If your institution or institutions have a press office, please notify them about your upcoming paper at this point, to enable them to help maximize its impact. If they will be preparing press materials for this manuscript, please inform our press team within the next 48 hours. Your manuscript will remain under strict press embargo until 2 pm Eastern Time on the date of publication. For more information please contact onepress@plos.org.

For any other questions or concerns, please email plosone@plos.org.

Thank you for submitting your work to PLOS ONE.

With kind regards,

PLOS ONE Editorial Office Staff

on behalf of

Associate Professor Katalin Andrea Wilkinson

Academic Editor

PLOS ONE

Associated Data

    This section collects any data citations, data availability statements, or supplementary materials included in this article.

    Supplementary Materials

    S1 Text. Purchased materials.

    (PDF)

    S1 Fig. Avidity determination for anti-MtM antibodies.

    (PDF)

    S2 Fig. Gating strategy.

    (PDF)

    S3 Fig. Representative data on viability and proliferative capacity of T cells.

    (PDF)

    S4 Fig. Levels of IgG subclasses against MtM.

    (PDF)

    S5 Fig. Concordance between T cell and antibody responses to Acr.

    (PDF)

    S1 File. Raw data for figures and table.

    (PDF)

    S1 Table. Significance of differences (P values) in antibody levels.

    (PDF)

    Attachment

    Submitted filename: Response to Reviewers.docx

    Attachment

    Submitted filename: Response to Comments on R1.docx

    Data Availability Statement

    All relevant data are within the paper and its Supporting Information files.


    Articles from PLoS ONE are provided here courtesy of PLOS

    RESOURCES