Abstract
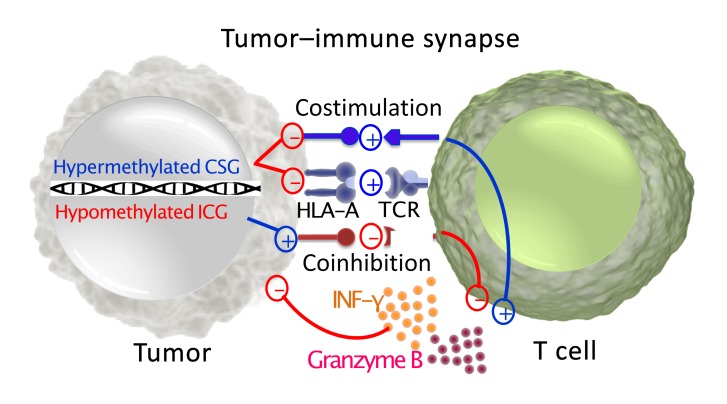
Cancer immune evasion is achieved through multiple layers of immune tolerance mechanisms including immune editing, recruitment of tolerogenic immune cells, and secretion of immunosuppressive cytokines. Recent success with immune checkpoint inhibitors in cancer immunotherapy suggests a dysfunctional immune synapse as a pivotal tolerogenic mechanism. Tumor cells express immune synapse proteins to suppress the immune system, which is often modulated by epigenetic mechanisms. When the methylation status of key immune synapse genes was interrogated, we observed disproportionately hypermethylated costimulatory genes and hypomethylation of immune checkpoint genes, which were negatively associated with functional T cell recruitment to the tumor microenvironment. Therefore, the methylation status of immune synapse genes reflects tumor immunogenicity and correlates with survival.
Keywords: Immunology
Keywords: Cancer immunotherapy, Epigenetics
Introduction
Unprecedented clinical success with immune checkpoint inhibitors alludes to the pivotal importance of the immune synapse that forms between the antigen-presenting cells and effector T cells (1). Professional antigen-presenting cells such as dendritic cells present tumor-associated antigens via human leukocyte antigen complex (HLA) to the cognate T cells to elicit tumor-specific immune responses (2). This high-fidelity recognition of tumor antigens by effector T cells is either augmented by concomitant interaction of costimulatory molecules leading to a functional immune response, or interrupted by engagement of immune checkpoint molecules mediating T cell anergy or exhaustion (2).
Although professional antigen-presenting cells are deemed critical for elicitation of a competent immune response, the immune synapse also forms between the tumor and the effector T cells; thus, the tumor cells may evade the effector T cells by neutralizing this interaction. In fact, the interaction between tumor cells and immune cells may shape the immunosuppressive landscape within the tumor microenvironment via mechanisms involved in downregulation of expression of both HLA and a wide array of immune checkpoint and costimulatory ligands to modulate T cell responses (3). Indeed, the role of the tumor in the immune synapse is best illustrated by a tendency toward superior efficacy of PD1-blocking antibodies against tumors expressing high levels of PD-L1 (4).
Expression of HLA and costimulatory/immune checkpoint molecules is intricately modulated at transcriptional, translational, and posttranslational levels (5). In particular, DNA methylation is a crucial epigenetic mechanism of immune regulation with critical roles in T cell development and differentiation, antigen presentation, effector function, and immunologic memory (6). Because cancer cells frequently utilize epigenetic dysregulation to silence tumor suppressors or activate oncogenes (7), we hypothesized that tumor progression requires epigenetic reprogramming of immune synapse genes to evade immune killing.
Results and Discussion
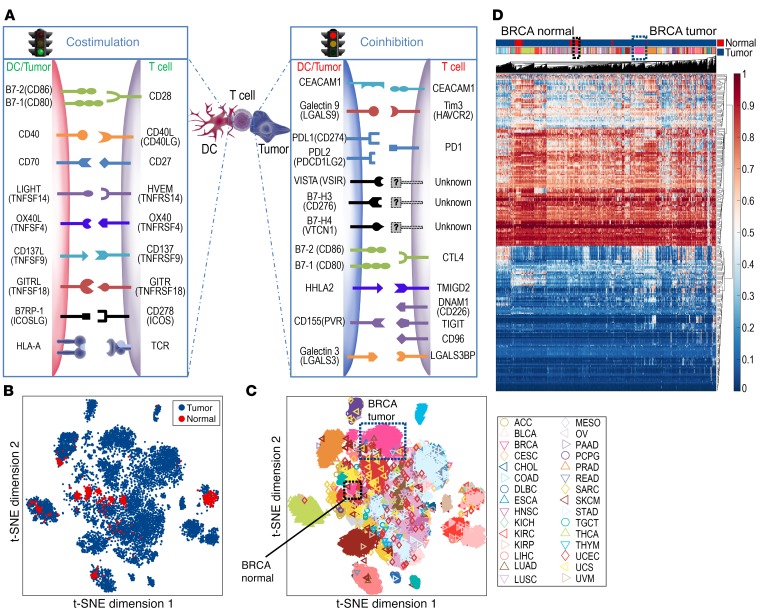
Tumor evolution to evade immune surveillance is a hallmark of carcinogenesis, and modulation of the immune synapse between antigen-presenting cells and effector T cells directly affects tumor-specific immunity. Because antigen-presenting cells and tumors modulate effector T cells via ligands for costimulatory and immune checkpoint pathways, we focused on the methylation status of these ligands in tumors (Figure 1A). The Cancer Genome Atlas (TCGA) Level 1 methylation data from 30 solid tumor types were studied (Supplemental Table 1; supplemental material available online with this article; https://doi.org/10.1172/JCI131234DS1). Twenty selected genes were divided into 2 groups: immune checkpoint genes (ICGs) and costimulatory genes (CSGs) (Supplemental Table 2). Of note, CD80 and CD86 have dual roles as stimulatory when interacting with CD28 or inhibitory as a ligand for CTLA-4. Prior studies suggest that their affinity is stronger for CTLA-4 and are thus likely to mediate inhibitory signals when expressed at low levels, as is generally the case in tumors (8). Therefore, these 2 genes were categorized as inhibitory genes in the tumor-immune synapse.
Figure 1. The distinct pattern of immune synapse gene methylation depends on tumor histology.
(A) Schematic of an immune synapse between the antigen-presenting cells/tumor and T cells. (B) t-SNE analysis was performed on 8,186 solid tumors and 745 normal adjacent tissues based on the β values for methylation levels for all probes for CSGs and ICGs from A, contrasting tumor (blue) versus normal adjacent tissue (red). (C) The spatial relationship between distinct tumor types is depicted, with breast tumors in the blue-dotted box and normal adjacent tissue samples in the black-dotted box. (D) Unbiased hierarchical clustering analysis is shown. ACC, adrenocortical carcinoma; BLCA, bladder urothelial carcinoma; BRCA, breast invasive carcinoma; CESC, cervical squamous cell carcinoma and endocervical adenocarcinoma; CHOL, cholangiocarcinoma; COAD, colon adenocarcinoma; DLBC, lymphoid neoplasm diffuse large B cell lymphoma; ESCA, esophageal carcinoma; HNSC, head and neck squamous cell carcinoma; KICH, kidney chromophobe; KIRC, kidney renal clear cell carcinoma; KIRP, kidney renal papillary cell carcinoma; LIHC, liver hepatocellular carcinoma; LUAD, lung adenocarcinoma; LUSC, lung squamous cell carcinoma; MESO, mesothelioma; OV, ovarian serous cystadenocarcinoma; PAAD, pancreatic adenocarcinoma; PCPG, pheochromocytoma and paraganglioma; PRAD, prostate adenocarcinoma; READ, rectum adenocarcinoma; SARC, sarcoma; SKCM, skin cutaneous melanoma; STAD, stomach adenocarcinoma; TGCT, testicular germ cell tumors; THCA, thyroid carcinoma; THYM, thymoma; UCEC, uterine corpus endometrial carcinoma; UCS, uterine carcinosarcoma; UVM, uveal melanoma.
We first investigated whether distinct tumor types were identifiable based on the methylation status of the immune synapse genes using 2-dimensional t-distributed stochastic neighbor embedding (t-SNE) (9) and unbiased hierarchical clustering analysis. Strikingly, patients with the same tumor type clustered together regardless of other clinical characteristics including age, sex, or stage (Figure 1, B–D). This finding suggests the methylation status of immune synapse genes is heavily imprinted by the tissue of origin. By contrast, normal adjacent tissue of the same histology differentially segregated within the cluster, highlighting the epigenetic evolution of tumors during carcinogenesis (Figure 1, B–D). For instance, breast cancer (inverted pink triangle) is clearly separated from its counterpart normal adjacent tissue.
Unbiased t-SNE and hierarchical clustering analysis demonstrated that the methylation status of immune synapse genes alone can distinguish tumor versus normal tissue and histologic subtypes, opening up an intriguing possibility that the methylation status of immune synapse genes may be utilized for early detection of cancer.
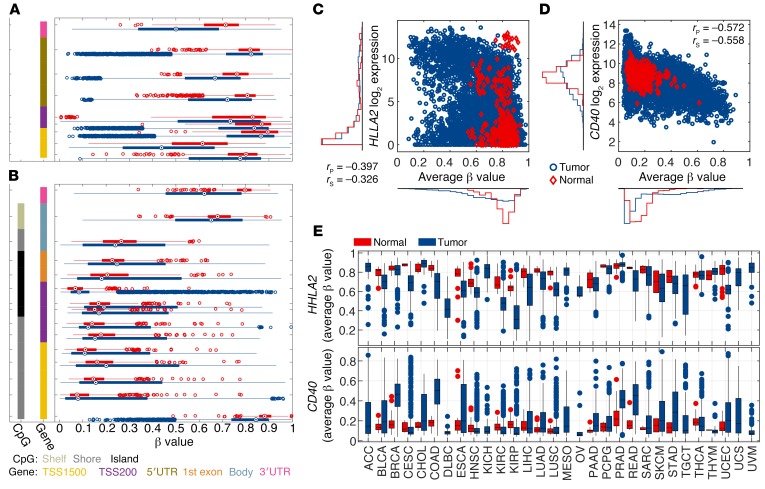
Next, we endeavored to understand the biological basis of separation between the tumor and the normal adjacent tissue by the methylation status of ICGs and CSGs by analyzing the methylation pattern of individual genes and their CpG probes on the Illumina 450K chip. A full list of the genes and their probes is given in Supplemental Table 3. Recent studies have demonstrated that DNA methylation of gene bodies may also contribute to transcriptional regulation (10); however, the probes targeting the putative promoter region of the genes within TSS1500, TSS200, and the 5′UTR were evaluated. Interestingly, ICGs and CSGs demonstrated inverse methylation patterns, reflecting their opposite immunomodulatory functions (Figure 2 and Supplemental Figures 1–16). For instance, the β values of probes within the CD40 gene locus, a prominent CSG, demonstrated profound hypermethylation in the tumor, while the HHLA2 gene locus, an ICG, demonstrated hypomethylation in the tumor in comparison with the normal adjacent tissue (Figure 2A). By contrast, the opposite phenomenon was observed for the CSGs with an increased methylation in tumor versus normal adjacent tissue (Figure 2B). The correlation between probes within the same gene is high, indicating the consistence of the methylation level measurements (Supplemental Figure 1). Because the known epigenetic mechanism of gene methylation is transcriptional suppression, we interrogated the relationship between the methylation status and its gene expression. As anticipated, an inverse correlation between methylation and gene expression was manifest among tumor and normal adjacent tissue (Figure 2, C and D). Such an inverse relationship, however, was confined to tumor samples with detectable gene expression (i.e., log2 expression > 4) (Figure 2D). The average methylation level was calculated using probes located in the TSS1500, TSS200, or 5′UTR region of the gene and with r less than –0.2 (Supplemental Table 3). Importantly, the average β value of the selected probes within the HHLA2 and CD40 gene loci demonstrated consistent methylation patterns across disease sites (Figure 2E): hypermethylation of CD40 and hypomethylation of HHLA2 in comparison with the normal adjacent tissue. Additionally, for both HHLA2 and CD40, the tumor samples demonstrated a larger variance in the methylation levels in tumor versus normal tissue across disease sites (Figure 2E).
Figure 2. The polarity of methylation patterns for costimulatory and immune checkpoint ligands.
(A and B) β Values of methylation probes for TSS1500, TSS200, 5′UTR, body, and 3′UTR of the HHLA2 gene (A), an example of an ICG, or CD40 (B), an example of a CSG, derived from all tumor samples (blue) and normal adjacent tissues (red) are depicted. The methylation level for each probe is represented by a box plot. The left-most column indicates the presence of CpG islands, while the second-column colors indicate where on the gene the probe is located. The average β values for selected probes within TSS1500, TSS200, and 5′UTR are plotted against gene expression for HHLA2 (C) or CD40 (D). Each marker represents an individual tissue sample. (E) A box plot of average β values for selected probes for HHLA2 and CD40 from tumor (blue) and normal adjacent tissue (red) is shown. rP and rS are Pearson’s and Spearman’s correlation coefficients, respectively.
These results suggest that the tumor-immune synapse is regulated at least in part by methylation in cancer. Sporadic evidence for regulation of HLA (11, 12), CD40 (5), or CD80 (13) by methylation in select tumor types now appears to be a more generalized phenomenon in the majority of CSGs and ICGs across tumor types. Interestingly, consistent with previous reports of PD-L1 promoter regulation by methylation (14), 2 probes within the promoter region were negatively correlated with the gene expression. However, a clear trend for hypomethylation of the PD-L1 locus in comparison with normal adjacent tissue was not observed, suggesting competing mechanisms governing PD-L1 expression (Supplemental Figure 4).
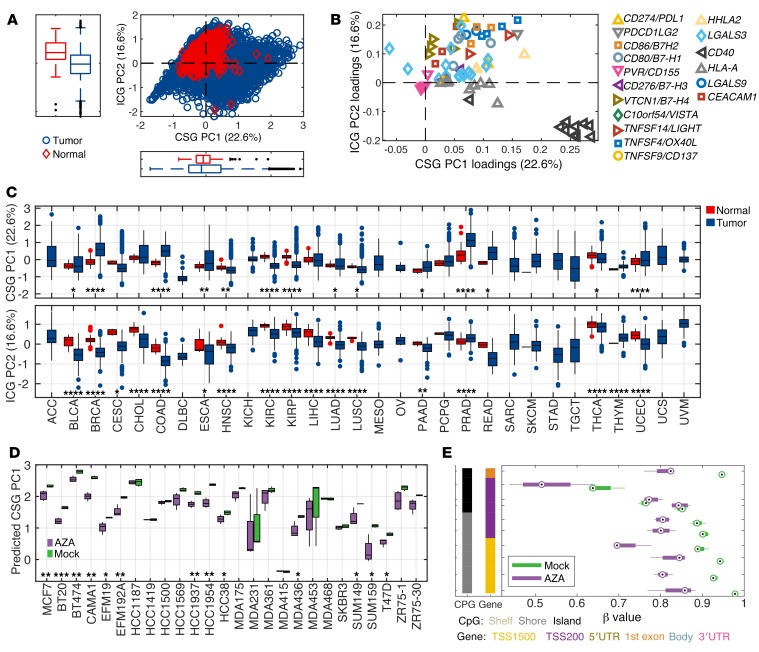
Next, we conducted a principal component analysis (PCA) to summarize the methylation pattern across all genes and their CpG probes. To minimize noise and enrich for biologically relevant signal, only the CSG and ICG CpG probes that demonstrated negative correlation (r < –0.2) between the methylation status and their corresponding gene expression and located in the TSS1500, TSS200, and 5′UTR regions were selected for further analysis: in total 75 probes (Figure 2, Supplemental Figures 1–16, and Supplemental Tables 3 and 4). PCA revealed 2 major principal components, explaining 22.6% and 16.6% of the variation, respectively. A 2-dimensional representation of PC1 and PC2 for 8,186 solid tumors and 745 normal adjacent tissues clearly showed that many tumors have an abnormal methylation pattern (Figure 3A). Strikingly, the dominant components of PC1 were CSGs, in particular CD40 and HLA-A. By contrast, PC2 was mainly driven by ICGs including VTCN1, HHLA2, PDL1, CEACAM1, CD80, and CD86 (Figure 3B and Supplemental Figure 17). Consequently, PC1 and PC2 were highly correlated with average β values of CSG probes and ICG probes, respectively (Supplemental Figure 17, A and B). Probes from the same gene generally clustered together, further confirming the robustness of this analysis (Figure 3B). It should be noted that all CpG probes contribute to both PCA components with variable contributions, some with a negative weight for a specific PCA component. The total score for a sample will thus be a weighted average of all variables. Consistent with the methylation patterns observed with individual CSGs and ICGs, primary tumors exhibited higher PC1 and lower PC2 scores in comparison with the normal adjacent tissue score across disease sites (Figure 3C), which was also replicated in the average β values of CSG and ICG probes (Supplemental Figure 17, D and E). Importantly, we observed reversal of hypermethylation of CSGs by 5-azacytidine in the data set of 26 epithelial cancer cell lines (15), with a significant decrease in PC1 scores (Figure 3D). At an individual gene level, demethylation of CD40 by 5-azacytidine was also evident (Figure 3E), underscoring the notion that the methylation status of CSGs is therapeutically actionable.
Figure 3. Principal component analysis (PCA) segregates costimulatory and immune checkpoint ligands.
(A) Two-dimensional plot of PC1 and PC2 scores for all tumor types (blue) and normal adjacent tissues (red) is shown. (B) The importance of the variables (CpG probes) for PC1 and PC2 is depicted. (C) A box plot of PC1 and PC2 scores for tumor (blue) and normal adjacent tissue (red) compared across histologic types. (D) PC1 scores of mock- or 5-azacitidine–treated epithelial cancer cell lines. (E) The methylation status of the CD40 gene in mock- or 5-azacytidine–treated CAMA1 cell line. *P < 0.05, **P < 0.01, ***P < 0.001, ****P < 0.0001 by 2-sided Student’s t test.
Two-dimensional evaluation of CSG and ICG methylation status revealed that normal tissues generally exhibit relative hypermethylation of ICGs and hypomethylation of CSGs, demonstrating the absence of an epigenetic brake to suppress the immune response. Indeed, highly efficient central tolerance mechanisms governing clonal deletion of self-reactive T cells allows normal tissues to remain highly immunogenic to any abnormal presence of foreign antigens, which usually represent infection. By contrast, tumor tissues manifest either hypermethylation of CSGs and/or hypomethylation of ICGs, effectively employing epigenetic mechanisms to deliberately suppress the immune system. Because of neoantigens, oncogenic virus antigens, or cancer testis antigens, tumor-specific immune responses ensue. Therefore, altered methylation status may reflect tumor adaptation to evolutionary pressure exerted by immune surveillance. A relatively consistent methylation phenotype between early-stage and late-stage melanoma suggests such epigenetic adaptation occurs early during carcinogenesis, which explains in part the markedly consistent methylation phenotype of immune synapse genes across tumor types. Although expression of HLA and costimulatory/immune checkpoint molecules is frequently dysregulated in cancer via multiple mechanisms (5), heritable changes that affect the entire tumor tissue as a whole require the initial cascade of tolerogenic signals to involve genetic or epigenetic changes. Because germline or somatic mutations of these immune synapse genes are rare events (5), the immune status of tumors manifest as the epigenetic footprints of immune synapse genes.
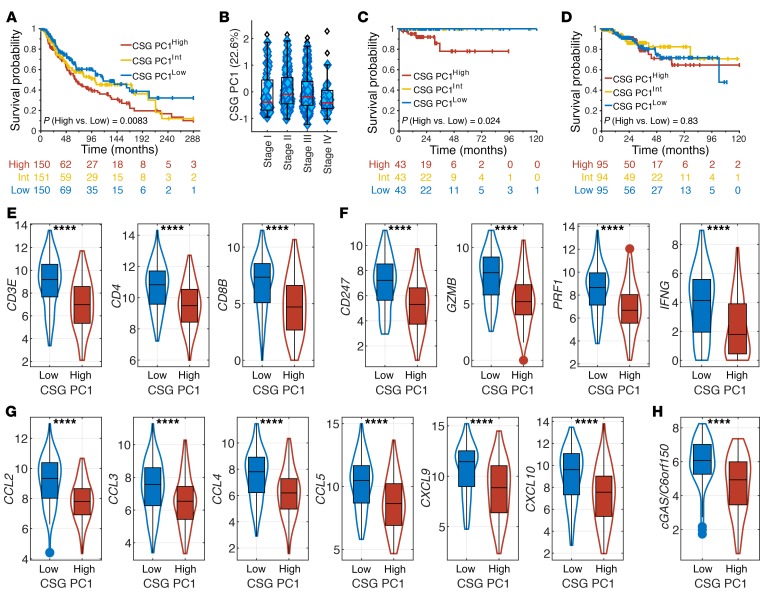
Because immune evasion is critical for cancer progression and survival, we hypothesized that the differential methylation status of the immune synapse genes may determine clinical outcome. Therefore, we investigated the clinical relevance of our PCA model in melanoma, a prototypic immunogenic cancer. PC1 was a determinant of disease-specific survival (DSS) in melanoma, with significant survival advantage in PC1Low patients characterized by hypomethylation of CSGs (Figure 4A). An alternative approach with partial least squares (PLS) modeling using the outcome as response variable also confirmed differences in survival outcome based on CSGs (Supplemental Figure 18). Interestingly, the PC1 score was relatively consistent among early- and late-stage melanoma patients, and thus, the survival difference was independent of patient staging (Figure 4B).
Figure 4. The methylation status of costimulatory ligands is prognostic in melanoma.
(A) Kaplan-Meier curves for DSS of melanoma patients with high, intermediate, and low tertiles of PC1 scores are shown. Higher PC1 scores represent hypermethylation of CSGs. (B) Box plot of PC1 score distribution based on melanoma patient staging. (C and D) Kaplan-Meier curves for DSS of UCEC patients with MSI (C) or without MSI (D) with high, intermediate, and low tertiles of PC1 scores are shown. (E) T cell recruitment in PC1High and PC1Low melanoma patients is approximated by gene expression of CD3E, CD4, and CD8B. (F) T effector functions in PC1High and PC1Low melanoma patients are approximated by gene expression of CD3ζ (CD247), granzyme B (GZMB), perforin (PRF1), and IFN-γ (IFNG). (G) Chemokines for immune cell trafficking in PC1High and PC1Low melanoma patients is approximated by gene expression of CCL2, CCL3, CCL4, CCL5, CCL9, and CCL10. (H) Immunogenicity of PC1High and PC1Low melanoma patients is approximated by gene expression of cGAS. P values in A, C, and D were derived from a log-rank test comparing PC1High and PC1Low groups. ****P < 0.0001 by 2-sided Student’s t test.
The methylation status of immune synapse genes was prognostic only in immunogenic tumors, suggesting that modulation of the tumor-immune synapse by methylation may become clinically relevant only in the presence of active antitumor immune responses. For instance, PC1 was prognostic for DSS in uterine corpus endometrial carcinoma (UCEC) with microsatellite instability (MSIHigh) (Figure 4C). By contrast, no differences in survival were noted based on PC1 in UCEC without MSI (WT) (Figure 4D). Consistently, the methylation status correlated with overall survival (OS) and DSS in other relatively immunogenic cancers, including non–small cell lung cancer (NSCLC), renal cell carcinoma (RCC), and head and neck cancer (HNSC). Similar to our findings with melanoma, NSCLC patients with lower PC1 scores demonstrated improved survival (Supplemental Figure 19). By contrast, prognosis for HNSC and RCC correlated with PC2 (Supplemental Figure 20).
Increased tumor infiltration by CD4+ and CD8+ T cells was evident in PC1Low patients (Figure 4E). Furthermore, increased levels of CD3ζ (CD247), granzyme B (GZMB), perforin (PRF1), and IFN-γ (IFNG) in PC1Low patients suggest superior effector functions by these T cells (Figure 4F). Interestingly, key chemokines that drive T cell recruitment and trafficking in melanoma (16), CCL2, CCL3, CCL4, CCL5, CXCL9, and CXCL10, were elevated in PC1Low patients (Figure 4G). More recently, the STING/cGAS pathway has been critically implicated in tumor immunogenicity. A significant increase in cGAS expression was also manifest in PC1Low patients (Figure 4H). Therefore, hypomethylation of CSGs in melanoma was associated with improved survival as well as enhanced tumor immunogenicity and recruitment of effector T cells.
In summary, we report methylation of immune synapse genes as a crucial driver of tolerogenic immune landscapes in cancer. Notably, preclinical studies have demonstrated the efficacy of demethylating agents to augment immunotherapy (17, 18). Based on our study, we predict that the subset of patients with hypermethylated CSGs (PC1High) may benefit from combination therapy of PD1 blockade with 5-azacitidine, while conversely, patients with hypermethylated ICGs (PC2High) may be adversely impacted. Given negative preliminary findings from the phase II randomized clinical trial of oral 5-azacitidine plus pembrolizumab versus pembrolizumab plus placebo (19), patient selection may be crucial to overcome resistance to PD1 blockade. Alternatively, targeted editing of tumor methylation of immune synapse genes by TET1 or DNMT3a via CRISPR may allow personalized approaches to augment immunotherapy (20). Notably, the methylation status of immune synapse genes may be utilized to predict response to immunotherapy. The major advantage to the use of the methylation status is that DNA is stable and degradation is less likely in formalin-fixed paraffin-embedded tissues, and thus anticipated to be more robust than RNA-based or histology-based approaches.
Methods
Analysis of TCGA methylation database.
TCGA Level 1 IDAT files for the selected tumor types were downloaded between April and May of 2016 using the former (now defunct) Data Matrix accessed through http://tcga-data.nci.nih.gov/tcga/dataAccessMatrix.htm Preprocessing the data included normalization via internal control probes followed by background subtraction using the methylumi R package from Bioconductor (21). The calculated β values were then extracted from the MethyLumiSet object following preprocessing.
Analysis of TCGA RNA-Seq database.
The TCGA RNA-Seq samples were extracted from the EBPlusPlusAdjustPANCAN_IlluminaHiSeq_RNASeqV2.geneExp.tsv file available from: https://gdc.cancer.gov/about-data/publications/pancanatlas and log2 transformed: log2(x + 1).
GSE57342 5-azacitidine–treated cancer cell lines.
The GSE57342 processed data set was downloaded and cell lines with more than 3 mock- and three 5-azacitidine–treated samples were selected for analysis.
t-SNE analysis.
t-SNE was calculated using all 247 probes for the selected 20 genes across all TCGA samples. The 50 first PCA components were used as input, with perplexity = 50 and Euclidian distance as implemented in MATLAB.
Correlation coefficient heatmap.
The Pearson’s correlation coefficients between all the probes within a gene were calculated and displayed as a heatmap.
PCA.
We used the first and second principal components (a weighted average of β values among the CSG and ICG probes), as they account for the largest variability in the data, to represent the overall methylation status for 8,931 tumor and normal samples in the TCGA database. That is, PC = Σwixi, a weighted average of β values among the selected CSG and ICG probes, where xi represents the gene i β value, wi is the corresponding weight (loading coefficient), with Σwi2 = 1, and the wi values maximize the variance of Σwixi. For each gene, a set of probes was selected using the following criteria to minimize noise: r < –0.2 (methylation vs. gene expression) located in the TSS1500, TSS200 or the 5′UTR (Supplemental Table 4). Each probe was centered but not scaled before PCA calculations.
Survival analysis.
OS and DSS data were retrieved from a prior publication (22). Tertiles were used to define high, intermediate (Int), and low PC1 or PC2 for melanoma, NSCLC, HNSC, RCC, UCEC MSIHigh, and WT patients. Kaplan-Meier curves were then plotted based on tertile scores.
PLS modeling.
A PLS model was derived using melanoma patients with poor survival (DSS dead < 12 months, 0) and long survival (DSS alive > 120 months, 1) as a binary response using the CSG probes. Cross validation indicated 2 significant PLS components. The PLS model was then applied to the melanoma samples not used in training. Samples with a predicted response greater than 0.5 were compared to samples with a predicted response less than 0.5 using a log-rank test.
MSI status.
The MSI status was extracted from Bonneville et al. (23). Samples with a MANTIS score larger than 0.4 were considered MSI positive as described in the publication.
Statistics.
t-SNE, PCA, PLS, Pearson’s, Spearman’s correlation statistics, and 2-sided Student’s t tests were performed in MATLAB R2018B. Survival analysis was done using MatSurv (https://github.com/aebergl/MatSurv).
Study approval.
Only publicly available, deidentified data are presented; thus, institutional study approval was not required.
Author contributions
AB performed bioinformatics analyses and created figures. RMP downloaded and processed the methylation data. MM and SK curated clinical data. IH contributed to generating figures. AB, JM, and SK analyzed and interpreted the data.
Supplementary Material
Acknowledgments
The authors acknowledge Jose Conejo-Garcia for discussions. This work was supported by NIH grant K08 CA194273, the Immunology Innovation Fund, an NCI Cancer Center Support grant (P30-CA076292), the Miriam and Sheldon G. Adelson Foundation, and the Moffitt Foundation.
Version 1. 11/12/2019
In-Press Preview
Version 2. 01/21/2020
Electronic publication
Version 3. 02/03/2020
Print issue publication
Footnotes
Conflict of interest: AB has ownership interest in Pfizer (stock). JM has ownership interest (including patents) in Fulgent Genetics, Inc., Aleta Biotherapeutics, Inc., Cold Genesys, Inc., Myst Pharma, Inc., Verseau Therapeutics, Inc., and Tailored Therapeutics, Inc., and is a consultant/advisory board member for Celgene Corporation, ONCoPEP, Inc., Cold Genesys, Inc., Morphogenesis, Inc., Mersana Therapeutics, Inc., GammaDelta Therapeutics, Ltd., Myst Pharma, Inc., Tailored Therapeutics, Inc., Verseau Therapeutics, Inc., Iovance Biotherapeutics, Inc., Vault Pharma, Inc., Noble Life Sciences Partners, Fulgent Genetics, Inc., Orpheus Therapeutics, Inc., UbiVac, LLC, Vycellix, Inc., and Aleta Biotherapeutics, Inc. SK received research funding from Bristol-Myers-Squibb, Astra-Zeneca, and HUYA Biosciences. A provisional patent application titled “Methylation modulates the tumor immune synapse” (application serial no. 62/889,981) has been filed.
Copyright: © 2020, American Society for Clinical Investigation.
Reference information: J Clin Invest. 2020;130(2):974–980.https://doi.org/10.1172/JCI131234.
Contributor Information
Anders Berglund, Email: anders.berglund@moffitt.org.
Matthew Mills, Email: mnmills2315@gmail.com.
Ryan M. Putney, Email: ryan.putney@moffitt.org.
Imène Hamaidi, Email: imene.hamaidi@moffitt.org.
James Mulé, Email: james.mule@moffitt.org.
Sungjune Kim, Email: sungjune.kim@moffitt.org.
References
- 1.Pardoll DM. The blockade of immune checkpoints in cancer immunotherapy. Nat Rev Cancer. 2012;12(4):252–264. doi: 10.1038/nrc3239. [DOI] [PMC free article] [PubMed] [Google Scholar]
- 2.Chen L, Flies DB. Molecular mechanisms of T cell co-stimulation and co-inhibition. Nat Rev Immunol. 2013;13(4):227–242. doi: 10.1038/nri3405. [DOI] [PMC free article] [PubMed] [Google Scholar]
- 3.Sade-Feldman M, et al. Resistance to checkpoint blockade therapy through inactivation of antigen presentation. Nat Commun. 2017;8(1):1136. doi: 10.1038/s41467-017-01062-w. [DOI] [PMC free article] [PubMed] [Google Scholar]
- 4.Kluger HM, et al. PD-L1 studies across tumor types, its differential expression and predictive value in patients treated with immune checkpoint inhibitors. Clin Cancer Res. 2017;23(15):4270–4279. doi: 10.1158/1078-0432.CCR-16-3146. [DOI] [PMC free article] [PubMed] [Google Scholar]
- 5.Thorsson V, et al. The immune landscape of cancer. Immunity. 2018;48(4):812–830.e14. doi: 10.1016/j.immuni.2018.03.023. [DOI] [PMC free article] [PubMed] [Google Scholar]
- 6.Fitzpatrick DR, Wilson CB. Methylation and demethylation in the regulation of genes, cells, and responses in the immune system. Clin Immunol. 2003;109(1):37–45. doi: 10.1016/S1521-6616(03)00205-5. [DOI] [PubMed] [Google Scholar]
- 7.Ehrlich M. DNA methylation and cancer-associated genetic instability. Adv Exp Med Biol. 2005;570:363–392. doi: 10.1007/1-4020-3764-3_13. [DOI] [PubMed] [Google Scholar]
- 8.Tirapu I, et al. Low surface expression of B7-1 (CD80) is an immunoescape mechanism of colon carcinoma. Cancer Res. 2006;66(4):2442–2450. doi: 10.1158/0008-5472.CAN-05-1681. [DOI] [PubMed] [Google Scholar]
- 9.Van der Maaten L, Hinton G. Visualizing data using t-SNE. Journal of Machine Learning Research. 2008;9:2579–2605. [Google Scholar]
- 10.Suzuki MM, Bird A. DNA methylation landscapes: provocative insights from epigenomics. Nat Rev Genet. 2008;9(6):465–476. doi: 10.1038/nrg2341. [DOI] [PubMed] [Google Scholar]
- 11.Nie Y, et al. DNA hypermethylation is a mechanism for loss of expression of the HLA class I genes in human esophageal squamous cell carcinomas. Carcinogenesis. 2001;22(10):1615–1623. doi: 10.1093/carcin/22.10.1615. [DOI] [PubMed] [Google Scholar]
- 12.Serrano A, et al. Rexpression of HLA class I antigens and restoration of antigen-specific CTL response in melanoma cells following 5-aza-2′-deoxycytidine treatment. Int J Cancer. 2001;94(2):243–251. doi: 10.1002/ijc.1452. [DOI] [PubMed] [Google Scholar]
- 13.Scarpa M, et al. CD80 down-regulation is associated to aberrant DNA methylation in non-inflammatory colon carcinogenesis. BMC Cancer. 2016;16:388. doi: 10.1186/s12885-016-2405-z. [DOI] [PMC free article] [PubMed] [Google Scholar]
- 14.Kowanetz M, et al. Differential regulation of PD-L1 expression by immune and tumor cells in NSCLC and the response to treatment with atezolizumab (anti-PD-L1) Proc Natl Acad Sci USA. 2018;115(43):E10119–E10126. doi: 10.1073/pnas.1802166115. [DOI] [PMC free article] [PubMed] [Google Scholar]
- 15.Li H, et al. Immune regulation by low doses of the DNA methyltransferase inhibitor 5-azacitidine in common human epithelial cancers. Oncotarget. 2014;5(3):587–598. doi: 10.18632/oncotarget.1782. [DOI] [PMC free article] [PubMed] [Google Scholar]
- 16.Harlin H, et al. Chemokine expression in melanoma metastases associated with CD8+ T-cell recruitment. Cancer Res. 2009;69(7):3077–3085. doi: 10.1158/0008-5472.CAN-08-2281. [DOI] [PMC free article] [PubMed] [Google Scholar]
- 17.Wrangle J, et al. Alterations of immune response of non-small cell lung cancer with azacytidine. Oncotarget. 2013;4(11):2067–2079. doi: 10.18632/oncotarget.1542. [DOI] [PMC free article] [PubMed] [Google Scholar]
- 18.Chiappinelli KB, et al. Inhibiting DNA methylation causes an interferon response in cancer via dsRNA including endogenous retroviruses. Cell. 2017;169(2):361. doi: 10.1016/j.cell.2017.03.036. [DOI] [PubMed] [Google Scholar]
- 19.Levy BP, et al. Randomised phase 2 study of pembrolizumab plus CC-486 versus pembrolizumab plus placebo in patients with previously treated advanced non-small cell lung cancer. Eur J Cancer. 2019;108:120–128. doi: 10.1016/j.ejca.2018.11.028. [DOI] [PubMed] [Google Scholar]
- 20.Liu XS, et al. Editing DNA methylation in the mammalian genome. Cell. 2016;167(1):233–247.e17. doi: 10.1016/j.cell.2016.08.056. [DOI] [PMC free article] [PubMed] [Google Scholar]
- 21. Davis S, Du P, Bilke S. Bioconductor. Version 2.7 (R package version 2.12.0). Methylumi: Handle Illumina methylation data. http://bioconductor.org/packages/2.7/bioc/html/methylumi.html Accessed November 26, 2019.
- 22.Liu J, et al. An integrated TCGA pan-cancer clinical data resource to drive high-quality survival outcome analytics. Cell. 2018;173(2):400–416.e11. doi: 10.1016/j.cell.2018.02.052. [DOI] [PMC free article] [PubMed] [Google Scholar]
- 23.Bonneville R, et al. Landscape of microsatellite instability across 39 cancer types. JCO Precis Oncol. 2017 doi: 10.1200/PO.17.00073. https://doi.org/10.1200/PO.17.00073. [DOI] [PMC free article] [PubMed] [Google Scholar]
Associated Data
This section collects any data citations, data availability statements, or supplementary materials included in this article.


