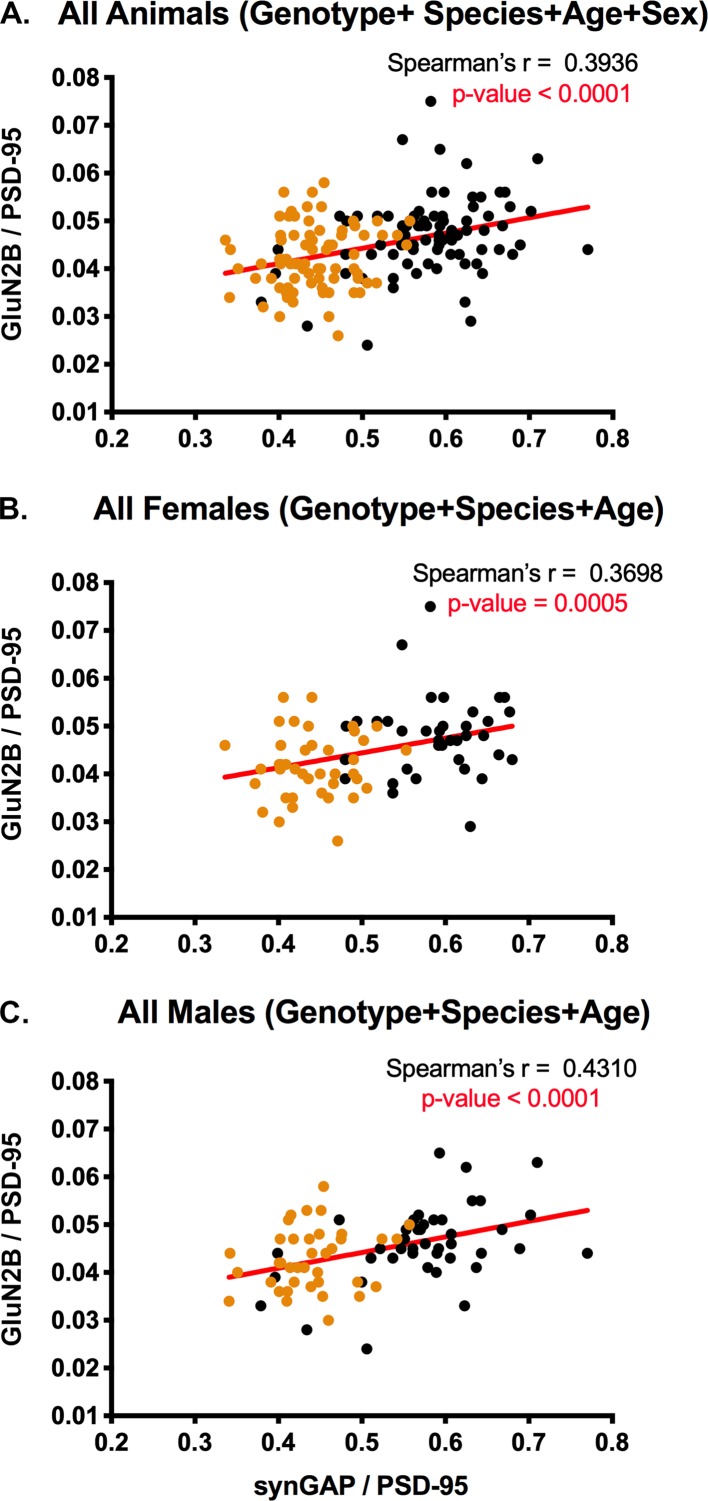
Figure 5. Correlation of the ratios GluN2B/PSD-95 and synGAP/PSD-95 in individual animals.
Each point represents a single animal. Black, WT; Orange, HET. (A) All animals including all genotypes, ages, species, and sexes. n = 158. (B) All female animals, including all genotypes, ages, and species. n = 77. C) All male animals, including all genotypes, ages, and species. n = 81. P-values for Spearman’s rank correlation coefficient are one-tailed. Significant p-values are shown in red.

