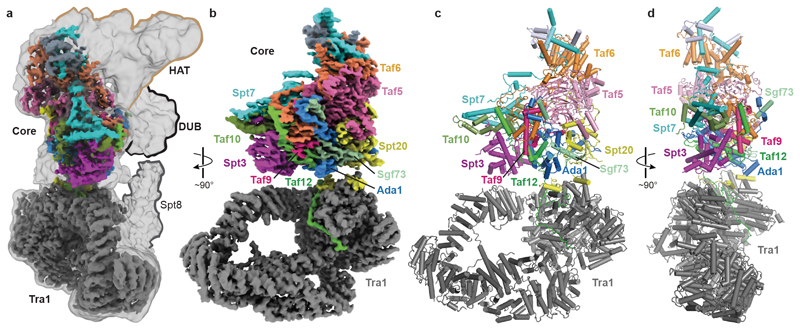
Figure 1. Overall structure of SAGA.
a. Overview of SAGA structure. Low-pass filtered and high-resolution composite cryo-EM maps of SAGA. The four SAGA modules Tra1, core, HAT and DUB are indicated.
b. High-resolution composite cryo-EM map reveals Tra1 and core modules. The subunit color code is used throughout.
c-d. Two views of the SAGA structure displayed as a ribbon model.

