Abstract
Objective
The use of the optical contrast agent sodium fluorescein (NaFl) to guide resection of gliomas has been under investigation for decades. Although this imaging strategy assumes the agent remains confined to the vasculature except in regions of blood-brain barrier (BBB) disruption, clinical studies have reported significant NaFl signal in normal brain tissue, limiting tumor-to-normal contrast. A possible explanation arises from earlier studies, which reported that NaFl exists in both pure and protein-bound forms in the blood, the former being small enough to cross the BBB. This study aims to elucidate the kinetic binding behavior of NaFl in circulating blood and its effect on NaFl accumulation in brain tissue and tumor contrast. Additionally, the authors examined the blood and tissue kinetics, as well as tumor uptake, of a pegylated form of fluorescein, selected as a potential optical analog of gadolinium-based MRI contrast agents.
Methods
Cohorts of mice were administered one of the following doses/forms of NaFl: 1) high human equivalent dose (HED) of NaFl, 2) low HED of NaFl, or 3) pegylated form of fluorescein. In each cohort, groups of animals were euthanized 15, 30, 60, and 120 minutes after administration for ex vivo analysis of fluorescein fluorescence. Using gel electrophoresis and fluorescence imaging of blood and brain specimens, the authors quantified the temporal kinetics of bound NaFl, unbound NaFl, and pegylated fluorescein in the blood and normal brain tissue. Finally, they compared tumor-to-normal contrast for NaFl and pegylated-fluorescein in U251 glioma xenografts.
Results
Administration of NaFl resulted in the presence of unbound and protein-bound NaFl in the circulation, with unbound NaFl constituting up to 70% of the signal. While protein-bound NaFl was undetectable in brain tissue, unbound NaFl was observed throughout the brain. The observed behavior was time and dose dependent. The pegylated form of fluorescein showed minimal uptake in brain tissue and improved tumor-to-normal contrast by 38%.
Conclusions
Unbound NaFl in the blood crosses the BBB, limiting the achievable tumor-to-normal contrast and undermining the inherent advantage of tumor imaging in the brain. Dosing and incubation time should be considered carefully for NaFl-based fluorescence guided surgery (FGS) of glioma. A pegylated form of fluorescein showed more favorable normal tissue kinetics that translated to higher tumor-to-normal contrast. These results warrant further development of pegylated-fluorescein for FGS of glioma.
Keywords: sodium fluorescein, blood brain barrier, fluorescence guided surgery and brain tumors, oncology, surgical technique
In the pursuit of maximal safe resection of gliomas, fluorescence guided surgery (FGS) has emerged as an important clinical tool and a focus of substantial translational research efforts.28 The FGS framework consists of administering a fluorescent contrast agent to the patient prior to or during the surgical procedure, illuminating the surgical field with a light source that excites the contrast agent, and filtering the emitted light to produce images of contrast agent distribution, often in real time. For FGS applications designed to identify tumor tissue, fluorescent signals in surrounding normal tissue can have a profound impact on the surgeon’s capacity to distinguish tumor tissue. Thus, effective deployment of FGS requires careful choice of contrast agent and dosing strategies to minimize the confounding influence of normal tissue fluorescence. Sodium fluorescein (NaFl) is a fluorescent dye that has been studied as a marker for resection of brain tumors since 1948.14 Tumor-to-normal contrast of NaFl-FGS is thought to arise from the abnormal vasculature and compromised blood-brain barrier (BBB) in tumor tissue, similar to the source of contrast for gadolinium-based contrast-enhanced MRI scans, which constitute the backbone of planning and intraoperative navigation during brain tumor resection.4,27 Only 376 D in its free form, NaFl is generally thought to bind to blood proteins upon administration, thus assuming the kinetic behavior of these larger molecules. Under this assumption, protein-bound NaFl should be excluded from normal tissue by the BBB while extravasating in regions where tumor has compromised this barrier, providing tumor-to-normal contrast. However, despite decades of investigation, including ongoing studies with the latest imaging instrumentation,1,19,26 clinical data have yet to compel the approval and use of NaFl for this indication in clinical practice. A potential contributing factor is the reported presence of NaFl fluorescence in normal brain tissue observed during these procedures. A report by Suero Molina et al. concluded that NaFl may be most useful as a background tissue marker during 5-aminolevulinic acid–protoporphyrin IX–guided surgery, not as a tumor marker.23 Recent observations during our own clinical study of NaFl showed extensive accumulation of the dye outside the vessels shortly after administration, potentially confounding tumor identification.15
Previous preclinical studies of NaFl in the blood and normal brains of rodents point to a possible explanation for the observed behavior in human brain. Delori et al. have reported that NaFl binds to blood proteins only weakly, resulting in the presence of both free and bound forms of the dye in the circulation,3 while Yen et al. and others have reported the presence of NaFl in normal rodent brain tissue, suggesting that the contrast agent crosses the protective barriers in the brain at measureable concentrations.8,10,29 These reports help establish a hypothesis to explain the observations in humans, namely: a) Upon administration, only a fraction of NaFl binds to endogenous proteins, b) this results in the presence of both large and small fluorescent molecules in the circulation, one form that exceeds 65 kD (NaFl bound to protein) and one form that is only 376 D (free NaFl), c) the unbound dye crosses the protective barriers in the brain into tissue; and d) this behavior is likely time and dose dependent. Confirming this hypothesis would have important implications for the use of NaFl-guided surgery of brain tumors, and indicate that alternative agents with more favorable kinetic behavior should be advanced. A fluorescent agent with behavior similar to that of gadolinium-based MRI (Gd-MRI) would be an attractive choice, especially recognizing the central role Gd-MRI plays in surgical navigation.
The present study has the following aims: 1) to elucidate the time- and dose-dependent relationships between NaFl-protein binding in the blood and dye accumulation in normal brain tissue due to extravasation, 2) to examine the kinetics of an alternative fluorescein-based agent (a 939 D pegylated form of fluorescein, termed “PEG-fluorescein” herein), selected for its similarity to the molecular weight of gadolinium-based contrast agents, and 3) to evaluate the effect of normal tissue extravasation of NaFl and PEG-fluorescein on tumor-to-normal contrast. The kinetic results of each dose/agent were compared and discussed in the context of FGS.
Methods
Sodium Fluorescein and PEG-Fluorescein Kinetics in Blood and Normal Brain Tissue
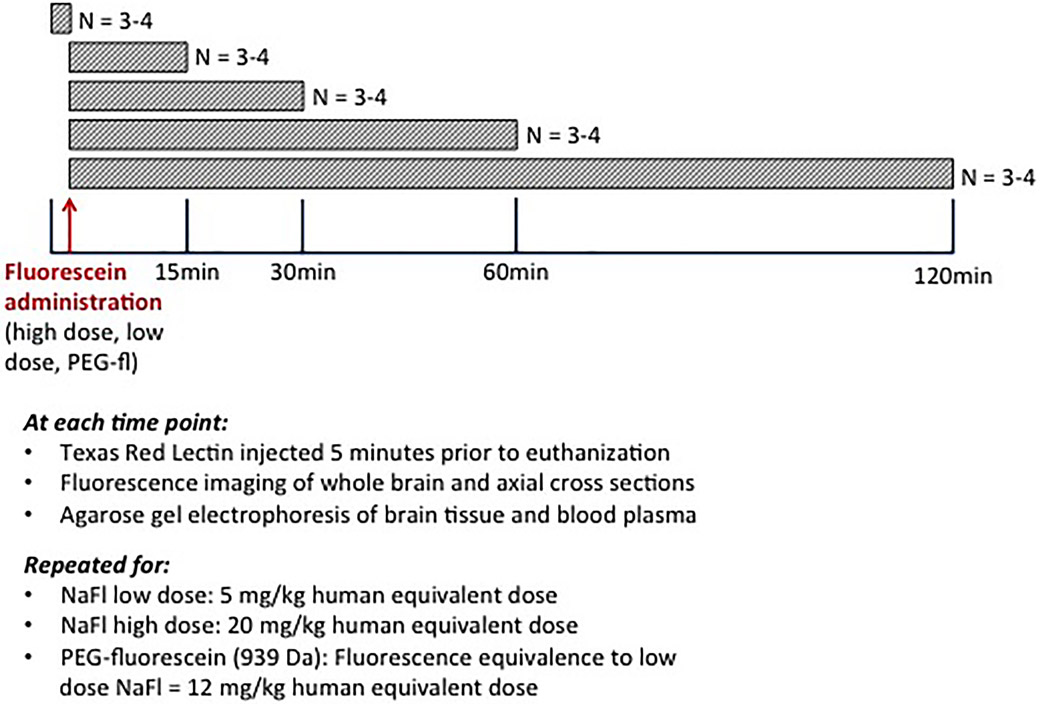
We examined the relative concentration of bound and unbound clinical-grade NaFl (Akorn) in various tissue/blood compartments at different intervals after intravenous administration in mouse models. This was repeated for 2 human equivalent doses (HED) of NaFl (5 mg/kg HED and 20 mg/kg HED, termed “low dose” and “high dose,” respectively) as well as for a 939 D form of pegylated fluorescein (PEG 550 W-fluorescein, Creative PEGWorks). The pegylaged formulation was dosed to ensure that the amount of the administered fluorophore was equivalent between PEG-fluorescein and the low-dose NaFl, as determined by conventional absorbance spectrophotometry, resulting in a by-mass HED of 12 mg/kg.
All experiments were carried out in accordance with protocols approved by the Institutional Animal Care and Use Committee at Dartmouth College. Figure 1 provides a diagrammatic description of the experimental design for the normal brain kinetic study. At each of the 3 administration conditions (low dose, high dose, and PEG-fluorescein), 3–4 animals were sacrificed at 15, 30, 60, and 120 minutes after administration for tissue analysis. Only the high-dose NaFl cohort included a 120-minute time point, due to a faster clearance rate of the low-dose NaFl. Preinjection controls were also included.
Fig. 1.
Explanatory diagram of the blood and normal brain kinetic study. Cohorts of study animals were administered (via tail vein) low-dose NaFL, high-dose NaFl, or pegylated-fluorescein (PEG-fluorescein) at 15, 30, 60, or 120 minutes before euthanasia. Blood and tissue specimens were then harvested and used to analyze the presence of different forms of fluorescein in various tissue/blood compartments. fl= fluorescein. Figure is available in color online only.
Five minutes before euthanasia, animals were injected intravenously with 90 μl of the vascular marker Texas Red Tomato Lectin (Vector Laboratories) at a concentration of 1 mg/ml. At the designated time point after NaFl or PEG-fluorescein administration (and 5 minutes after Lectin/Texas Red administration), subjects were anesthetized with isoflurane and euthanized by a cardiac puncture to remove circulating blood for analysis. Following withdrawal of blood, a surgical incision was made in the chest cavity, a needle placed in the left ventricle, and mice were perfused with ice-cold phosphate-buffered saline (PBS) at a pressure of 100 Hg, until the color of the blood turned clear. This perfusion procedure removed the vascular contribution of fluorescence, enabling assessment of NaFl/PEG-fluorescein in the extravascular tissue. Following the PBS flush, tissues were fixed using a 4% paraformaldehyde perfusion through the mouse. We then examined the following parameters: 1) agarose gel electrophoresis images to determine the ratio of unbound NaFL to protein-bound NaFL in the blood plasma and in normal brain tissue as a function of time; 2) macroscopic images of fluorescein fluorescence in harvested, unsectioned brain (brain surface) as a function of time; and 3) microscopic images of fluorescein and Texas Red fluorescence in frozen brain sections as a function of time.
Details of these procedures are provided below. These analyses were repeated for all 3 conditions and for each time interval examined.
Gel Electrophoresis of Blood and Normal Brain Specimens
Blood samples were spun at 10,000g for 10 minutes, and whole brain tissues were mechanically digested with a tissue homogenizer and then spun at 15,000g for 20 minutes. In both cases, the collected supernate was used for the gel analysis. Gels were formed in a 7 × 8.3–cm or 13.1 × 27.3–cm well chamber apparatus. Agarose and 1× TAE (Tris base, acetic acid and EDTA) buffer were mixed in a 3:1 weight-to-volume ratio and heated until the agarose was fully dissolved. Upon cooling, the solution was poured into the apparatus chamber, covered, and allowed to cool until solid. Dilutions of NaFl, human serum-albumin–bound NaFl (MedChem Express) and PEG-fluorescein were used as control samples in the gels. Two samples per mouse (all cohorts and time points) were loaded into wells at an equal volume of 6.5 μl mixed with 1 μl dye–free loading buffer and run at 95 mV for 35 minutes. Gels were imaged on a Typhoon 9410 (GE Healthcare) scanner (photomultiplier tube setting = 400, 50-μm resolution, and images were analyzed using ImageJ (National Institutes of Health). After background correction, mean fluorescence intensities were determined using a constant-size region of interest (ROI) spatially aligned to the control lanes (unbound/bound/PEG-fluorescein) in the agarose gels. The means and standard errors of animals in each cohort/condition group were computed and reported. Unpaired two-tailed Student t-tests were performed between cohorts using GraphPad Prism 7 (GraphPad Software) with p < 0.05 considered statistically significant.
Macroscopic Fluorescence Images of Normal Brain Specimens
Macroscopic specimen images of superficial whole brains and axial slices were acquired with a Typhoon 9410 (GE Healthcare) scanner (PMT setting = 400, 25-μm resolution), and fluorescence images analyzed using ImageJ. After background correction, mean fluorescence intensities of the resulting images were determined using user-defined ROIs of different brain regions. The means and standard errors in each cohort/condition group were computed and reported. Statistical comparisons were determined as described in the Gel Electrophoresis subsection above.
Fluorescence Microscopy of Normal Brain Specimens
Axial sections of brain tissue were snap frozen in optimal cutting temperature gel following fluorescence imaging. Samples were stored at −80°C and covered in aluminum foil. Frozen tissue was sectioned to a thickness of approximately 40 microns and imaged using the Olympus BX51 Inverted fluorescence microscope. High-magnification images were captured at an exposure time of 1.39 seconds during acquisition using the fluorescein filter and auto exposure during acquisition of images using the red filter (Texas Red, Tomato Lectin).
Tumor-to-Normal Contrast in Tumor Xenografts
Tumor and normal brain tissue uptake of NaFl (low dose) and PEG-fluorescein (fluorescence-equivalent dose to low-dose NaFl) in glioma xenografts were examined. Female nude mice were implanted with 1 × 10⁶ U251 cells using surgical procedures previously described.17 Approximately 5 weeks after implantation, Gd-MRI (Siemen’s 3.0-T Open Bore Skyra) was completed to confirm the presence of intracranial tumors. Mice were then randomized into NaFl or PEG-fluorescein cohorts. NaFl or PEG-fluorescein was administered intravenously, and 60 minutes after injection mice were euthanized and whole brains removed (4 mice per cohort). Three mice that were not administered NaFl or PEG-fluorescein served as controls. Axial brain slices of approximately 2-mm thickness were imaged using the Typhoon FLA 7000 (GE Healtcare, PMT = 500, 25-μm resolution). Imaged specimens were then processed for histological examination to confirm presence of tumor.
Mean fluorescence intensities were calculated for tumor regions identified with guidance from the presacrifice Gd-MRI images and H & E–stained slides. Mean fluorescence intensities in normal brain were calculated from ROIs in the contralateral brain using ImageJ. The means and standard errors of tumor, normal, and tumor-to-normal contrast for animals in each cohort/condition group were computed and reported. Statistical comparisons were determined as described in the Gel Electrophoresis subsection above.
Results
Kinetics of Protein-Bound and Unbound NaFl in Circulating Blood
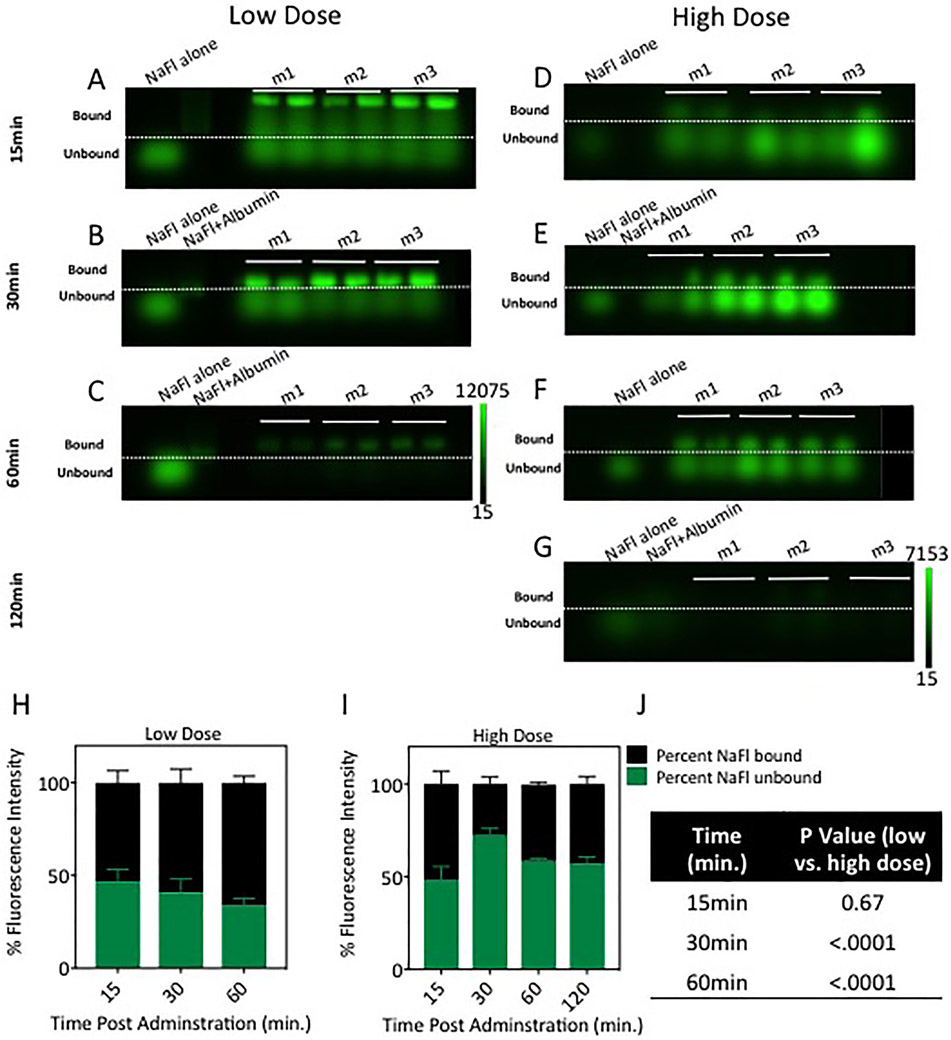
To examine the kinetics of NaFl binding to proteins in circulating blood, gel electrophoresis was used to quantify the relative contribution of bound and unbound NaFl in circulating blood at 15, 30, 60, and 120 minutes after NaFl administration. The raw NaFl fluorescence images of all gels are presented in Figs. 2A-G, which show fluorescence distributed in bands based on molecular weight (3 mice per time point per dose). Qualitative inspection of these images suggests that the ratio of bound and unbound NaFl changes over time and is dependent on injected dose. Quantitative analysis was performed by using the mean intensity in each band to compute the relative contribution to the fluorescence signal from bound and unbound NaFl. These results are plotted in Fig. 2H and J and show that unbound NaFl contributes between 35% and 72% of the fluorescence signal under the conditions examined. The contribution of unbound NaFl was lower for a lower-dose administration versus the high-dose counterpart. This difference was statistically significant 30 and 60 minutes after administration (p < 0.0001). In the low-dose case, the ratio of unbound to bound NaFl decreased over time. The observed behavior of this ratio in the high-dose case was less consistent, spiking to 72% after 30 minutes and stabilizing at around 60% for the remaining 90 minutes.
Fig. 2.
Quantification of unbound and bound NaFl in the blood circulation. Gel electrophoresis images of NaFl in blood serum at different times after administration are presented in A–G; low-dose administration data are shown in A–C and high dose in D–G. In a given gel panel, the columns represent, from left to right, the following: control containing diluted stock unbound NaFl (NaFl alone), control containing stock NaFl prebound to albumin (NaFl+Albumin), and blood samples from each of 3 mice (m1, m2, and m3 [2 samples were run per mouse]). The dashed lines delineate bound NaFl (above the dotted line) from unbound NaFl (below the dashed line), which were separated by weight in the gel. The percentages of the total fluorescent signal originating from the unbound and bound NaFl, computed from the gel images, are shown in H and I. Table of p values showing the difference in the percentage of unbound fluorescein between low- and high-dose cohorts at 15, 30, and 60 minutes postadministration is shown in J. Figure is available in color online only.
This observed behavior has implications for the kinetics of NaFl in normal brain tissue. While unbound NaFl is of a molecular weight generally considered to cross the BBB, NaFl bound to endogenous proteins have little probability of crossing an intact barrier.
Presence of Protein-Bound and Unbound NaFl in Brain Tissue
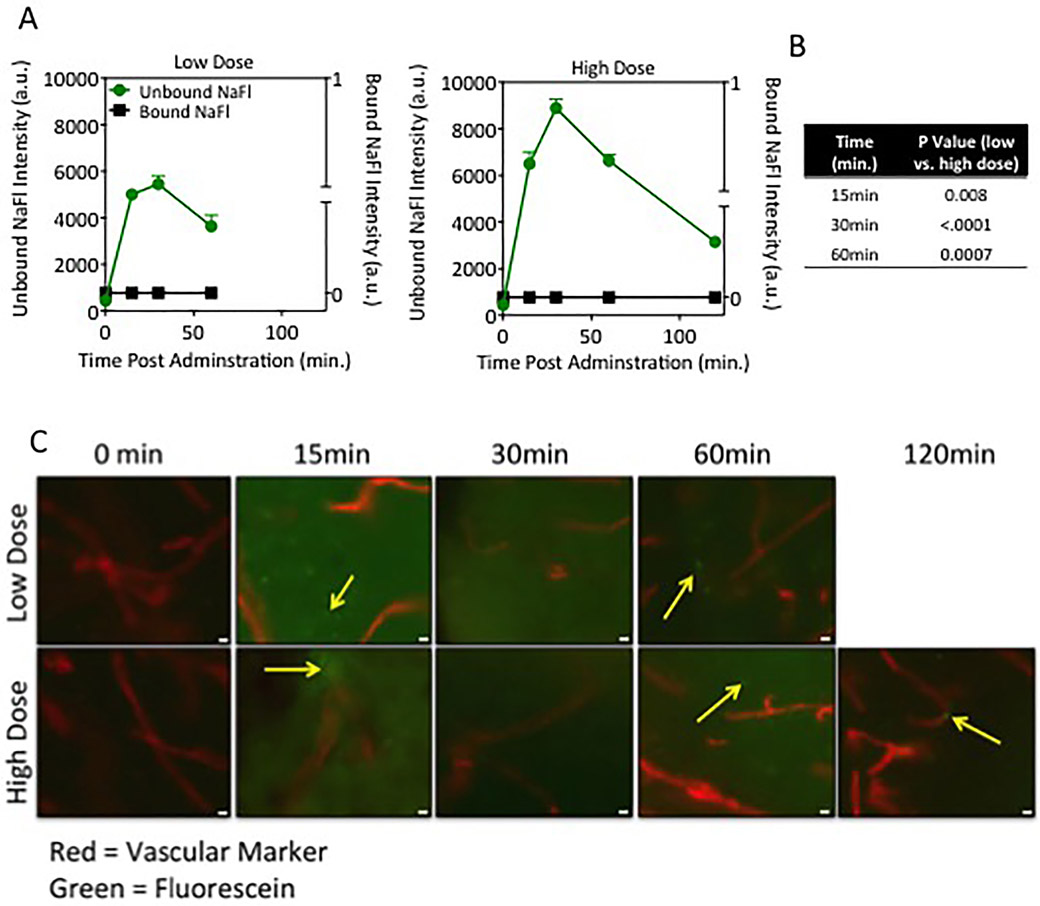
To determine the relative contribution of bound and unbound NaFl in the brain tissue, gel electrophoresis was performed on the supernate of whole brain tissue extracts harvested at 15, 30, 60 and 120 minutes after administration. Since animals were perfused with PBS to remove blood from the vasculature after euthanasia, these measurements exclude contributions of blood. Time courses of bound and unbound NaFl in normal brain tissue for low- and high-dose injections are shown in Fig. 3A. These results indicate that unbound NaFl extravasates into normal brain tissue, whereas the NaFl molecules bound to endogenous proteins, which are substantially larger, are confined to the vasculature. The presence of unbound NaFl in normal brain tissue is dose and time dependent: the peak fluorescence intensity of unbound NaFl was 1.6 times higher in the high-dose cohorts than the low-dose cohorts (p < 0.005). In both cases, NaFl fluorescence in the brain tissue peaked at 30 minutes after injection and decreased thereafter. Fluorescence was reduced by 33% and 25% at 60 minutes for low- and high-dose cohorts, respectively.
Fig. 3.
Unbound NaFl crosses the BBB and extravasates into normal brain tissue. A: Quantitation of unbound and bound NaFl detected in whole brain extracts calculated from gel electrophoresis (a.u. = arbitrary units). B: Table of p values showing the difference between the amount of unbound fluorescein in normal brain tissue between low- and high-dose cohorts at all corresponding time points (15, 30, and 60 minutes) after administration. C: Representative fluorescence photomicrographs of naïve brain tissue sections 15, 30, 60, and 120 minutes post–NaFl administration. Original magnification ×20; scale bar = 20 μm. The red structures indicate lectin-stained vessels and green fluorescence indicates NaFl (n = 3–4 mice/group).
Fluorescence microscopy images of NaFl and the lectin-based vascular marker dye in sectioned brain tissue confirmed the presence of NaFl in the tissue. Representative microscopy images are presented in Fig. 3B and show the presence of NaFl fluorescence outside the blood vessels in the cortex of the brain.
Macroscopic Fluorescence Imaging of Brain Tissue ex Vivo
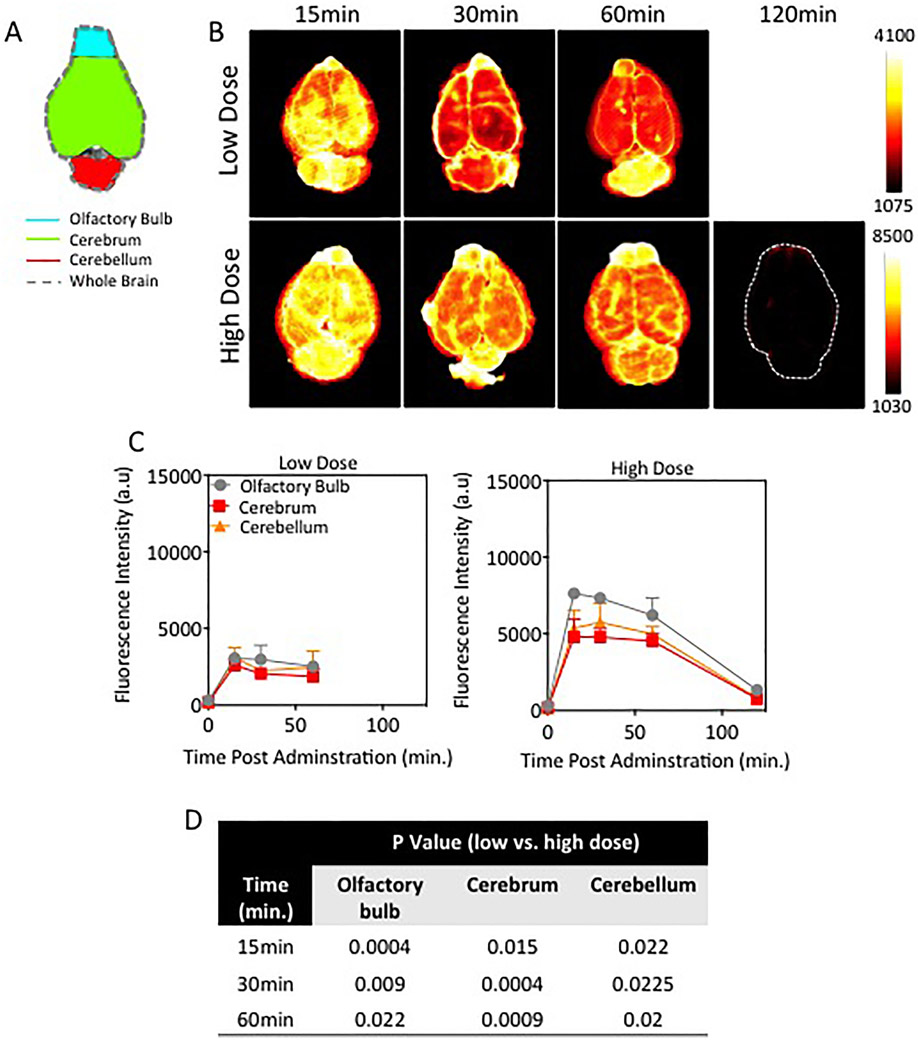
Representative fluorescence images of ex vivo brain tissue at 15, 30, 60, and 120 minutes post–NaFl administration (low and high doses) are provided in Fig. 4A. Because the animals had undergone PBS perfusion to clear intravascular NaFl, these images represent the macroscopic extravascular distribution of NaFl in the superficial layers of the brain. A qualitative review of the images confirms widespread uptake of NaFl in the tissue. A quantitative analysis of macroscopic brain substructures, shown in Fig. 4B, revealed differences in fluorescence intensity among the olfactory bulb, cerebellum, and cerebrum. The highest fluorescence intensity was observed in the olfactory bulb and lowest in the cerebrum, an observation that was consistent between the high- and low-dose NaFl administrations. With the exception of the cerebellum at the high dose, the intensity peaked at the earliest time point measured (15 minutes) and decreased over time, regardless of administered dose. Peak intensity in the cerebellum in the high-dose case was observed at 30 minutes.
Fig. 4.
Superficial distribution of NaFl in the naive rodent brain. A: Schematic of mouse brain outlining ROIs (olfactory bulb, cerebrum, and cerebellum) analyzed for spatial and temporal distribution of NaFl. B: Representative fluorescence images of ex vivo naïve brains at different times after administration of low- or high-dose NaFl. C: Time-dependent NaFl fluorescence intensity in normal brain regions (n = 3–4 mice/time point/dose). D: Table of p values showing the difference in the amount of superficial fluorescein fluorescence between low- and high-dose experimental cohorts is exhibited. Figure is available in color online only.
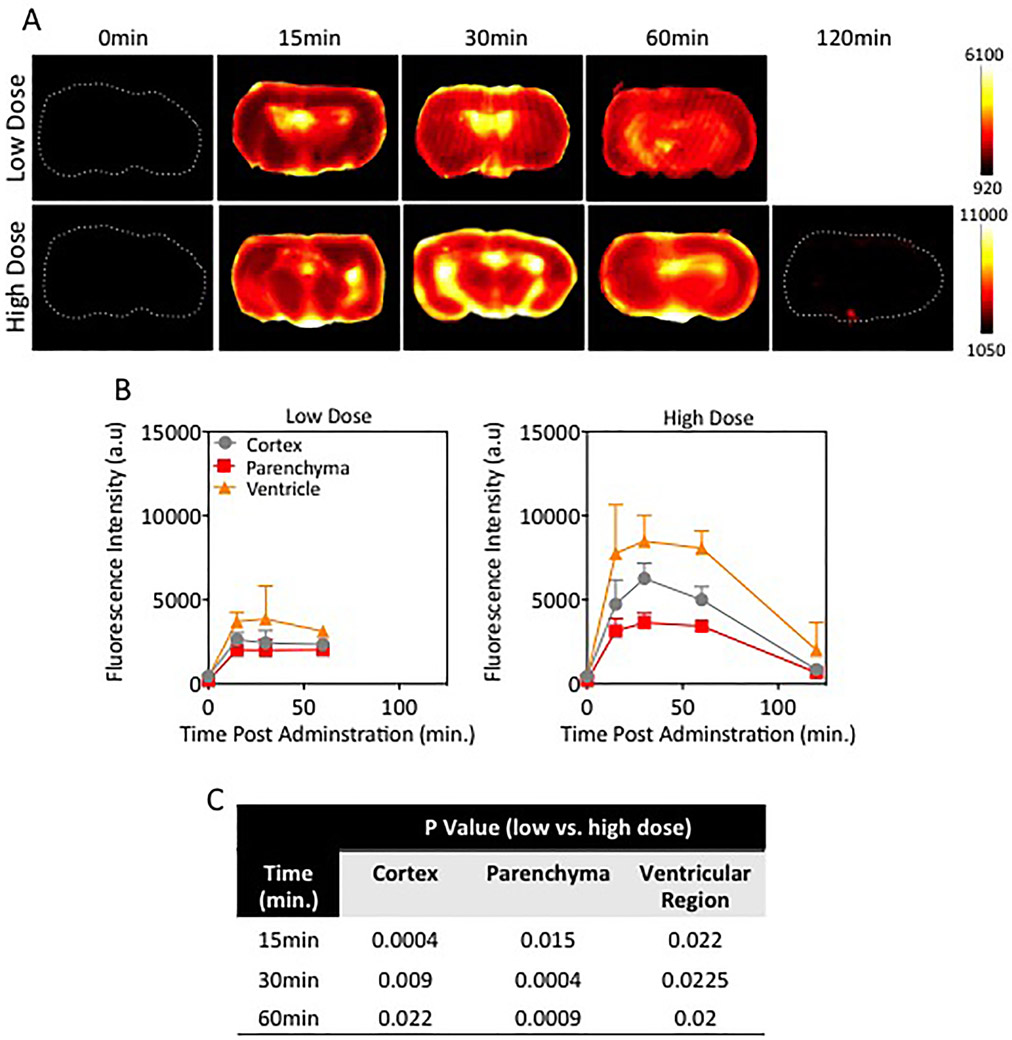
A similar analysis was completed on axial cross-sections of brain tissue. Representative images are shown in Fig. 5A and corresponding quantitative values in the cortex, parenchyma, and ventricles in Fig. 5B. In all animals, fluorescence intensity values were highest within or near the ventricular regions as compared to the cortex and parenchymal regions. Peak intensity was observed at 30 minutes, and it decreased thereafter, though the rate of clearance was slower in the low-dose group. The difference in fluorescence intensities between low- and high-dose cohorts was statistically significant for every time point and every tissue region, with the exception of the cortex and ventricular regions at 15 minutes (p = 0.074 and p = 0.076, respectively).
Fig. 5.
Extravasation of NaFl from internal regions within the naïve brain. A: Representative fluorescence images of axial sections from the naïve midbrain in mice injected with a low or high dose of NaFl at different time points after administration. B: Time-dependent fluorescence intensity in subregions (cortex, parenchyma, and ventricles) of axial cross sections from naïve rodent brains (n = 3–4 mice/time point/dose). C: Table displaying p values from the comparison of fluorescein fluorescence in brain subregions (cortex, parenchyma, and ventricular regions) in low-versus high-dose experimental cohorts. Figure is available in color online only.
Kinetics of Pegylated Fluorescein in Blood and Brain Tissue
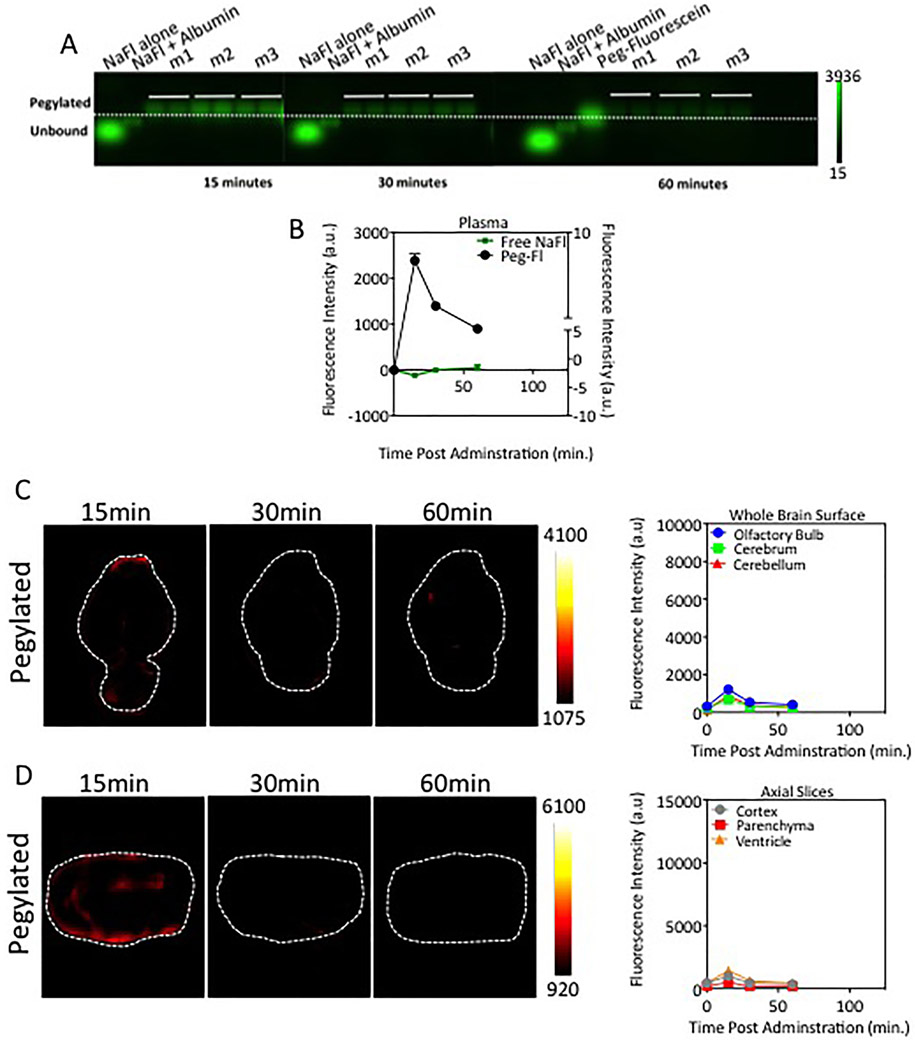
We measured the normal brain uptake kinetics of a pegylated form of fluorescein with molecular weight similar to that of gadolinium-based agents. Electrophoresis gel data showing PEG-fluorescein in the blood at 15, 30, and 60 minutes after administration are provided in Fig. 6A. Unbound fluorescein was undetectable, indicating that PEG-fluorescein is stable in the blood circulation. Representative fluorescent images of whole brain and axial brain sections, shown in Fig. 6B and C, exhibited unrecognizable levels of fluorescence in tissue samples after 15 minutes after PEG-fluorescein administration. Mean values of PEG-fluorescein in the superficial and axial cross-sections of brain are provided in Fig. 6B and C, respectively. These data show minimal levels of PEG-fluorescein in normal brain tissue. A detectable signal of PEG-fluorescein was observed 15 minutes after injection in macroscopic brain structures; however, this was 68% and 84% lower than that observed in the low- and high-dose nonpegylated fluorescein administrations, respectively. The decrease in fluorescence intensity provided by PEG-fluorescein compared to either low- or high-dose NaFl was statistically significant for all time points and all subregions analyzed. This reduction in normal tissue fluorescence has implications for the achievable contrast in FGS in the brain.
Fig. 6.
Pegylated-fluorescein administration results in reduced accumulation in normal brain tissue. A: Agarose gels of PEG-fluorescein in the blood. Similar to Fig. 3, the columns represent, from left to right, the following: control containing diluted stock unbound NaFl (NaFl alone), control containing stock NaFl prebound to albumin (NaFl+Albumin), PEG-fluorescein control, and fluorescence signals from blood samples from each of 3 mice (m1, m2, and m3 (2 samples were run per mouse]). B: Temporal behavior of pegylated-fluorescein in the blood, computed from the gels is displayed. C: Representative fluorescence images of whole brain surface distribution of pegylated-fluorescein and the fluorescence intensity over time in superficial brain regions (olfactory bulb, cerebrum, and cerebellum) for pegylated-fluorescein. D: Fluorescence axial sections of ex vivo brain samples postadministration of PEG-fluorescein and the fluorescence intensity of PEG-fluorescein in the internal brain subregions (cortex, parenchyma and ventricular regions) measured from brain slices. The pegylated form shows much lower transport into normal brain tissue. All scales (color scales and y-axis in quantitative graphs) were set to provide direct comparison to low-dose NaFl cohorts in Figs. 4B and C and 5A and B. Figure is available in color online only.
Tumor Contrast of NaFl and PEG-Fluorescein in an Orthotopic Glioma Model
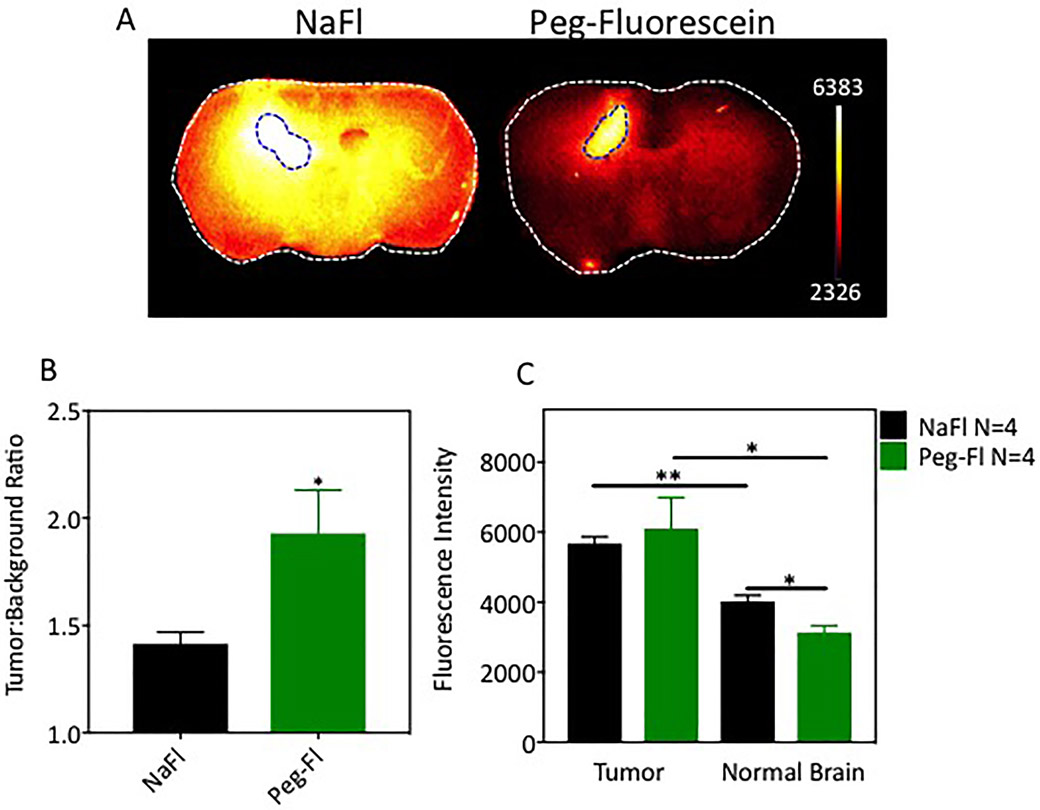
Representative fluorescence images of tissue sections from tumor-bearing brains 60 minutes after administration of NaFl or PEG-fluorescein are shown in Fig. 7A; true tumor regions are outlined with dotted lines. Qualitative assessment of these images suggests higher normal brain uptake and lower tumor contrast in the NaFl cohort. Quantitative assessment of all animals confirms this observation as tumor-to-normal contrast was 38% (p < 0.05) higher for PEG-fluorescein than for NaFl, as shown in Fig. 7B. This increase in contrast is due entirely to the reduced normal tissue uptake of PEG-fluorescein compared to NaFl (Fig. 7C). Indeed, NaFl and PEG-fluorescein show nearly identical uptake in the tumor, yet the reduced uptake of PEG-fluorescein in the normal tissue results in significantly higher tumor contrast.
Fig. 7.
Pegylated-fluorescein and NaFl in glioma-bearing brains. A: Representative fluorescence images of axial slices of excised brains 60 minutes after administration of NaFl or PEG-fluorescein (true tumors are outlined with blue dashed line). B: Tumor-to–contralateral normal brain tissue contrast for NaFl and PEG-fluorescein. C: Fluorescence signal intensity in tumor and normal regions. *p < 0.05; **p < 0.005 (n = 4 mice per cohort).
Discussion
A primary aim of FGS when applied to tumor resection is to help distinguish pathological tissue from normal tissue. Thus, the use of contrast agents and imaging strategies that minimize uptake in normal tissue is critical.7 The inherent tumor selectivity arising from differential contrast agent transport through intact and tumor-compromised protective barriers in the brain can provide high levels of contrast, as commonly observed in gadolinium-enhanced MRI. This mechanism is unique to brain tumors and holds promise even for nonspecific agents.
Our observations reveal a complex interaction between NaFl–protein binding and normal brain tissue uptake with significant implications for tumor-to-normal brain contrast. Upon administration, NaFl binds weakly to blood proteins, resulting in a mixture of unbound NaFl and NaFl bound to endogenous proteins. Importantly, the unbound dye can constitute up to 70% of the total fluorescence signal in the circulation under conditions that match human dosing. While the protein-bound dye, composed of relatively large molecules (66 kD), remains in the circulation, the 376 D unbound dye penetrates the normal brain tissue readily, crossing the blood-brain and CSF barriers. High concentrations of unbound NaFl were found throughout the brain. Fluorescence distribution is initially heterogeneous, with the highest concentrations near the ventricles, likely due to leakage from the CSF barrier, which is known to be more permeable than the BBB,20 yet decreases and becomes more uniform over time, generally consistent with diffuse transport mechanisms. The presence of NaFl in uncompromised brain has been reported previously,8,10,29 but, to our knowledge, prior studies have not quantified this transport in the context of unbound and bound forms in the circulation over time and have not examined the implications for FGS of tumors.
The absolute and relative concentrations of unbound and bound NaFl in the blood depend on the injected dose and the elapsed time after injection. Consequently, the overall fluorescence signal in the normal brain tissue arising from unbound NaFl is also time dependent, peaking between 15 and 30 minutes after injection and decreasing thereafter. Thus, careful consideration should be given to dosing and administration interval if NaFl is to be used in clinical studies. To date, administration-to-resection intervals (as well as dosage) used in clinical studies of NaFl-FGS for tumor resections have varied widely, from immediate to 3 hours.19 At longer time intervals, the NaFl in the normal brain is well below peak levels, potentially establishing conditions for improved tumor-to-normal contrast; however, NaFl also clears from the tumor over this period,21 reducing signal strength in the abnormal tissue.
In our view, any transport of contrast agent into the normal brain through the protective barriers undermines the inherent advantage of tumor imaging in the brain and justifies pursuit of alternative or modified agents for this indication. Toward this end, we examined the kinetics of fluorescein modified with PEG to increase the molecular size to 939 D, in an effort to prevent penetration into the normal brain tissue. The resulting data confirmed this hypothesis: pegylated-fluorescein did not dissociate in the blood and was detected at very low levels in brain tissue, even at early time points after injection. This reduced normal uptake of pegylated-fluorescein in normal brain translated directly to higher tumor-to-normal contrast compared to NaFl. Specifically, while tumor uptake of both agents was comparable, the observed increase in contrast was driven exclusively by the reduced pegylated-fluorescein uptake in normal brain. These results suggest that this formulation may provide markedly improved tumor delineation.
In this study, we selected a pegylated-fluorescein molecule that most closely matches the size of gadolinium-based MRI contrast agents. Using an optical contrast agent with kinetic behavior that resembles that of gadolinium-based agents opens the door to several possibilities in clinical surgery. Gadolinium-enhanced MR images are commonly displayed for intraoperative guidance during surgery; however, the relevance of these images decreases as tissue is removed or ablated during the procedure.30 Using an optical contrast agent with kinetics similar to gadolinium may enable optical–MR image coregistration and facilitate updates of the guiding MR images during surgery. Additionally, an optical agent that behaves like gadolinium-based agents would provide high tumor-to-normal contrast shortly after administration, precluding the need to plan and time preoperative dye administration.
Other researchers have examined increasing the size of NaFl by preconjugation to human serum albumin and tested this formulation for FGS in brain tumor resection.5,9,11 However, these reports indicate that the human serum albumin–NaFl molecules dissociate, resulting in the presence of unbound NaFl in tumor samples. Observations in our lab in animal models (data not shown) confirm that this form of NaFl disassociates in blood circulation. These larger molecules also clear slowly from the circulation, requiring long incubation times (approximately 1–4 days), which is unfavorable for widespread clinical adoption.
Much of the cutting-edge research in FGS focuses on imaging targeted or environment-sensitive agents;2,6,12,16,18 however, there is still substantial interest and research in nonspecific agents that exploit the vascular abnormalities found in most tumors, such as NaFl and indocyanine green.13,22 These agents often already have a clinical foothold in other indications, have a safety record, and are envisioned as stand-alone or complementary tools for FGS. Combining these nonspecific agents with targeted agents with dual-agent compartment modeling can also help account for the effects of delivery and reveal more accurate information about the molecular targets.24,25
The methodology described herein is generally applicable to study other contrast agents and represents a straightforward strategy for examining fluorescence contrast agent behavior in vivo, especially for agents with unknown or unstable interactions with endogenous proteins. Deploying mechanical tissue digestion and gel analysis enables tracking of bound and unbound dye in both blood and extravascular tissue to elucidate the potential strengths and pitfalls of a new or established contrast agent.
Conclusions
The results presented here suggest that NaFl’s multicomponent behavior in blood and consequential transport through protective barriers in the brain reduces its attractiveness as an agent for FGS. At a minimum, careful consideration should be given to dose and incubation times to optimize diagnostic performance. In contrast, a larger, 939 D pegylated form of fluorescein showed more favorable kinetic behavior in normal brain tissue, which directly resulted in increased tumor contrast in glioma xenografts. These results strongly suggest that rationally designed fluorescein-based contrast agents would be a more suitable choice for FGS of glioma than standard NaFl. Ideally, a new fluorescein-based agent would serve as an optical analog to gadolinium, potentially providing real-time quantitative kinetic analysis of contrast agent uptake in the surgical field and/or surgical field fluorescence inputs to coregister and update Gd-MRI navigation scans during surgery. These capabilities may readily be pursued through further translational development of pegylated fluorescein.
Acknowledgments
The authors would like to thank Dr. Kenneth Tichauer for discussions and insights relevant to this study. We also thank Abigail M. Fellows and Dr. Jay Buckey for supplying the clinical-grade NaFl used in these studies. This work was funded by NIH grant R01CA184354 (S.C.D.).
Abbreviations
- BBB
blood-brain barrier
- FGS
fluorescence guided surgery
- HED
human equivalent dose
- NaFl
sodium fluorescein
- PBS
phosphate-buffered saline
- ROI
region of interest
Footnotes
Disclosures
The authors report no conflict of interest concerning the materials or methods used in this study or the findings specified in this paper.
Previous Presentations
Portions of this work were presented in abstract form at the 2017 World Molecular Imaging Congress, Philadelphia, Pennsylvania, September 16, 2017.
References
- 1.Acerbi F, Broggi M, Eoli M, Anghileri E, Cuppini L, Pollo B, et al. : Fluorescein-guided surgery for grade IV gliomas with a dedicated filter on the surgical microscope: preliminary results in 12 cases. Acta Neurochir (Wien) 155:1277–1286, 2013 [DOI] [PubMed] [Google Scholar]
- 2.Anderson CF, Cui H: Protease-sensitive nanomaterials for cancer therapeutics and imaging. Ind Eng Chem Res 56:5761–5777, 2017 [DOI] [PMC free article] [PubMed] [Google Scholar]
- 3.Delori FC, Castany MA, Webb RH: Fluorescence characteristics of sodium fluorescein in plasma and whole blood. Exp Eye Res 27:417–425, 1978 [DOI] [PubMed] [Google Scholar]
- 4.Dimou S, Battisti RA, Hermens DF, Lagopoulos J: A systematic review of functional magnetic resonance imaging and diffusion tensor imaging modalities used in presurgical planning of brain tumour resection. Neurosurg Rev 36:205–214, 2013 [DOI] [PubMed] [Google Scholar]
- 5.Ding R, Frei E, Fardanesh M, Schrenk HH, Kremer P, Haefeli WE: Pharmacokinetics of 5-aminofluorescein-albumin, a novel fluorescence marker of brain tumors during surgery. J Clin Pharmacol 51:672–678, 2011 [DOI] [PubMed] [Google Scholar]
- 6.Elliott JT, Dsouza AV, Marra K, Pogue BW, Roberts DW, Paulsen KD: Microdose fluorescence imaging of ABY-029 on an operating microscope adapted by custom illumination and imaging modules. Biomed Opt Express 7:3280–3288, 2016 [DOI] [PMC free article] [PubMed] [Google Scholar]
- 7.Frangioni JV: The problem is background, not signal. Mol Imaging 8:303–304, 2009 [PubMed] [Google Scholar]
- 8.Hoffman HJ, Olszewski J: Spread of sodium fluorescein in normal brain tissue. A study of the mechanism of the blood-brain barrier. Neurology 11:1081–1085, 1961 [DOI] [PubMed] [Google Scholar]
- 9.Ichioka T, Miyatake S, Asai N, Kajimoto Y, Nakagawa T, Hayashi H, et al. : Enhanced detection of malignant glioma xenograft by fluorescein-human serum albumin conjugate. J Neurooncol 67:47–52, 2004 [DOI] [PubMed] [Google Scholar]
- 10.Kozler P, Pokorný J: Altered blood-brain barrier permeability and its effect on the distribution of Evans blue and sodium fluorescein in the rat brain applied by intracarotid injection. Physiol Res 52:607–614, 2003 [PubMed] [Google Scholar]
- 11.Kremer P, Fardanesh M, Ding R, Pritsch M, Zoubaa S, Frei E: Intraoperative fluorescence staining of malignant brain tumors using 5-aminofluorescein-labeled albumin. Neurosurgery 64 (3 Suppl):ons53–ons61, 2009 [DOI] [PubMed] [Google Scholar]
- 12.Lamberts LE, Koch M, de Jong JS, Adams ALL, Glatz J, Kranendonk MEG, et al. : Tumor-specific uptake of fluorescent bevacizumab-IRDye800CW microdosing in patients with primary breast cancer: a phase I feasibility study. Clin Cancer Res 23:2730–2741, 2017 [DOI] [PubMed] [Google Scholar]
- 13.Lieto E, Galizia G, Cardella F, Mabilia A, Basile N, Castellano P, et al. : Indocyanine green fluorescence imaging-guided surgery in primary and metastatic liver tumors. Surg Innov 25:62–68, 2018 [DOI] [PubMed] [Google Scholar]
- 14.Moore GE, Peyton WT, Hunter SW, French L: The clinical use of sodium fluorescein and radioactive diiodofluorescein in the localization of tumors of the central nervous system. Minn Med 31:1073–1076, 1948 [PubMed] [Google Scholar]
- 15.Roberts DW, Olson J: Fluorescein guidance in glioblastoma resection. N Engl J Med 376:e36, 2017 [DOI] [PMC free article] [PubMed] [Google Scholar]
- 16.Rosenthal EL, Warram JM, de Boer E, Chung TK, Korb ML, Brandwein-Gensler M, et al. : Safety and tumor specificity of cetuximab-IRDye800 for surgical navigation in head and neck cancer. Clin Cancer Res 21:3658–3666, 2015 [DOI] [PMC free article] [PubMed] [Google Scholar]
- 17.Samkoe KS, Gibbs-Strauss SL, Yang HH, Khan Hekmatyar S, Hoopes PJ, O’Hara JA, et al. : Protoporphyrin IX fluorescence contrast in invasive glioblastomas is linearly correlated with Gd enhanced magnetic resonance image contrast but has higher diagnostic accuracy. J Biomed Opt 16:096008, 2011 [DOI] [PMC free article] [PubMed] [Google Scholar]
- 18.Samkoe KS, Gunn JR, Marra K, Hull SM, Moodie KL, Feldwisch J, et al. : Toxicity and pharmacokinetic profile for single-dose injection of ABY-029: a fluorescent anti-EGFR synthetic affibody molecule for human use. Mol Imaging Biol 19:512–521, 2017 [DOI] [PMC free article] [PubMed] [Google Scholar]
- 19.Schebesch KM, Brawanski A, Hohenberger C, Hohne J: Fluorescein sodium-guided surgery of malignant brain tumors: history, current concepts, and future project. Turk Neurosurg 26:185–194, 2016 [DOI] [PubMed] [Google Scholar]
- 20.Segal MB: The choroid plexuses and the barriers between the blood and the cerebrospinal fluid. Cell Mol Neurobiol 20:183–196, 2000 [DOI] [PMC free article] [PubMed] [Google Scholar]
- 21.Stummer W: Poor man’s fluorescence? Acta Neurochir (Wien) 157:1379–1381, 2015 [DOI] [PMC free article] [PubMed] [Google Scholar]
- 22.Stummer W, Suero Molina E: Fluorescence imaging/agents in tumor resection. Neurosurg Clin N Am 28:569–583, 2017 [DOI] [PubMed] [Google Scholar]
- 23.Suero Molina E, Wölfer J, Ewelt C, Ehrhardt A, Brokinkel B, Stummer W: Dual-labeling with 5-aminolevulinic acid and fluorescein for fluorescence-guided resection of high-grade gliomas: technical note. J Neurosurg 128:399–405, 2018 [DOI] [PubMed] [Google Scholar]
- 24.Tichauer KM, Samkoe KS, Sexton KJ, Hextrum SK, Yang HH, Klubben WS, et al. : In vivo quantification of tumor receptor binding potential with dual-reporter molecular imaging. Mol Imaging Biol 14:584–592, 2012 [DOI] [PMC free article] [PubMed] [Google Scholar]
- 25.Tichauer KM, Wang Y, Pogue BW, Liu JT: Quantitative in vivo cell-surface receptor imaging in oncology: kinetic modeling and paired-agent principles from nuclear medicine and optical imaging. Phys Med Biol 60:R239–R269, 2015 [DOI] [PMC free article] [PubMed] [Google Scholar]
- 26.Wallace MB, Meining A, Canto MI, Fockens P, Miehlke S, Roesch T, et al. : The safety of intravenous fluorescein for confocal laser endomicroscopy in the gastrointestinal tract. Aliment Pharmacol Ther 31:548–552, 2010 [DOI] [PubMed] [Google Scholar]
- 27.Wang LL, Leach JL, Breneman JC, McPherson CM, Gaskill-Shipley MF: Critical role of imaging in the neurosurgical and radiotherapeutic management of brain tumors. Radiographics 34:702–721, 2014 [DOI] [PubMed] [Google Scholar]
- 28.Xi L, Jiang H: Image-guided surgery using multimodality strategy and molecular probes. Wiley Interdiscip Rev Nanomed Nanobiotechnol 8:46–60, 2016 [DOI] [PubMed] [Google Scholar]
- 29.Yen LF, Wei VC, Kuo EY, Lai TW: Distinct patterns of cerebral extravasation by Evans blue and sodium fluorescein in rats. PLoS One 8:e68595, 2013 [DOI] [PMC free article] [PubMed] [Google Scholar]
- 30.Zhang ZZ, Shields LB, Sun DA, Zhang YP, Hunt MA, Shields CB: The art of intraoperative glioma identification. Front Oncol 5:175, 2015 [DOI] [PMC free article] [PubMed] [Google Scholar]


