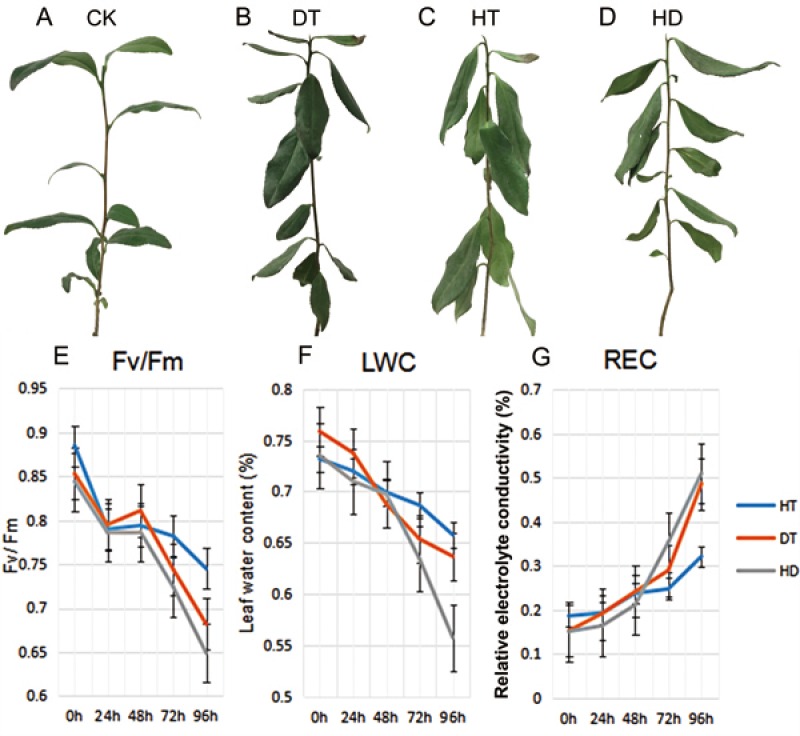
Figure 1. The phenotypes and physiological analyses of tea plants under CK, DT, HT and HD.
(A) A good tea plant was found after 96 h of normal condition. (B) A number of wilted and few curly leaves were found after 96 h of drought treatment (DT). (C) A few mild wilting leaves were found after 96 h of heat treatment (HT). (D) Many distinct wrinkles and brittle leaves were found after 96 h of combined drought and heat treatment (HD). (E) Leaf maximum photochemical quantum yield of PS II (Fv/Fm) values were determined at five time-points (0, 24, 48, 72 and 96 h) during DT, HT and HD. (F) Leaf water content (LWC) values were determined at five time-points during DT, HT and HD. (G) Leaf electrolyte conductivity (REC) values were determined at five time-points during DT, HT and HD. DT, drought stress; HT, heat stress; HD, heat and drought stress.

