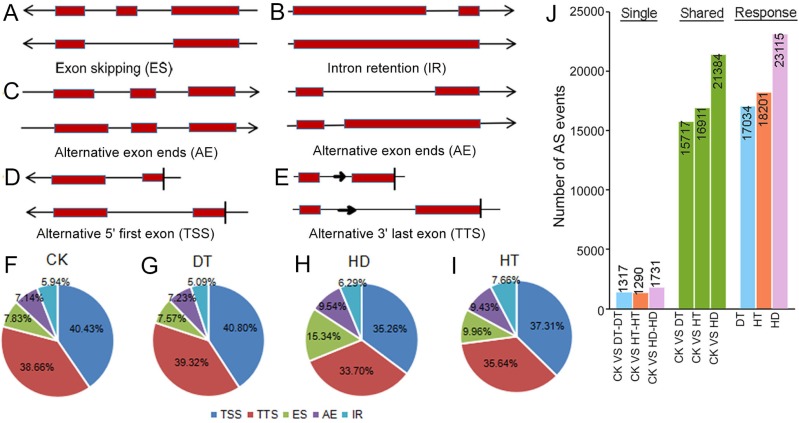
Figure 2. Summary of alternative splicing (AS) events in tea leaves.
(A) Schematic representation of intron retention (IR), (B) exon skipping (ES), (C) alternative exon ends (AE), (D) alternative 5′ first exon (TSS) and (E) alternative 3′ last exon (TTS). (F) Statistics of the number of five AS events under CK, (G) DT, (H) HT and (I) HD. (J) The histogram showing the number of common and specific AS events during DT, HT and HD. The histogram of CK VS DT-DT: the number of AS events only detected in DT compared with CK. The histogram of CK VS DT: the number of common AS events detected in CK and DT. The histogram of DT: total number of AS events detected in DT.

