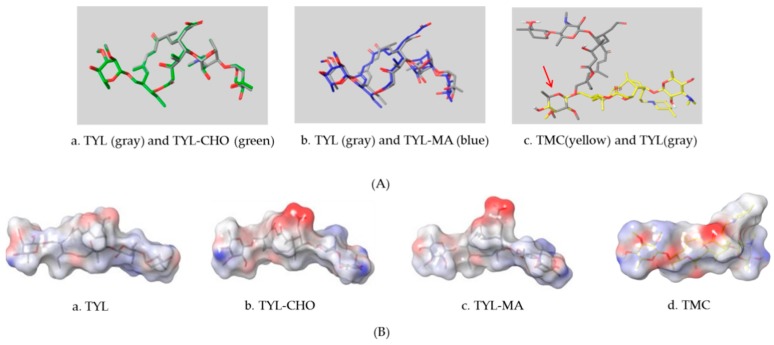
Figure 2.
The alignment and electrostatic potential isosurfaces of haptens and target. (A) The structural alignment view, the red arrow point to the overlapping group between TYL and TMC; (B) The electrostatic potential isosurfaces, the blue areas indicate positive potential, the white areas indicate neutral potential, and the red areas indicate negative potential.

