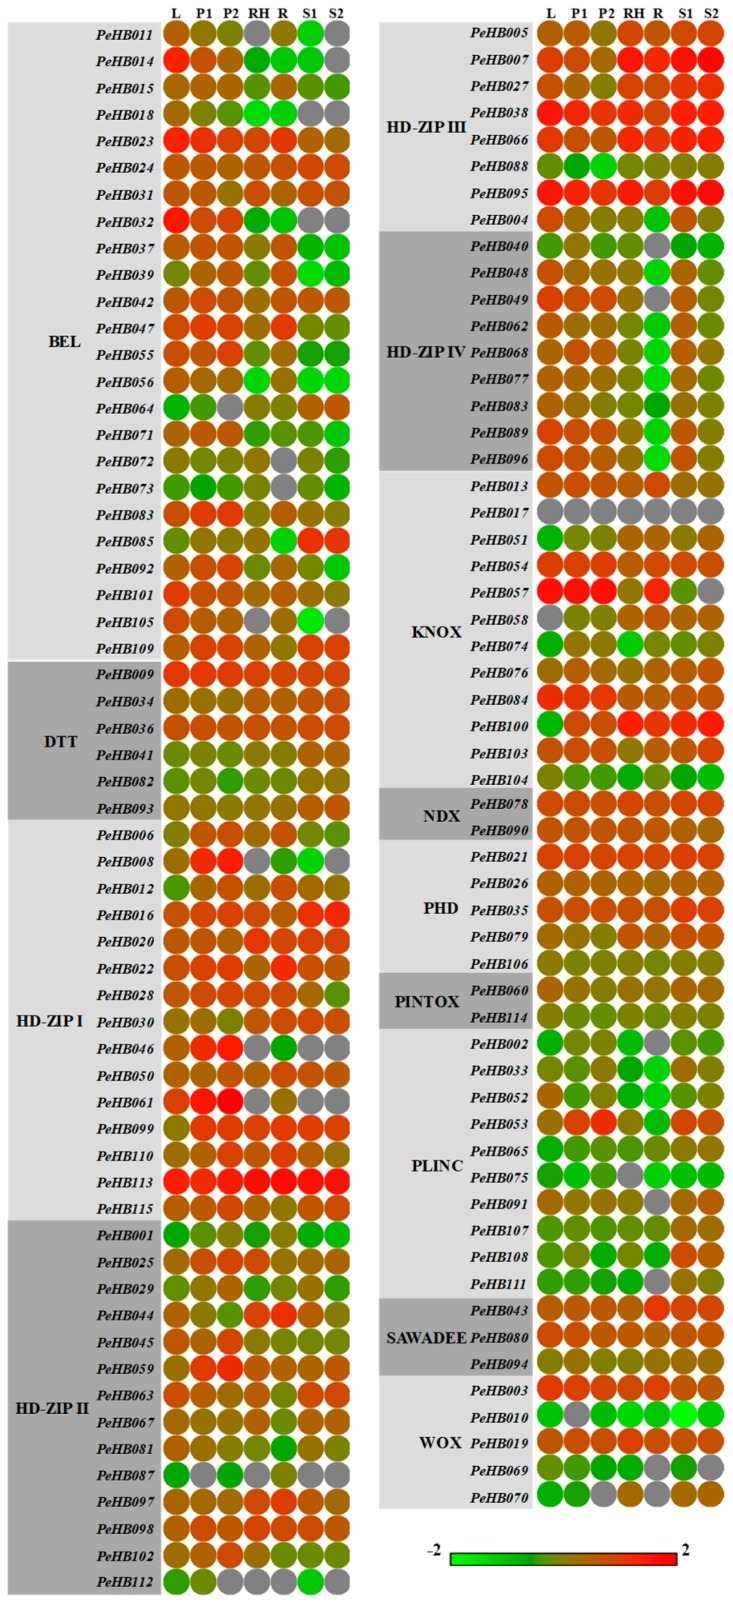
Figure 3.
Tissue-specific expression analysis of PeHBs in moso bamboo. Heatmap represented for the expression of 115 PeHBs in different tissues. The color scale at the bottom of the figure represents log2 expression values, with the color from blue to red indicating a low to high level of transcript abundance. L: leaves; P1: early panicles; P2: advanced panicles; R: roots; RH: rhizomes; S1: 20-cm shoots; S2: 50-cm shoots.

