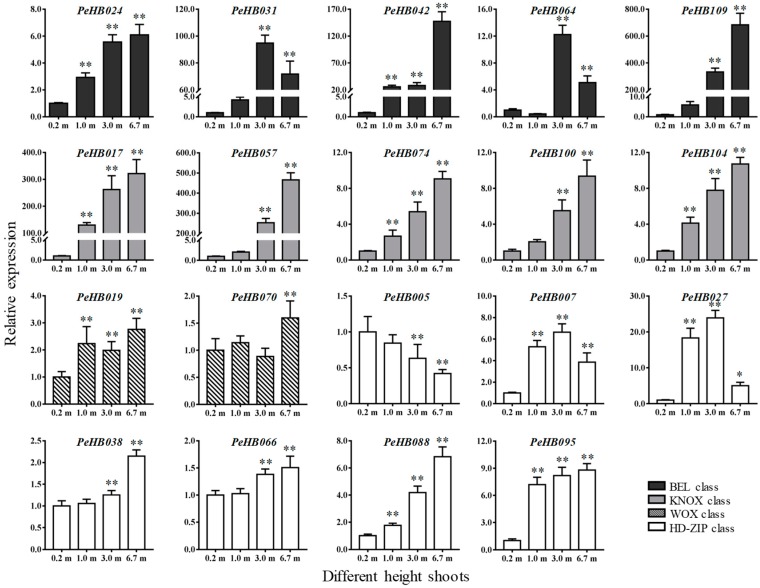
Figure 6.
Expression analysis of PeHBs in shoots with different heights. Average and error bars represent the standard deviation of three biological replicates. The y-axis and x-axis indicates relative expression levels and the different heights of the base shoots, respectively (* p < 0.05, ** p < 0.01).

