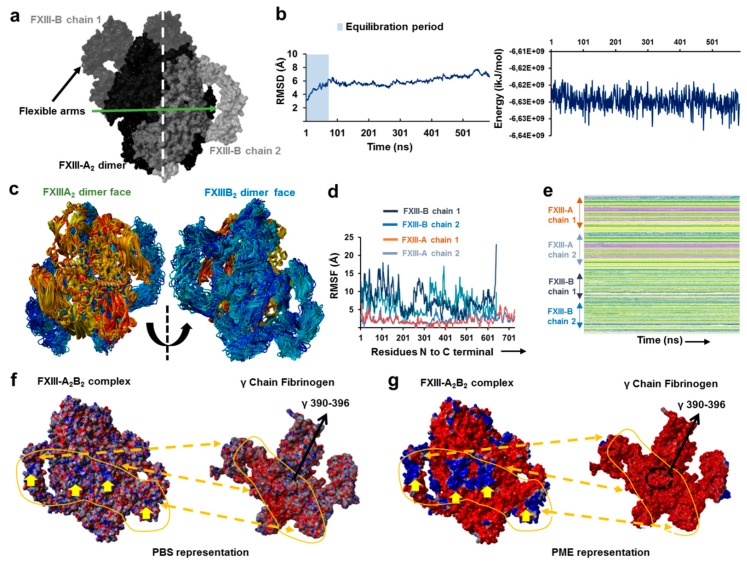
Figure 3.
The all-atom structure of the FXIII-A2B2 complex. (a) is the symmetrical representation of the best modeled all-atom structure of the FXIII-A2B2 complex. The structure has been depicted by its molecular surface in different shades of black and gray for the individual chains of FXIII-A and FXIII-B subunits. (b) shows the C-α backbone RMSD and the total energy graphs for the MD simulation conducted on the FXIII-A2B2 complex structure model. (c) are aligned simulation snapshots from the MD simulation conducted on FXIII-A2B2 complex structure represented with FXIII-A subunit face (left) and the FXIII-B subunit face (right). The snapshots of FXIII-A and FXIII-B subunits are depicted in ribbon format with colors ranging between yellow-red and cyan-blue for either subunit, respectively. (d) shows the graph representing RMSF for the FXIII-A2B2 complex structure MD simulation, with individual chains represented by different color as mentioned in the inset. (e) represents the secondary structure profile of individual chains of FXIII-A and FXIII-B subunits for the FXIII-A2B2 complex structure MD simulation. (f) is the PBS-based electrostatic surface representation of the FXIII-A2B2 complex structure (left) and γ chain of fibrinogen (right) taken from fibrinogen crystal structure (PDB ID: 3GHG). Red color indicates negative surface electrostatic potential, whereas blue represents positive potential. Indicated positive electrostatic patches on the FXIII-A2B2 complex structure are likely to interact with negatively charge bearing regions in and around the FXIII interaction site of fibrinogen γ chain (the specific residues are numbered and indicated with a black arrow). (g) is the same view as (f) but electrostatic surface representation has been done with the PME method. The prominent electrostatic patches on the FXIII-B subunit are marked with yellow arrows in (f,g). The complementary electrostatic regions between FXIII and fibrinogen γ chain have been marked with dotted arrows and continuous uneven lines covering the shape of the region in (f,g).

