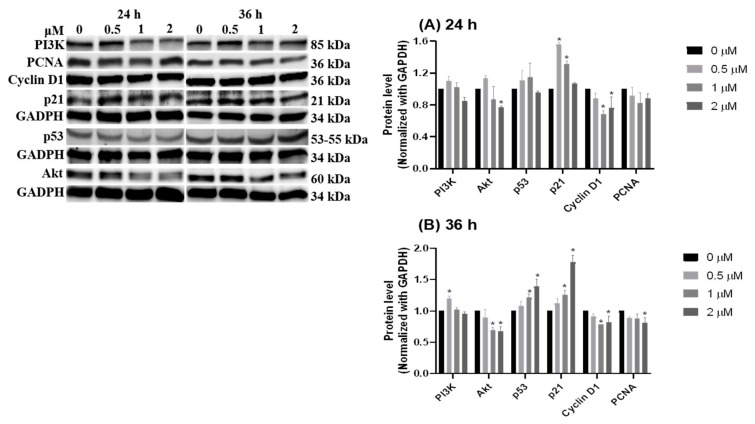
Figure 6.
Dynamics of cell growth related signaling pathway after HCD treatment. Caco-2 cells were treated with HCD and the changes in PI3K, Akt, p53, p21, cyclin D1, and PCNA were measured at (A) 24 h and (B) 36 h. The protein levels were represented as the ratio of GAPDH-normalized chemiluminometric intensity between the untreated control (0 μM) and treatment. Data (n = 3) were represented as mean ± SD. * p < 0.05 as compared with the untreated control (0 μM).

