

Abstract
Corticothalamic (CT) feedback plays an important role in regulating the sensory information that the cortex receives. Within the somatosensory cortex layer VI originates the feedback to the ventral posterior medial (VPM) nucleus of the thalamus, which in turn receives sensory information from the contralateral whiskers. We examined the physiology and morphology of CT neurons in rat somatosensory cortex, focusing on the physiological characteristics of the monosynaptic inputs that they receive from the thalamus. To identify CT neurons, rhodamine microspheres were injected into VPM and allowed to retrogradely transport to the soma of CT neurons. Thalamocortical slices were prepared at least 3 days post injection. Whole-cell recordings from labeled CT cells in layer VI demonstrated that they are regular spiking neurons and exhibit little spike frequency adaption. Two anatomical classes were identified based on their apical dendrites that either terminated by layer V (compact cells) or layer IV (elaborate cells). Thalamic inputs onto identified CT-VPM neurons demonstrated paired pulse depression over a wide frequency range (2–20 Hz). Stimulus trains also resulted in significant synaptic depression above 10 Hz. Our results suggest that thalamic inputs differentially impact CT-VPM neurons in layer VI. This characteristic may allow them to differentiate a wide range of stimulation frequencies which in turn further tune the feedback signals to the thalamus.
Keywords: Barrel cortex, layer VI, neuronal morphology
Introduction
It has long been recognized that the mammalian neocortex can be divided into six layers, each of which has distinct neuronal compositions that serve different roles in information processing. In the vibrissal system, sensory information about whisker deflections, movements, and positions reach the barrel cortex via two major thalamic pathways: the lemniscal inputs through the ventral posterior medial (VPM) nucleus of the thalamus and the paralemniscal inputs through the posteromedial (POm) nucleus of the thalamus (Lu and Lin 1993; Ahissar et al. 2000; Pierret et al. 2000; Yu et al. 2006). VPM inputs target neurons in layer IV barrels as well as those residing in layer VI (White 1978; Bernardo and Woolsey 1987). Layer VI is the most morphologically diverse layer within the neocortex (Chen et al. 2009), originating ipsilateral and contralateral neocortical connections (Sherk 1986; Zilles and Wree 1985; Zhang and Deschênes 1997) and giving rise to corticothalamic (CT) inputs back to the specific sensory thalamic nuclei such as VPM (Bourassa et al. 1995). In order to understand the ramifications of this morphological diversity and its role in information processing, it is important to characterize the intrinsic properties of specific cellular phenotypes.
Surprisingly within the thalamus, the number of CT synaptic inputs is far greater than the feedforward inputs from the brainstem (Guillery 1967; Montero 1991; Liu et al. 1995). Studies in the auditory, visual, and somatosensory systems have demonstrated that CT feedback projections play a pivotal role in altering transmission mode and the receptive field properties of thalamic relay neurons (Ergenzinger et al. 1988; Sillito and Jones 2002; Wörgötter et al. 2002; Temereanca and Simons 2004). CT projections also exert significant influence on both the spatial and angular tuning maps of the thalamic relay neurons (Temereanca and Simons 2004). Although prior research has focused on the role of CT cells in influencing sensory transmission, little is known about their intrinsic properties and the physiology of the synaptic input they receive from the thalamus.
In several neural circuits, homogeneities in neuronal morphology have been noted (Hübener and Bolz 1988; Hübener et al. 1990; Rumberger et al. 1998; Schubert et al. 2003; Hattox and Nelson 2007), similar findings have been suggested for CT neurons (Katz 1987; Thomson et al. 1993; Brumberg et al. 2003), and it is believed that these structural hallmarks may be adapted for the cell’s role in cortical processing. In the present paper, we focus on the intrinsic physiology and morphology of identified CT-VPM neurons located in layer VI of barrel cortex and investigate their relationship to the properties of the thalamic inputs they receive using retrograde labeling and whole-cell patch clamp recordings.
Materials and methods
Ethical approval
All experiments were performed in accordance with the Institutional Animal Care and Use Committee guidelines of Queens College, CUNY (protocol #100) and the National Institutes of Health (USA).
Injection of rhodamine microspheres
In order to label CT-VPM neurons for subsequent electrophysiological recordings postnatal day (PND) 10 rats were anesthetized with ketamine and xylazine (i.p. injection, 0.1 ml of 153 mg/kg/2.23 mg/kg solution). Following confirmation of sedation (non-responsiveness to a toe pinch), the animal was placed in a small animal stereotaxic apparatus (David Kopf, Tujunga, CA, USA) and the dorsal surface of the skull overlying the left VPM thalamus was exposed. A small craniotomy, centered 2 mm caudal to bregma and 2 mm lateral to midline, was made for access to VPM. A tungsten microelectrode (2–4 MΩ; Frederick Hare, Brunswick, ME, USA) connected to an amplifier (AM Systems, Sequim, WA) was inserted slowly into the brain while manually stimulating the contralateral whiskers. The appropriate location of VPM was found when robust responses to manual whisker deflection were recorded (at approximately 4 mm deep, relative to the pial surface). The electrode position was noted and then the tungsten electrode was replaced by a glass micropipette (3–5 MΩ resistance), containing rhodamine-labeled latex microspheres (Lumafluor). The glass micropipette was returned to approximately the same coordinates (x, y, z) as the tungsten microelectrode. A picospritzer (model IIe; Toohey Instruments, Fairfield, NJ) attached to the micropipette was used to deliver a train of pressurized N2 pulses (4–6 pulses, 20–25 psi, 8–15 ms in duration) to the micropipette which resulted in bead deposition in VPM (see Figure 1A). Slices from animals which had injections that did not deposit beads in VPM (as in Figure 1A) were not used for this study. The rats were allowed to recover for a minimum 3 days to ensure adequate retrograde transport to the cortex before initiating the in vitro experiments.
Figure 1.
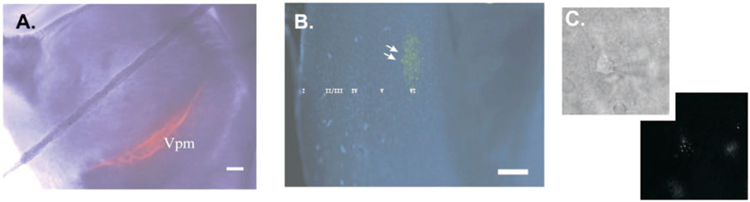
Bead labeling of corticothalamic neurons. Targeted injection of rhodamine microspheres into VPM stay confined to the nucleus (panel A left, scale bar=500 μm). Schematic of thalamic injection site (panel A right), LD=lateral dorsal nucleus, NRT=thalamic reticular nucleus, PO=posterior nucleus, VL=ventral lateral nucleus, VPL=ventral posterior lateral nucleus, ZI=zona inserta. After 2–3 days beads are retrogradely transported to the somata of CT cells in the upper half of layer VI in rat barrel cortex (panel B), laminae revealed using Hoechst nuclear staining, roman numerals indicate laminae (scale bar=50 μm). A bead-labeled CT neuron is targeted for whole-cell patch clamp recordings (panel C top), fluorescent illumination confirms retrograde labeling (panel C bottom).
Preparation of brain slices
For the initial characterization of the intrinsic properties of CT-VPM cells, coronal sections were utilized similar to what was done for CT-lateral geniculate nucleus (LGN) neurons using the same retrograde labeling technique (Katz 1987; Brumberg et al. 2003). For the studies characterizing thalamic inputs onto CT-VPM cells, thalamocortical slices that preserve in part VPM inputs into the barrel cortex were used. Brain slices were prepared in the same way for all developmental ages. Coronal slices (250 μm thick) were prepared using a vibratome (Leica VT1000s) and were prepared in the same manner as the thalamocortical slices described below, but just sectioned in a different plane. The procedure to make thalamocortical slices was the same as the one previously described by Agmon and Connors (1991). In brief, rats were anesthetized with an overdose of Euthasol (Virbac Animal Health, Fort Worth, TX, USA) and following their becoming non-responsive to noxious stimuli (toe pinch) were quickly decapitated. The brain was quickly removed and placed on a 55 degree ramp of an agar block. After the agar block was glued to the stage of the vibratome, the tissue was totally immersed in ice-cold oxygenated artificial cerebrospinal fluid (ACSF). ACSF contained (in mM): 125 NaCl, 2.5 KCl, 1 MgCl, 1.25 NaH2PO4, 2 CaCl2, 25 NaHCO3, and 25 d-glucose and was aerated with 95% O2/5% CO2 to a final pH of 7.4. Three or four slices of 375 mm thickness that exhibited uninterrupted fiber bundles traversing the corpus striatum upon visual inspection were then transferred into a chamber with ACSF at room temperature and allowed to recover for at least 1 h.
Electrophysiological recordings
Whole-cell recordings were obtained from the retrogradely labeled CT-VPM cells in layer VI of barrel cortex visualized with infrared differential interference contrast (IR-DIC) optics and epifluorescent illumination (Olympus BX51WI). Patch pipettes (5–10 MΩ) were pulled on a Flaming/Brown microelectrode puller (P-97; Sutter Instruments, Novato, CA, USA) to a final resistance of 3–6 MΩ. Recording pipettes were filled with (in mM): 120 KGlu, 10 NaCl, 20 KCl, 10 Hepes, 2 Mg-ATP, 0.3 Na-GTP, and 0.5 EGTA (at room temperature or 25 °C, its reversal potential ). To avoid high concentrations of intracellular Cl− we also used an intracellular recording solution which resulted in a more hyperpolarized (Beierlein and Connors 2002), which consisted of (in mM): 135 KGlu, 2 NaCl, 4 KCl, 10 Hepes, 4 Mg-ATP, 0.3 GTP-Tris, 0.2 EGTA, and 5–10 Phosphocreatine-Tris (at room temperature or 25 °C, ). In some experiments, pipettes also contained 0.3–1% biocytin (weight/volume) for subsequent reconstruction and analysis of morphology using Neurolucida (see below). Signals were acquired with a Multiclamp 700B amplifier and collected and analyzed with PClamp10 (Molecular Devices; Sunnyvale, CA). Only the recordings with resting membrane potentials more hyperpolarized relative to −50 mV and overshooting action potentials in response to brief depolarizing current pulses were kept for further experimentation. For intrinsic physiology property studies, families of hyperpolarizing and depolarizing current pulses (−0.25 to +0.25 nA with step of +0.05 nA, 500 ms duration) were injected to the cell under investigation. The peak amplitudes of responses to current steps and amplitude of late responses (25 ms before current offset) were measured and used to examine the current vs. voltage relationships and the presence/absence of ‘‘sag’’ currents in CT-VPM neurons. The action potential amplitude, action potential half width, rise time, and spike frequency adaptation were also characterized for each cell. For the synaptic studies, a concentric electrode (~1 MΩ; Frederick Hare) was initially placed in the center of VPM but the electrode could be moved within VPM in order to find a position which would generate a consistent excitatory postsynaptic potential (EPSP) in the CT-VPM cell being recorded from. Single pulses were used to evoke presumably monosynaptic postsynaptic potentials (PSPs) in CT-VPM neurons in layer VI of barrel cortex. For each identified connection a coefficient of variation analysis was performed on EPSP latencies (Berry and Pentreath 1976; Faber and Korn 1991), wherein CV (coefficient of variation)=σ/μ; where σ is the standard deviation of response latency (in ms) and μ is the mean response latency (in ms). Connections that had CVs ≤10% were assumed to be reflective of a monosynaptic connection and were used for subsequent comparisons (see Figure 6E, Table IV). In order to standardize stimulation between cells for both paired pulse and stimulus train studies (see below), the stimulation intensity was gradually increased until obvious PSPs (>1 mV) were consistently evoked with little to no failures (+200 μA to +1 mA). To examine more minimal responses we used previously published parameters (200 μs duration of pulse, 50–200 μA intensity adapted from Beierlein and Connors 2002). Response latencies were determined by calculating the duration (in ms) from when the stimulus was turned off, to allow for comparison between different duration pulses, until the point where a line drawn between the 20 and 80% amplitude of the EPSP intersected the baseline. To assess short-term synaptic dynamics, pairs of identical stimuli were applied where their interstimulus interval was varied, so-called paired pulse experiments. For the paired pulse experiments the magnitude was determined as described above and each pulse was 5 ms in duration and we systematically varied the interstimulus interval from 1 s (1 Hz) to 50 ms (20 Hz). Synaptic dynamics were further probed using trains of stimuli at the same intensity (8 pulses) over a wide dynamic range, 1–20 Hz. The latencies and amplitudes of the resultant PSPs were measured. EPSP amplitudes were measured as the peak response relative to the membrane potential just before the onset of the EPSP. Trains of 8 pulses were chosen as it has been shown via in vivo recordings in the barrel that steady-state responses are achieved after approximately eight whisker deflections especially at higher stimulation frequencies (Garabedian et al. 2003; Moore 2004; Heiss et al. 2008) and allows for comparisons to previously published results (Brumberg et al 2003). In order to probe for the existence of disynaptic inhibition, CT cells were hyperpolarized or depolarized to different membrane potentials away from the Cl− reversal potential using the reduced Cl− intracellular recording solution described above.
Figure 6.

Evoked monosynaptic EPSPs are evident in corticothalamic-VPM neurons. Minimal stimulation (50 μA, 200 μs pulse) results in either failures (panel A) or evoked EPSPs (panel B). Repetitive stimulation reveals the consistency of the latency of the response with panel C showing the overlay of consecutive stimulus presentations, where approximately 50% of stimulus presentations result in failures. Stimulation with same intensity (100 μA) but with different pulse durations resulted in the same EPSP latency (panel D). CT-VPM neurons showed little variance in their latency to thalamic stimulation (panel E), where EPSP latency variance is plotted for each cell, values <10% are thought to be reflective of a monosynaptic input. A CT-VPM neuron recorded with low intracellular Cl− (see Methods, panel F) at different holding potentials reveals prominent inhibition following the onset of a stimulus-evoked EPSP, dotted lines represent pre-stimulus membrane potential. Asterisks indicate stimulus artifact. The traces shown in panels A, B, C, D, and F are from the same cell, +100 μA current pulses of 200 μs duration were applied except where specified.
Table IV.
Covariance of EPSP latency analysis.
| Cell number | Mean latency (ms) | Std. dev. of latency (ms) | Covariance (SD/mean) (%) | Monosynaptic |
|---|---|---|---|---|
| 1 | 1.88 | 0.11 | 5.98 | Y |
| 2 | 3.01 | 0.29 | 9.75 | Y |
| 3 | 2.65 | 0.24 | 9.09 | Y |
| 4 | 1.90 | 0.18 | 9.29 | Y |
| 5 | 2.94 | 0.27 | 9.079 | Y |
| 6 | 3.10 | 0.17 | 5.55 | Y |
| 7 | 3.13 | 0.19 | 5.92 | Y |
| 8 | 1.17 | 0.10 | 8.90 | Y |
| 9 | 5.02 | 0.97 | 19.26 | N |
| 10 | 3.83 | 0.36 | 9.30 | Y |
| 11 | 3.81 | 0.29 | 7.57 | Y |
| 12 | 3.92 | 0.35 | 9.06 | Y |
| 13 | 1.17 | 0.11 | 9.02 | Y |
| 14 | 2.50 | 0.21 | 8.38 | Y |
| 15 | 5.42 | 0.76 | 14.05 | N |
| 16 | 1.96 | 0.11 | 5.84 | Y |
| 17 | 2.88 | 0.26 | 8.98 | Y |
| 18 | 3.98 | 0.33 | 8.27 | Y |
| 19 | 1.10 | 0.07 | 6.25 | Y |
| 20 | 2.90 | 0.10 | 3.30 | Y |
Y = Yes, N = No.
All data were filtered at 1 kHz and digitized at 10 kHz. Paired t-tests were used to determine the statistical significance of paired data. Power analyses (assuming α=0.5, B=0.8) suggest that sample sizes should contain at least eight cells; in all analyses here we exceeded this requirement. One-way ANOVAs were used to compare metrics between groups followed by post hoc Student t-tests. Statistical significance was achieved at an alpha value of p<0.05. All data are reported as mean ± standard error of the mean (SEM) unless noted.
Histology
Biocytin histochemistry was performed to reveal the morphology of recorded CT-VPM neurons. At the termination of a physiological recording, the slice was quickly placed in cold 4% paraformaldehyde in 0.1 M phosphate buffer (PB, pH 7.4). To develop the biocytin-filled cells, the slices were first placed in 1% H2O2/0.5% methanol in phosphate buffer solution (PBS) for 20 min to quench endogenous peroxidase activity. After washes in PBS, slices were permeabilized for 1 h in PBS containing 0.2% Triton-X 100 (Sigma, St Louis, MO, USA). Then slices were incubated in an ABC Kit (Vector Laboratories, Burlingame, CA, USA) overnight. Slices were then washed in PBS and placed in a solution containing 3,3′-diaminobenzadine and nickel aluminum sulfate (for intensification) dissolved in 0.1 M PB and then H2O2 was added dropwise to develop the reaction. Once staining was deemed adequate (by observing using a dissection microscope), the slices were washed in PBS and mounted onto gelatin-coated slides, dried overnight, and then dehydrated and delipidated before being coverslipped with Permount (ThermoFisher Scientific, Waltham, MA, USA).
Neurons were reconstructed with an Olympus BX 51 microscope equipped with Neurolucida 7.5 software (MBF Bioscience, Williston, VT, USA). Each cell was initially scanned under low magnification (20×, oil immersion, numerical aperture (NA)=0.8) verifying the depth of focus to ensure that all the labeled dendrites and axons were included and then reconstructed using a 60× (oil immersion, NA=1.4) objective. Somatic (size and shape) and dendritic (quantity, length) were quantified as well as the relative location of the soma within the cortical gray matter and the extent to which the apical dendrites projected towards the pial surface. We quantified soma size (area and perimeter) and aspect ratio (ratio of the longest measured axis of the cell divided by the longest axis perpendicular to the main axis). For the dendrites we considered apical and basilar dendrites independently and quantified their number, length, the number of branch points (nodes), and the number of endings (ends). These metrics have been used previously to classify neuronal phenotypes (Rumberger et al. 1998; Chen et al. 2009).
Results
Identification of corticothalamic projection (CT-VPM) neurons
Coronal or thalamocortical slices were examined using a water immersion 40× objective (0.8 NA) to identify rhodamine-labeled neurons which typically sequestered 3–5 beads within their soma. Bead injections targeted to the VPM appeared to stay within the VPM nucleus limiting non-specific labeling (Figure 1A). Allowing 3–4 days for adequate transport of the fluorescent beads revealed that the overwhelming majority of fluorescently labeled cells were seen at the upper half of layer VI (Figure 1B) consistent with previous reports of the position of CT neurons projecting to the primary sensory nuclei (Chmielowska et al. 1989; Bourassa et al. 1995; Killackey and Sherman 2003). Only the bead-labeled CT neurons (Figure 1C) residing in layer VI were used for further electrophysiological recordings.
Intrinsic physiological properties of CT-VPM neurons
Once stable recordings were obtained, we characterized the intrinsic passive and active physiological properties of CT-VPM neurons (see Table I). CT-VPM neurons had average resting membrane potentials of −74.76 ± 0.94 mV (corrected for liquid junction potentials). Families of hyperpolarizing current pulses of 500 ms duration were used to determine passive membrane properties. CT-VPM neurons demonstrated a relatively small depolarizing ‘‘sag’’ in their responses to hyperpolarizing current pulses. The average input resistance calculated at the peak response to pulses of −0.25 to +0.25 nA was 248.88 ± 10.17 MΩ, while that calculated from just before pulse offset (25 ms before the offset of the current step) had a significantly lower input resistance measured at 220.63 ± 9.20 MΩ (n=46, p<0.05). Current vs. voltage plots created from data of subthreshold current injections (Figure 2B) made either at the maximum voltage deviation (solid line in Figure 2B) or 25 ms before the end of the current pulse (dotted line in Figure 2B) both exhibited relationships wherein at more hyperpolarized potentials their steady-state responses showed slightly more deviation from linear or more ‘‘sag’’ which is typical of most cortical pyramidal neurons. It is possible that current injections greater than ±50 pA could activate active currents, so we recomputed the input resistance using pulses that did not exceed those values and did not find any difference in input resistance compared to our initial analysis (p>0.05); nor did we find any evidence of ‘‘sag’’ currents in this current regime. In response to depolarizing current pulses that exceeded the threshold it was found that CT-VPM neurons discharge ‘‘regular spikes’’ (Figure 2A). The action potential (AP) threshold was on average at −45.31 ± 0.56 mV and the AP height was 87.36 ± 0.86 mV. Similar to what has been observed in other recordings of pyramidal neurons in barrel cortex (Beierlein and Connors 2002; Hull et al. 2009), the AP half width at half height of layer VI neurons was relatively broad, 1.76 ± 0.04 ms; the AP had an average rise time of 0.44 ± 0.01 ms.
Table I.
Intrinsic physiological properties of CT-VPM neurons.
| Metric | Value |
|---|---|
| AP height (mV) | 87.36 ± 0.86 |
| AP half width (ms) | 1.76 ± 0.04 |
| AP threshold (mV) | −45.31 ± 0.56 |
| AP rising time (ms) | 0.44 ± 0.01 |
| RMP (mV) | −74.76 ± 0.94 |
| Peak input resistance (MΩ) | 248.88 ± 10.17 |
| Late input resistance (25 ms prior to pulse offset, MΩ) | 220.637 ± 9.20 |
N=46, AP=action potential, RMP=resting membrane potential, data represent means ± one standard error of the mean.
Figure 2.

Firing properties of corticothalamic-VPM neurons. A typical response of a CT neuron to current steps of ± 0.10 nA pulses lasting 500 ms reveals the regular spiking phenotype (panel A). Neurons displayed linear I–V curves at maximum deviation from rest (solid line) and at 25 ms before stimulus offset in the subthreshold voltage range (panel B, population means and one standard error of the mean are plotted).
Previous recordings from layer VI corticofugal neurons residing in mouse primary visual cortex (Brumberg et al. 2003) revealed little to no spike adaptation in response to sustained depolarization. To asses levels of adaptation in CT-VPM neurons we injected families of depolarizing pulses of 500 ms duration and measured the inter-spike interval as a function of the inter-spike interval number (Figure 3B). If a cell only discharged 10 spikes it was not used in the mean for the values for inter-spike intervals>9. The first inter-spike interval was always the shortest, but irrespective of the magnitude of stimulation there were no statistically significant differences in the duration of the inter-spike interval during the pulse duration, demonstrating that these cells posses minimal spike–frequency adaptation. Statistical analyses (Friedman Repeated Measures Analysis of Variance on Ranks) revealed that there were no significant differences between inter-spike intervals for any given stimulation strength (values of p>0.5). This result is similar to what was found for cortico-geniculate neurons (Brumberg et al. 2003) suggesting that this may be a general property of corticothalamic neurons that project to the sensory nuclei of the thalamus. The absence of spike frequency adaptation may allow these cells to have stronger postsynaptic influence since multiple action potentials invading the presynaptic terminal are more likely to lead to successful neurotransmitter release (Allen and Stevens 1994).
Figure 3.

Corticothalamic cells display little spike frequency adaptation. Panel A shows representative traces of neurons in response to 50, 100, and 250 pA current pulses lasting 500 ms. Panel B plots inter-spike interval (y-axis) vs. inter-spike interval number, regardless of the magnitude of the injected current the time between the action potentials is relatively constant. Each data point reflects responses from at least 10 neurons. Means and one standard error of the mean are plotted.
We also targeted a group of non-bead-labeled pyramidal neurons that presumably did not project to VPM for comparison (n=31). The resting membrane potential input resistance and spike threshold did not differ between the two groups. Similarly, active properties such as AP threshold, amplitude, rise and fall times of the action potential did not differ. The average number of spikes generated by a 300 pA depolarizing current was statistically greater for CT-VPM neurons (21.9 ± 1.3, n=27) than for non-bead-labeled neurons (15.2 ± 0.9, n=31). Spike frequency was not correlated with input resistance, which was not significantly different between the two neuronal groups. We then quantified the relative differences in the rates of spike frequency adaptation as has been done previously by using a ratio of the late to early inter-spike intervals (Gottlieb and Keller 1997). Since the number of spikes per neuron ranged from 8 to 72, a ratio of the eighth to the third inter-spike intervals of the neurons was used to compare early and late adaptations. Both the non-bead-labeled layer VI neurons and CT-VPM neurons had similar mean ratios of 1.35 ± 0.12 SEM and 1.38 ± 0.06 SEM, respectively. Similar to what was observed in the visual cortex (see Brumberg et al. 2003), CT neurons although very similar to neighboring layer VI pyramidal neurons are more excitable.
Intrinsic morphology of layer VI CT-VPM neurons
Following the completion of recording sessions the neurons were quickly transferred to ice-cold 4% paraformaldehyde in 0.1 M PB for subsequent morphological analysis (see Methods above). Visual inspection revealed that all CT-VPM neurons were pyramidal with cell bodies residing in the upper half of layer VI possessing apical dendrites directed towards the pial surface that mostly terminated by superficial layer IV (Figure 4), consistent with studies of CT neuron cells in the visual cortex of a variety of species (Tsumoto and Suda 1980; Katz 1987) as well as previous reports from barrel cortex (Zhang and Descheˆnes 1997, 1998). Further inspection revealed two morphological classes distinguishable based on the length or extension of their apical dendrites; we defined them as being either compact or elaborate (see Figures 4 and 5, Table II). The compact neurons (n=9) possessed short apical dendrites and all of their dendrites including basal dendrites are confined within layer VI, while the elaborate neurons (n=15) have longer apical dendrites extending to the layer IV barrel. Basal dendrites of elaborate cells were similar to the compact cells and were confined to layer VI (Figure 5). The observed morphology of compact neurons is unlikely an artifact of slicing, that is, the effect of apical dendrites being truncated during slice preparation, because those neurons were not located on the surfaces of slices and their apical dendrites tapered to a point which is largely inconsistent with slicing artifacts (see Figure 5). Additionally, neurons with similar morphological characteristics have been observed following in vitro recordings (Gottlieb and Keller 1997) and anatomical studies (Chen et al. 2009). Post hoc pairwise statistical comparisons between the compact and elaborate groups revealed no differences in their somatic variables (area, perimeter, shape) or number or length of basilar dendrites (see Table II). Additionally, we measured the width of apical dendrites at their origin at the soma and at 20 μm from the soma to see if the rate of taper was different between the two groups. On average the elaborate apical dendrites were significantly wider (p<0.05) at their origin (2.55 ± 0.28 μm) than the compact CT-VPM cells (1.99 ± 0.11 μm). At 20 mm from the base the two groups of elaborate neurons were still wider but not significantly so (elaborate 1.85 ± 0.10 μm, compact 1.45 ± 0.26 μm, p>0.05). We computed a rate of apical dendritic taper ((width at base – width at 20 μm)/20 μm) and did not see any differences (p>0.05). We reanalyzed the intrinsic physiological properties of the recorded neurons with respect to their morphological classes and saw no significant differences (t-tests, p<0.05) between the two groups except for AP half width (compact vs. elaborate 1.72 ± 0.11 vs. 1.8 ± 0.05, p<0.05, see Table III). The significance of such a difference in AP half width is not clear but may relate to their efficacy in releasing a neurotransmitter, which has been related to spike width in other systems (Yutao et al. 2010). The significance of the existence of two classes of CT-VPM neurons is unclear but similar dual CT systems have been noted in the visual system and have been shown to have different local connectivity (Usrey and Fitzpatrick 1996).
Figure 4.

Representative micrographs of corticothalamic-VPM neurons. Panel A shows a compact CT-VPM cell at low (left, scale bar=250 μm) and high magnification (right, scale bar=50 μm). Panel B is representative of our elaborate population with a cell body in layer VI and an apical dendrite extending towards more superficial layers (left, low magnification, scale bar=250 μm; right, high magnification, scale bar=50 μm). Arrows highlight CT-VPM cells in the low magnification images.
Figure 5.

Reconstruction of corticothalamic-VPM neurons. Panel A shows three representative compact cells and panel B displays three elaborate cells with their longer apical dendrites. Bars on right reflect extent of cortical laminae, scale bars = 50 μm.
Table II.
Morphological characterization of corticothalamic-VPM cells.
| Overall | Overall | Compact cells | Compact cells | Elaborate cells | Elaborate cells | p Valuea | |
|---|---|---|---|---|---|---|---|
| Metric | Mean | STDEV | Mean | STDEV | Mean | STDEV | |
| Perimeter (μm) | 53.53 | 7.21 | 55.28 | 7.89 | 52.37 | 7.23 | 0.28 |
| Area (μm2) | 160.83 | 35.50 | 164.37 | 34.47 | 158.48 | 39.24 | 0.41 |
| Aspect ratio | 1.65 | 0.28 | 1.61 | 0.36 | 1.67 | 0.24 | 0.37 |
| A-nodes | 10.705 | 6.48 | 3.50 | 2.65 | 15.50 | 1.52 | <0.01 |
| A-ends | 11.905 | 6.44 | 4.750 | 2.63 | 16.67 | 1.51 | <0.01 |
| A-length (μm) | 1835.49 | 1272.17 | 431.75 | 316.52 | 2771.32 | 475.13 | <0.01 |
| D-quantity | 6.40 | 1.90 | 6.25 | 1.89 | 6.50 | 2.07 | 0.43 |
| D-nodes | 9.30 | 3.56 | 11.00 | 4.320 | 8.17 | 2.79 | 0.12 |
| D-ends | 15.90 | 4.70 | 17.50 | 5.97 | 14.87 | 3.87 | 0.21 |
| D-length (μm) | 1209.22 | 416.59 | 1174.18 | 631.71 | 1232.58 | 267.04 | 0.42 |
Pairwise comparisons.
N=9 compact, N=15 elaborate.
STDEV=standard deviation, A=apical dendrites, D=basilar dendrites.
Bold text indicates statistically significant results.
Table III.
Physiological properties of elaborate vs. compact cells.
| Metric | Compact (n = 9) | Elaborate (n =15) | p Value |
|---|---|---|---|
| AP height (mV) | 87.03 ± 3.46 | 88.37 ± 1.71 | 0.32 |
| AP half width (ms) | 1.72 ± 0.11 | 1.81 ± 0.05 | <0.05 |
| AP threshold (mV) | −44.72 ± 1.18 | −43.97 ± 0.49 | 0.78 |
| AP rising time (ms) | 0.50 ± 0.04 | 0.49 ± 0.02 | 0.96 |
| RMP (mV) | −64.95 ± 0.99 | −66.67 ± 0.51 | 0.76 |
| Peak IR (MΩ) | 302.43±19.85 | 242.73±13.85 | 0.56 |
| Late IR (MΩ) | 267.8 ± 13.86 | 218.476 ± 13.83 | 0.61 |
| Total AP# | 41.336 ± 8.176 | 31.186 ± 1.32 | 0.19 |
AP=action potential, RMP=resting membrane potential, IR=input resistance.
Data represent means ± one standard error of the mean.
Bold text indicates statistically significant results.
Synaptic inputs onto CT-VPM neurons
To study the synaptic inputs onto CT-VPM neurons, thalamocortical slices, which maintain the synaptic connectivity between VPM and the barrel cortex, were prepared. Before stimulating the thalamus we also collected intrinsic measurements, as detailed above, and compared the metrics categorized in Table I between identified CT-VPM cells recorded from coronal (n=46) vs. thalamocortical (n=24) slices and found no significant differences (t-tests, p>0.05), suggesting we were recording from the same cell class in both types of slices. A concentric electrode was placed in VPM and moved as needed within VPM to search for the optimal position for electric stimulation (see Methods). The typical position for the stimulation electrode was in VPM, close to the fiber bundles containing the thalamocortical axons which exit VPM. Movement of the stimulating electrode away from this point led to the quick diminution of evoked responses, consistent with the specific topography of thalamocortical inputs. At such position, a 200 μs to 5 ms stimulation pulse with sufficient intensity (+50 μA to +1 μA) to evoke a PSP with amplitude larger than 1 mV was used in identified CT cells. In 20 of 27 neurons in our recordings, EPSPs were evoked in the cells by stimulating VPM (see Figure 6). The latencies of evoked EPSP were from 0.98 to 5.86 ms; with the average of 2.88 ± 0.22 ms a similar order of magnitude variance in conduction times has also been observed in vivo (Simons et al. 2007; Constantinople and Bruno 2013). Using a 200 μs duration pulse, the threshold for activation of an EPSP was +36.22 ± 5.88 μA. In comparison a set of non-CT cells (n=6) were also recorded from in response to VPM stimulation and their latency was similar to the CT cells (mean latency = 3.03 ± 0.27 ms, mean threshold = +36.67 ± 8.66 μA, t-tests p>0.05). We initially tested a variety stimulation pulses with stimulation intensities from 50 μA to 1 μA and durations from 200 μs to 5 ms. We found no difference in response amplitude or latency between the different stimulus durations (n=10 cells, one-way ANOVA p>0.5), but found responses that showed the least variance in latency or amplitude when we used a 5 ms stimulation and thus for some synaptic studies a 5 ms stimulation pulse was used. Additionally, there was no correlation between response latency and EPSP amplitude at threshold (r2=0.06). The EPSP latencies within any individual cell were consistent across stimulus presentations (Figure 6C) and different pulse durations (Figure 6D) which supports the suggestion that the evoked EPSPs were monosynaptic events. In fact 18 of 20 analyzed connections had CVs <10% and only those connections were used for further analyses (see Table IV, Figure 6E). There was a significant difference between the latencies of evoked EPSPs between compact and elaborate neurons (compact vs. elaborate: 2.52 ± 0.17 ms vs. 3.19 ± 0.23 ms, p<0.05). We hypothesize that the longer latencies observed for the elaborate group suggests that some proportion of their thalamic inputs are being received at more electronically distant sites, such as their apical dendrites which extend superficially to layer IV. Interestingly, only 56% (5 of 9) of compact neurons received VPM-evoked inputs whereas 80% (12 of 15) of elaborate neurons did perhaps due to their apical dendrites sampling the dense thalamic input into layer IV and three cells could not be reconstructed all of which received VPM inputs. Further analyses (see Table V) demonstrated that elaborate CT-VPM neurons had broader EPSPs and slower rise and decay times, all suggestive of either dual targeting of thalamic inputs onto both their basilar dendrites confined to layer VI and their apical dendrites which extended into layer IV and/or that their thalamic inputs are at more electrotonically remote locations. We recorded spontaneous EPSPs in CT cells which had a frequency of 3.20 ± 0.58 Hz and compared them to the stimulus-evoked EPSPs. The average rise time of stimulus-evoked EPSPs was 10.12 ± 0.34 ms, which is not significantly different from that of spontaneously recorded EPSPs (9.23 ± 0.48 ms; p=0.15, n=20). We did not determine the origin of the spontaneous EPSPs but due to their similar kinetics as the stimulus-evoked EPSPs and the paucity of local connections within layer VI (reviewed in Thomson 2010) it is possible that the spontaneous EPSPs originate from thalamocortical fibers.
Table V.
Physiological properties of thalamocortical inputs onto layer VI CT-VPM cells.
| Metric | Compact CT-VPM cells | Elaborate CT-VPM cells |
|---|---|---|
| Number of cells | 5 | 12 |
| EPSP amplitude (mV) | 5.79 ± 0.98 | 5.98 ± 0.87 |
| EPSP latency (ms) | 2.52 ± 0.17 | 3.19 ± 0.23* |
| EPSP half width (ms) | 38.96 ± 1.44 | 54.65 ± 1.51* |
| EPSP rising time (ms) | 7.91 ± 0.29 | 17.30 ± 1.18* |
| EPSP decay time (ms) | 67.90 ± 3.02 | 68.27 ± 2.30 |
p<0.05.
Data represent means ± one standard error of the mean.
Four to five identical stimulation traces were used for each cell, which were then used to compute the population means.
In those neurons where single pulse stimulation elicited an EPSP (see Figure 6), we used paired stimulation and stimulus trains (8 pulses) to assay for characteristics of the synaptic dynamics of thalamic inputs onto identified CT-VPM neurons (Figure 7). The magnitude of the stimulus pulse and the duration of the pulse were determined for each cell empirically by altering stimulus duration (200 μs–5 ms) and intensity (+50 μA to +1 mA) until an EPSP with amplitude larger than 1 mV was evoked in half of stimulation trials at the natural resting potential of the neuron under study. The stimulation frequency was then systematically varied from 1 to 20 Hz. Initially using a paired pulse paradigm we measured the peak amplitude of the stimulus-evoked EPSP to the first and second pulse and subsequently calculated the ratio of the second EPSP to the first EPSP (Figure 7D). Paired pulse stimulation revealed depression for all stimulation frequencies (EPSP ratio of second/first pulses for 1, 2, 4, 8, 10, 20 Hz in percent: 85.21 ± 9.07; 91.13 ± 10.65; 77.74 ± 7.90; 83.71 ± 9.88; 77.42 ± 8.16; 62.03 ± 4.89). There was a significant difference between the amplitude of the second and first EPSP only in response to stimulation at 20 Hz (p<0.05). For stimulus trains (Figure 7E) we computed the ratio of the amplitude of the eighth EPSP to the first. Initially, we separated out the elaborate (n=12) and compact (n=5) neurons but found no differences at any stimulation frequency (p>0.5) and thus grouped the neurons together for the subsequent analyses. At low frequencies there was evidence of synaptic depression; response means all fall beneath the 100% line (see Figure 7E) which results when the eighth EPSP is smaller than the first. Specifically at stimulation frequencies of 1, 2, 4, and 8 Hz (EPSP ratios of eighth/first pulses in percent: 96.48 ± 6.86; 94.16 ± 5.08; 92.10 ± 4.50; 76.65 ± 7.27 accordingly). As the frequency of the stimulation train was incremented the amount of synaptic depression increased. The EPSP amplitude significantly decreased at 10 Hz (EPSP ratio of eighth/first pulses: 61.02 ± 5.56, p<0.05) and 20 Hz (EPSP ratio of eighth/first pulses: 41.88 ± 3.20, p<0.05). Although our results were obtained at room temperature, the EPSPs recorded from identified layer VI CT-VPM neurons are similar to the reported inputs onto unidentified layer VI neurons (Beierlein and Connors 2002) recorded under more physiological temperatures following VPM stimulation. In sum, thalamic inputs onto CT-VPM neurons showed little evidence of facilitation and in general depressed at higher stimulation frequencies which is consistent with what has been observed in layer IV following VPM stimulation in vivo (Middleton et al. 2010) and in vitro (Agmon and Connors 1991) although there have been reports of mixed (facilitation–depression) responses by others (Viaene et al. 2011).
Figure 7.

Responses to trains of synaptic inputs reveal depressing synapses. Responses to single (panel A) stimulation of the thalamus vs. paired stimulation (panel B) reveal paired pulse depression. Trains of eight stimuli show depression with increased frequency of stimulation (panel C). All traces from the same cell, +1.0 mA current pulses of 5 ms duration were utilized which evoked an initial EPSP >1 mV. Paired pulse experiments revealed short-term synaptic depression (panel D), and trains of stimuli (8 pulses, panel E) also showed significant synaptic depression especially at higher stimulation frequencies. Means and one standard error of the mean are plotted (n = 15). Dotted line in panels E and F represent 100%.
Disynaptic inhibition in layer VI has been reported previously in response to VPM stimulation (e.g., Beierlein and Connors 2002), and we sought to examine its presence in identified CT-VPM neurons. We performed this analysis despite the fact that in vivo studies report that GABA antagonists have minimal impact on receptive field properties of layer VI neurons (Kyriazi et al. 1998). Given that neurons often rest close to the chloride reversal potential we were concerned that this may have masked stimulus-evoked disynaptic inhibition, thus we recorded from CT-VPM neurons and manipulated their membrane potential to unmask inhibitory postsynaptic potentials (IPSPs). Initially we did not observe any strong disynaptic inhibition in any of our recordings when moving the membrane potential from ~−85 to ~−50 mV (n = 5 of 5), but this was likely due to a relatively high concentration of Cl− in our recording solution (30 mM). Recordings were then conducted with an intracellular solution containing a significantly lower concentration of Cl− (6 mM, see Methods). Under the low Cl− conditions a prominent IPSP was observed especially at depolarized membrane potentials (n = 4 of 4, Figure 6F). This suggests that the stimulus-evoked IPSP is generated by a Cl− current such as via GABAA receptors (Martin 1987). The magnitude of the stimulus-evoked IPSP measured relative to the cells’ resting membrane potential was 0.48 ± 0.11 mV (n = 9) which is less than what has been reported for thalamic-evoked IPSPs in layer IV (Cruikshank et al. 2010).
To investigate this further we targeted suspected fast-spiking interneurons for analyses similar to those we used for CT-VPM neurons. Fast-spiking neurons were defined as those displaying a discharge of a non-adapting train of brief action potentials in response to a depolarizing current pulse (McCormick et al. 1985). We stimulated VPM in the same manner as was done in the experiments targeting CT-VPM neurons in order to evoke thalamocortical EPSPs. We found that 100% (6 of 6) fast-spiking interneurons received VPM inputs. However, none of these neurons elicited suprathreshold spikes in response to stimulation intensities that we utilized to study thalamic inputs onto CT-VPM neurons. When the stimulation intensity was incremented to approximately twice that used in our CT-VPM studies (~+3 mA), action potentials could be evoked in the fast-spiking cells and thus the weak disynaptic inhibition we observed is likely due to the low-intensity stimulation we employed.
Our results are consistent with the published literature from in vitro (Cruikshank et al. 2010) and in vivo (Kyriazi et al. 1998) studies which demonstrate that, compared to layer IV, in layer VI there is less disynaptic inhibition, and that GABAA antagonists have minimal impact on the receptive field properties of layer VI neurons. An alternative possibility is that the stimulus-induced IPSP is due to activation of GABAB receptors due its apparent reversal close to the presumed K+ reversal potential and its relatively long duration (Connors et al. 1988), although this is unlikely given the minimal impact of in vivo application of GABAB antagonists on thalamocortical responses (Kyriazi et al. 1996).
There is a possibility that our stimulation protocols were antidromically activating CT cells which could then synapse onto the CT cell we were recording from. A hallmark of CT axons is that the repeated stimulation of their axons at short intervals can result in the second evoked action potential having a shorter latency than the first, a property called supernormality (see Swadlow et al. 1980), a property that thalamocortical axons do not posses (Kelly et al. 2001; Beierlein and Connors 2002). To evaluate this possibility we measured the latency of the first EPSP and compared it to the second and found no differences (p>0.5, n=12 cells), thus no supernormal period was observed suggesting that we were largely stimulating thalamocortical axons.
Developmental impacts on intrinsic and synaptic properties
We next sought to determine if any of the physiological parameters we were measuring varied as a function of the age of the animal. To do so we computed Spearman Rho for different metrics as a function of developmental age. Interestingly (see Figure 8A, B), the passive properties of the membrane did not change over our 2-week experimental window (PND 13–28, p>0.5), whereas certain active properties related to the action potential did (see Figure 8C, D). Specifically, AP amplitude increased significantly at the end of the third postnatal week (~PND 18) and AP amplitude (Figure 8D) was correlated with postnatal age (Rho=0.797, p<0.001). Additionally, AP rise time significantly increased at about the same time (Figure 8D, Rho=−0.98, p<001), similar to what has been observed in unidentified neurons previously (McCormick and Prince 1987). Based on these results it is assumed that Na+ channel densities or kinetics are changing while K+ channels are not. Given the passive nature of EPSP propagation and the lack of changes in CT neurons’ passive properties, we conclude that there were no developmental changes in EPSP dynamics over our experimental window. This conclusion is consistent with previous findings that have suggested that thalamic inputs reach their mature state at approximately PND 14 in the layer IV barrel (Crair and Malenka 1995).
Figure 8.

Postnatal development of cell intrinsic properties. Resting membrane potential (A) and input resistance (B) did not change over the 2-week experimental window. In contrast, action potential amplitude increased (C) and action potential rise time decreased (D) over the same period. Data represents means and one standard error of the mean.
Discussion
In the present study, we examined the intrinsic physiological and morphological properties of CT-VPM neurons and the synaptic inputs from VPM onto CT-VPM cells in layer VI of barrel cortex. The intrinsic physiological properties and the nature of the thalamic inputs onto the CT-VPM neurons revealed a relatively homogeneous class of neurons, whereas the anatomical analysis revealed two classes of CT-VPM neurons based on differences in their apical dendrites. CT-VPM neurons discharged relatively non-adapting trains of regular spikes and had relatively broad action potentials. Thalamic inputs to CT-VPM neurons were well preserved and showed similar dynamics to what has been previously reported for layer IV, in that trains of synaptic inputs depressed as a function of stimulation frequency.
Corticothalamic neurons: two distinct classes
The intrinsic properties observed in CT-VPM neurons in the present study are virtually identical to those observed in CT-LGN cells in the mouse (Brumberg et al. 2003) as well as those previously reported for CT-medial geniculate nucleus (MGN) neurons (Llano and Sherman 2009). The confluence of these results suggests that CT neurons to the specific thalamic nuclei likely posses similar intrinsic properties which differentiate themselves from other neurons in layer VI (Brumberg et al. 2003; Mercer et al. 2005) and CT neurons in layer V (Llano and Sherman 2009). There are two hallmarks of CT neurons that appear to distinguish them from most other neocortical pyramidal neurons. First, they discharge non-adapting trains of action potentials in response to depolarizing current pulses, whereas other pyramidal neurons in layer VI typically fire trains of adapting action potentials (McCormick et al. 1985; Brumberg et al. 2003; Ramos et al. 2008). In addition, they have relatively broad action potentials and do not discharge rebound bursts (van Brederode and Snyder 1992). These characteristics may work synergistically to ensure efficient release of neurotransmitter at their postsynaptic targets within the thalamus and allow these inputs—which tend to target the distal dendritic segments of thalamocortical relay cells (Van Horn et al. 2000)—to have a strong influence on the state of the thalamic neurons (Blumenfeld and McCormick 2000) and thus their ability to transfer information from the sensory periphery to the neocortex (Sherman and Guillery 2002; Lam and Sherman 2010). Alternatively, CT neurons may have relatively weak impact on their postsynaptic targets: if the broad action potential is efficient at releasing neurotransmitter pre-synaptically and their spike trains show little adaptation this may result in strong postsynaptic adaptation (Thomson 2000), which is consistent with the role of CT neurons as modulators of thalamic activity (Sherman and Guillery 2002).
One surprising finding was the existence of two classes of morphologically distinct CT cells (elaborate vs. compact). Multiple classes of layer VI pyramidal cells have been identified, irrespective of their role in cortical circuits in rodents (Chen et al. 2009) and primates (Briggs and Callaway 2001). These neurons are unlikely to project to the claustrum, another target of layer VI, as cortico-claustal neurons have apical dendrites that typically reach the pial surface (Katz 1987), a morphological feature not observed in our data set. Previously, it has been shown that multiple classes of CT cells can be identified physiologically based on axonal conduction velocities (Harvey 1980; Tsumoto and Suda 1980; Swadlow and Weyand 1981, 1987; Kwegyir-Afful and Simons 2009) and these have been correlated with distinct morphological phenotypes (Landry and Dykes 1985). Furthermore, in the Tree Shrew visual cortex there are distinct CT systems that receive different streams of thalamic input and project in a columnar fashion to different laminae (Usrey and Fitzpatrick 1996). Given that the two classes of CT cells receive similar thalamic input (present findings) it is likely that due to the difference in their dendritic tree they receive different patterns of synaptic inputs, an arrangement observed also in the primate visual cortex (Briggs and Callaway 2001). However, the compact cells do bear a resemblance to layer VI cortico-cortical cells that have been observed in the barrel cortex (see Oberlaender et al. 2011), suggesting perhaps there is a subset of cortico-cortical neurons which send axon collaterals to the thalamus as they were retrogradely labeled following VPM bead injections although this is unlikely (Petrof et al. 2012). How these two cell types integrate extrinsic (e.g., thalamic) vs. intrinsic (local) inputs may allow for different cortical computations to be processed in parallel.
Thalamic inputs onto corticothalamic neurons
Presumed monosynaptic EPSPs were commonly elicited in our sample population; 74% (20 of 27) of tested CT-VPM cells received direct thalamic input, confirming that a significant number of thalamocortical inputs into layer VI are preserved in our slice preparation. CT-VPM neurons not receiving thalamic input might have been innervated by thalamic axons that were severed during the preparation of the brain slices. It is unlikely that the inputs were due to recurrent antidromic activation of CT cells since CT cells have thinner unmyelinated axons which require higher intensity stimulation currents to be activated (Jones and Powell 1969; Swadlow 1989). In visual (Brumberg et al. 2003) and auditory cortices (Rose and Metherate 2001) it has been estimated that only a small percentage of CT cells are activated antidromically following thalamic stimulation similar to that used in the present study. Consistent with these findings we did not observe any antidromically evoked action potentials in any of our recordings. Furthermore, synaptic inputs from CT neurons in the thalamus (von Krosigk et al. 1999) and cortex (Beierlein and Connors 2002; West et al. 2006) have been shown to facilitate, which is the opposite of what is observed of thalamocortical inputs into layer VI in the present study and on to layer IV neurons in previous work (Lee and Sherman 2008). Additionally, in the present study all EPSPs occurred <6 ms after stimulation offset and had an average latency of 2.8 ms, less than the time previously shown to be necessary for an antidromic spike from a CT cell (6 ms) plus the synaptic conduction time (1 ms) to result in a postsynaptic response in another locally connected CT cell (Tan et al. 2008). Although the average latency of thalamic-evoked EPSPs reported in the present study was slightly higher than what has been reported previously (Beierlein and Connors 2002), the difference is likely due to the different temperature at which the recordings were carried out, ours at room temperature (approximately 25 °C) in contrast to 32 °C in other experiments (Dobrunz and Stevens 1999; Volgushev et al. 2004; Ali et al. 2007). We also found evidence of disynaptic inhibition onto CT cells following thalamic stimulation, which is consistent with the knowledge that interneurons in the cortex also receive excitatory thalamic inputs from thalamus (Keller and White 1987; Cruikshank et al. 2010).
A common finding in somatosensory cortex is that layer VI neurons in general (Brumberg et al. 1999) and CT cells specifically (Swadlow 1994; Kwegyir-Afful and Simons 2009) do not respond to sensory stimuli that excite neurons in other cortical laminae. The intrinsic properties of CT neurons do not explain this finding, given that CT neurons respond robustly to depolarizing current pulses and are actually more excitable than neighboring non-CT pyramidal neurons (Brumberg et al. 2003). These findings suggest a synaptic mechanism for the lack of in vivo responsiveness to the presentation of conventional stimuli. Consistent with this hypothesis is the finding that juxtacellular depolarization of CT cells unmasks suprathreshold receptive fields in these neurons (Kwegyir-Afful and Simons 2009). These receptive fields are likely driven by direct thalamocortical input which is normally depressing and thus not sufficient to evoke spiking responses under normal anesthetized conditions. CT neurons of behaviorally engaged animals are also not very responsive (Sirota et al. 2005). In contrast to layer IV where there are dense recurrent excitatory connections (White 1989), which serve to enhance the thalamic input (Pinto et al. 2003), layer VI cells show relatively sparse interconnectivity (Mercer et al. 2005; Hooks et al. 2011). Further, glutamate uncaging studies reveal few local inputs within layer VI (Briggs and Callaway 2001) and thus the mechanisms of amplification in layer IV are likely not engaged in layer VI. However, recent studies suggest that activation of homotopic motor cortex can induce CT cells to fire action potentials in response to peripheral stimuli (Lee et al. 2008). Taken together, these data suggest that CT neurons fire only when specific pre-conditions (e.g., coincident thalamic and M1 input) are met which, when combined with their intrinsic firing (non-adapting spike trains) and synaptic (facilitating synapses in the thalamus) properties, guarantees a strong postsynaptic effect. This will, in turn, play a key role in determining the nature of the information that gets passed from the sensory periphery through the thalamus to the cortex (Guillery and Sherman 2002).
Acknowledgements
We thank Drs Michael Beierlein and Daniel J. Simons for comments on the manuscript. This work was supported by the National Institute of Neurological Disease and Stroke at the National Institutes of Health NS058758 to J.C.B.
Appendix: abbreviations
- AP
action potential
- CV
coefficient of variation
- CT
corticothalamic
- EPSP
excitatory postsynaptic potential
- IPSP
inhibitory postsynaptic potential
- POm
posteromedial nucleus of the thalamus
- P
postsynaptic day
- PB
phosphate buffer
- PSPs
postsynaptic potentials
- VPM
ventral posterior medial nucleus of the thalamus
Footnotes
Declaration of interest
The mention of commercial products, their sources, or their use in connection with material reported herein is not to be construed as either an actual or implied endorsement of such products by the Department of Health and Human Services. The authors have no further disclosures.
References
- Agmon A, Connors BW. 1991. Thalamocortical responses of mouse somatosensory (barrel) cortex in vitro. Neuroscience 41:365–379. [DOI] [PubMed] [Google Scholar]
- Ahissar E, Sosnik R, Haidarliu S. 2000. Transformation from temporal to rate coding in a somatosensory thalamocortical pathway. Nature 406: 302–306. [DOI] [PubMed] [Google Scholar]
- Ali AB, Bannister AP, Thomson AM. 2007. Robust correlations between action potential duration and the properties of synaptic connections in layer 4 interneurones in neocortical slices from juvenile rats and adult rat and cat. J Physiol 580:149–169. [DOI] [PMC free article] [PubMed] [Google Scholar]
- Allen C, Stevens CF. 1994. An evaluation of causes for unreliability of synaptic transmission. Proc Natl Acad Sci USA 91:10380–10383. [DOI] [PMC free article] [PubMed] [Google Scholar]
- Beierlein M, Connors BW. 2002. Short-term dynamics of thalamocortical and intracortical synapses onto layer 6 neurons in neocortex. J Neurophysiol 88:1924–1932. [DOI] [PubMed] [Google Scholar]
- Bernardo KL, Woolsey TA. 1987. Axonal trajectories between mouse somatosensory thalamus and cortex. J Comp Neurol 258:542–564. [DOI] [PubMed] [Google Scholar]
- Berry MS, Pentreath VW. 1976. Criteria for distinguishing between monosynaptic and polysynaptic transmission. Brain Res 105:1–20. [DOI] [PubMed] [Google Scholar]
- Blumenfeld H, McCormick DA. 2000. Corticothalamic inputs control the pattern of activity generated in thalamocortical networks. J Neurosci 20:5153–5162. [DOI] [PMC free article] [PubMed] [Google Scholar]
- Bourassa J, Pinault D, Deschênes M. 1995. Corticothalamic projections from the cortical barrel field to the somatosensory thalamus in rats: A single-fibre study using biocytin as an anterograde tracer. Eur J Neurosci 7:19–30. [DOI] [PubMed] [Google Scholar]
- Briggs F, Callaway EM. 2001. Layer-specific input to distinct cell types in layer 6 of monkey primary visual cortex. J Neurosci 21: 3600–3608. [DOI] [PMC free article] [PubMed] [Google Scholar]
- Brumberg JC, Hamzei-Sichani F, Yuste R. 2003. Morphological and physiological characterization of layer VI corticofugal neurons of mouse primary visual cortex. J Neurophysiol 89:2854–2867. [DOI] [PubMed] [Google Scholar]
- Brumberg JC, Pinto DJ, Simons DJ. 1999. Cortical columnar processing in the rat whisker-to-barrel system. J Neurophysiol 82:1808–17. [DOI] [PubMed] [Google Scholar]
- Chen CC, Abrams S, Pinhas A, Brumberg JC. 2009. Morphological heterogeneity of layer VI neurons in mouse barrel cortex. J Comp Neurol 512:726–746. [DOI] [PMC free article] [PubMed] [Google Scholar]
- Chmielowska J, Carvell GE, Simons DJ. 1989. Spatial organization of thalamocortical and corticothalamic projection systems in the rat SmI barrel cortex. J Comp Neurol 285:325–338. [DOI] [PubMed] [Google Scholar]
- Connors BW, Malenka RC, Silva LR. 1988. Two inhibitory postsynaptic potentials, and GABAA and GABAB receptor-mediated responses in neocortex of rat and cat. J Physiol 406:443–468. [DOI] [PMC free article] [PubMed] [Google Scholar]
- Constantinople CM, Bruno RM. 2013. Deep cortical layers are activated directly by thalamus. Science 340:1591–1594. [DOI] [PMC free article] [PubMed] [Google Scholar]
- Crair MC, Malenka RC. 1995. A critical period for long-term potentiation at thalamocortical synapses. Nature 375(6529):325–328. [DOI] [PubMed] [Google Scholar]
- Cruikshank SJ, Urabe H, Nurmikko AV, Connors BW. 2010. Pathway-specific feedforward circuits between thalamus and neocortex revealed by selective optical stimulation of axons. Neuron 65: 230–245. [DOI] [PMC free article] [PubMed] [Google Scholar]
- Dobrunz LE, Stevens CF. 1999. Response of hippocampal synapses to natural stimulation patterns. Neuron 22:157–166. [DOI] [PubMed] [Google Scholar]
- Ergenzinger ER, Glasier MM, Hahm JO, Pons TP. 1988. Cortically induced thalamic plasticity in the primate somatosensory system. Nat Neurosci 1:226–229. [DOI] [PubMed] [Google Scholar]
- Faber DS, Korn H. 1991. Applicability of the coefficient of variation method for analyzing synaptic plasticity. Biophys J 60:1288–1294. [DOI] [PMC free article] [PubMed] [Google Scholar]
- Garabedian CE, Jones SR, Merzenich MM, Dale A, Moore CI. 2003. Band-pass response properties of rat SI neurons. J Neurophysiol 90: 1379–1391. [DOI] [PubMed] [Google Scholar]
- Gottlieb JP, Keller A. 1997. Intrinsic circuitry and physiological properties of pyramidal neurons in rat barrel cortex. Exp Brain Res 115:47–60. [DOI] [PubMed] [Google Scholar]
- Guillery RW. 1967. Patterns of fiber degeneration in the dorsal lateral geniculate nucleus of the cat following lesions in the visual cortex. J Comp Neurol 130:197–221. [DOI] [PubMed] [Google Scholar]
- Guillery RW, Sherman SM. 2002. Thalamic relay function and their role in corticocortical communication: Generalizations from the visual system. Neuron 33:163–175. [DOI] [PubMed] [Google Scholar]
- Harvey AR. 1980. A physiological analysis of subcortical and commissural projections of areas 17 and 18 of the cat. J Physiol 302:507–534. [DOI] [PMC free article] [PubMed] [Google Scholar]
- Hattox AM, Nelson SB. 2007. Layer V neurons in mouse cortex projecting to different targets have distinct physiological properties. J Neurophysiol 98:3330–3340. [DOI] [PubMed] [Google Scholar]
- Heiss JE, Katz Y, Ganmor E, Lampl I. 2008. Shift in the balance between excitation and inhibition during sensory adaptation of S1 neurons. J Neurosci 28:13320–13330. [DOI] [PMC free article] [PubMed] [Google Scholar]
- Hooks BM, Hires SA, Zhang YX, Huber D, Petreanu L, Svoboda K, Shepherd GM. 2011. Laminar analysis of excitatory local circuits in vibrissal motor and sensory cortical areas. PLoS Biol 9:e1000572. [DOI] [PMC free article] [PubMed] [Google Scholar]
- Hübener M, Bolz J. 1988. Morphology of identified projection neurons in layer 5 of rat visual cortex. Neurosci Lett 94:76–81. [DOI] [PubMed] [Google Scholar]
- Hübener M, Schwarz C, Bolz J. 1990. Morphological types of projection neurons in layer 5 of cat visual cortex. J Comp Neurol 301:655–674. [DOI] [PubMed] [Google Scholar]
- Hull C, Isaacson JS, Scanziani M. 2009. Postsynaptic mechanisms govern the differential excitation of cortical neurons by thalamic inputs. J Neurosci 29:9127–9136. [DOI] [PMC free article] [PubMed] [Google Scholar]
- Jones EG, Powell TP. 1969. An electron microscopic study of the mode of termination of cortico-thalamic fibers within the sensory relay nuclei of the thalamus. Proc R Soc Lond B Biol Sci 172:173–185. [DOI] [PubMed] [Google Scholar]
- Katz LC. 1987. Local circuitry of identified projection neurons in cat visual cortex brain slices. J Neurosci 7:1223–1249. [DOI] [PMC free article] [PubMed] [Google Scholar]
- Keller A, White EL. 1987. Synaptic organization of GABAergic neurons in the mouse SmI cortex. J Comp Neurol 262:1–12. [DOI] [PubMed] [Google Scholar]
- Kelly MK, Carvell GE, Hartings JA, Simons DJ. 2001. Axonal conduction properties of antidromically identified neurons in rat barrel cortex. Somatosens Mot Res 18:202–221. [DOI] [PubMed] [Google Scholar]
- Killackey HP, Sherman SM. 2003. Corticothalamic projections from the rat primary somatosensory cortex. J Neurosci 23:7381–7384. [DOI] [PMC free article] [PubMed] [Google Scholar]
- Kwegyir-Afful EE, Simons DJ. 2009. Subthreshold receptive field properties distinguish different classes of corticothalamic neurons in the somatosensory system. J Neurosci 29:964–972. [DOI] [PMC free article] [PubMed] [Google Scholar]
- Kyriazi HT, Carvell GE, Brumberg JC, Simons DJ. 1996. Effects of baclofen and phaclofen on receptive field properties of rat whisker barrel neurons. Brain Res 712:325–328. [DOI] [PubMed] [Google Scholar]
- Kyriazi H, Carvell GE, Brumberg JC, Simons DJ. 1998. Laminar differences in bicuculline methiodide’s effects on cortical neurons in the rat whisker/barrel system. Somatosens Mot Res 15:146–156. [DOI] [PubMed] [Google Scholar]
- Lam YW, Sherman SM. 2010. Functional organization of the somatosensory cortical layer 6 feedback to the thalamus. Cereb Cortex 20: 13–24. [DOI] [PMC free article] [PubMed] [Google Scholar]
- Landry P, Dykes RW. 1985. Identification of two populations of corticothalamic neurons in cat primary somatosensory cortex. Exp Brain Res 60:289–298. [DOI] [PubMed] [Google Scholar]
- Lee CC, Sherman SM. 2008. Synaptic properties of thalamic and intracortical inputs to layer 4 of the first- and higher-order cortical areas in the auditory and somatosensory systems. J Neurophysiol 100: 317–326. [DOI] [PMC free article] [PubMed] [Google Scholar]
- Lee S, Carvell GE, Simons DJ. 2008. Motor modulation of afferent somatosensory circuits. Nat Neurosci 11:1430–1438. [DOI] [PMC free article] [PubMed] [Google Scholar]
- Liu XB, Honda CN, Jones EG. 1995. Distribution of four types of synapse on physiologically identified relay neurons in the ventral posterior thalamic nucleus of the cat. J Comp Neurol 352:69–91. [DOI] [PubMed] [Google Scholar]
- Llano DA, Sherman SM. 2009. Differences in intrinsic properties and local network connectivity of identified layer 5 and layer 6 adult mouse auditory corticothalamic neurons support a dual corticothalamic projection hypothesis. Cereb Cortex 19:2810–2826. [DOI] [PMC free article] [PubMed] [Google Scholar]
- Lu SM, Lin RC. 1993. Thalamic afferents of the rat barrel cortex: A light- and electron-microscopic study using Phaseolus vulgaris leucoagglutinin as an anterograde tracer. Somatosens Mot Res 10: 1–16. [DOI] [PubMed] [Google Scholar]
- Martin IL. 1987. The benzodiazepines and their receptors: 25 years of progress. Neuropharmacology 26:957–970. [DOI] [PubMed] [Google Scholar]
- McCormick DA, Prince DA. 1987. Post-natal development of electrophysiological properties of rat cerebral cortical pyramidal neurones. J Physiol 393:743–62. [DOI] [PMC free article] [PubMed] [Google Scholar]
- McCormick DA, Connors BW, Lighthall JW, Prince DA. 1985. Comparative electrophysiology of pyramidal and sparsely spiny stellate neurons of the neocortex. J Neurophysiol 54:782–806. [DOI] [PubMed] [Google Scholar]
- Mercer A, West DC, Morris OT, Kirchhecker S, Kerkhoff JE, Thomson AM. 2005. Excitatory connections made by presynaptic corticocortical pyramidal cells in layer 6 of the neocortex. Cereb Cortex 15: 1485–1496. [DOI] [PubMed] [Google Scholar]
- Middleton JW, Kinnischtzke A, Simons DJ. 2010. Effects of thalamic high-frequency electrical stimulation on whisker-evoked cortical adaptation. Exp Brain Res 200:239–250. [DOI] [PMC free article] [PubMed] [Google Scholar]
- Montero VM. 1991. A quantitative study of synaptic contacts on interneurons and relay cells of the cat lateral geniculate nucleus. Exp Brain Res 86:257–270. [DOI] [PubMed] [Google Scholar]
- Moore CI. 2004. Frequency-dependent processing in the vibrissa sensory system. J Neurophysiol 91:2390–2399. [DOI] [PubMed] [Google Scholar]
- Oberlaender M, de Kock CP, Bruno RM, Ramirez A, Meyer HS, Dercksen VJ, Helmstaedter M, Sakmann B. 2011. Cell type-specific three-dimensional structure of thalamocortical circuits in a column of rat vibrissal cortex. Cereb Cortex. Epub ahead of print, PMID: 22089425. [DOI] [PMC free article] [PubMed]
- Petrof I, Viaene AN, Sherman SM. 2012. Two populations of corticothalamic and interareal corticocortical cells in the subgranular layers of the mouse primary sensory cortices. J Comp Neurol 520: 1678–1686. [DOI] [PMC free article] [PubMed] [Google Scholar]
- Pierret T, Lavallee P, Deschênes M. 2000. Parallel streams for the relay of vibrissal information through thalamic barreloids. J Neurosci 20: 7455–7462. [DOI] [PMC free article] [PubMed] [Google Scholar]
- Pinto DJ, Hartings JA, Brumberg JC, Simons DJ. 2003. Cortical damping: Analysis of thalamocortical response transformations in rodent barrel cortex. Cereb Cortex 13:33–44. [DOI] [PubMed] [Google Scholar]
- Ramos RL, Tam DM, Brumberg JC. 2008. Physiology and morphology of callosal projection neurons in mouse. Neuroscience 153: 654–663. [DOI] [PMC free article] [PubMed] [Google Scholar]
- Rose HJ, Metherate R. 2001. Thalamic stimulation largely elicits orthodromic, rather than antidromic, cortical activation in an auditory thalamocortical slice. Neuroscience 106:331–340. [DOI] [PubMed] [Google Scholar]
- Rumberger A, Schmidt M, Lohmann H, Hoffmann KP. 1998. Correlation of electrophysiology, morphology, and functions in corticotectal and corticopretectal projection neurons in rat visual cortex. Exp Brain Res 119:375–390. [DOI] [PubMed] [Google Scholar]
- Schubert D, Kötter R, Zilles K, Luhmann HJ, Staiger JF. 2003. Cell type-specific circuits of cortical layer IV spiny neurons. J Neurosci 23: 2961–2970. [DOI] [PMC free article] [PubMed] [Google Scholar]
- Sherk H 1986. The claustrum and the cerebral cortex In: Jones EG, Peters A, editors. Cerebral cortex. Vol. 5 New York: Plenum; pp 467–499. [Google Scholar]
- Sherman SM, Guillery RW. 2002. The role of the thalamus in the flow of information to the cortex. Philos Trans R Soc Lond B Biol Sci 357: 1695–1708. [DOI] [PMC free article] [PubMed] [Google Scholar]
- Sillito AM, Jones HE. 2002. Corticothalamic interactions in the transfer of visual information. Philos Trans R Soc Lond B Biol Sci 357: 1739–1752. [DOI] [PMC free article] [PubMed] [Google Scholar]
- Simons DJ, Carvell GE, Kyriazi HT, Bruno RM. 2007. Thalamocortical conduction times and stimulus-evoked responses in the rat whisker-to-barrel system. J Neurophysiol 98:2842–2847. [DOI] [PubMed] [Google Scholar]
- Sirota MG, Swadlow HA, Beloozerova IN. 2005. Three channels of corticothalamic communication during locomotion. J Neurosci 25: 5915–5925. [DOI] [PMC free article] [PubMed] [Google Scholar]
- Swadlow HA, Kocsis JD, Waxman SG. 1980. Modulation of impulse conduction along the axonal tree. Annu Rev Biophys Bioeng 9: 143–179. [DOI] [PubMed] [Google Scholar]
- Swadlow HA, Weyand TG. 1981. Efferent systems of the rabbit visual cortex: Laminar distribution of the cells of origin, axonal conduction velocities, and identification of axonal branches. J Comp Neurol 203: 799–822. [DOI] [PubMed] [Google Scholar]
- Swadlow HA, Weyand TG. 1987. Corticogeniculate neurons, corticotectal neurons, and suspected interneurons in visual cortex of awake rabbits: Receptive-field properties, axonal properties, and effects of EEG arousal. J Neurophysiol 57:977–1001. [DOI] [PubMed] [Google Scholar]
- Swadlow HA. 1989. Efferent neurons and suspected interneurons in S-1 vibrissa cortex of the awake rabbit: Receptive fields and axonal properties. J Neurophysiol 62:288–308. [DOI] [PubMed] [Google Scholar]
- Swadlow HA. 1994. Efferent neurons and suspected interneurons in motor cortex of the awake rabbit: Axonal properties, sensory receptive fields, and subthreshold synaptic inputs. J Neurophysiol 71:437–453. [DOI] [PubMed] [Google Scholar]
- Tan Z, Hu H, Huang ZJ, Agmon A. 2008. Robust but delayed thalamocortical activation of dendritic-targeting inhibitory interneurons. Proc Natl Acad Sci USA 105:2187–2192. [DOI] [PMC free article] [PubMed] [Google Scholar]
- Temereanca S, Simons DJ. 2004. Functional topography of corticothalamic feedback enhances thalamic spatial response tuning in the somatosensory whisker/barrel system. Neuron 41:639–651. [DOI] [PubMed] [Google Scholar]
- Thomson AM, Deuchars J, West DC. 1993. Large, deep layer pyramid–pyramid single axon EPSPs in slices of rat motor cortex display paired pulse and frequency-dependent depression, mediated presynaptically and self-facilitation, mediated postsynaptically. J Neurophysiol 70: 2354–2369. [DOI] [PubMed] [Google Scholar]
- Thomson AM. 2000. Facilitation, augmentation and potentiation at central synapses. Trends Neurosci 23:305–312. [DOI] [PubMed] [Google Scholar]
- Thomson AM. 2010. Neocortical layer 6, a review. Front Neuroanat 4:13. [DOI] [PMC free article] [PubMed] [Google Scholar]
- Tsumoto T, Suda K. 1980. Three groups of cortico-geniculate neurons and their distribution in binocular and monocular segments of cat striate cortex. J Comp Neurol 193:223–236. [DOI] [PubMed] [Google Scholar]
- Usrey M, Fitzpatrick D. 1996. Specificity in the axonal connections of layer VI neurons in Tree Shrew striate cortex: Evidence for distinct granular and supragranular systems. J Neurosci 16:1203–1218. [DOI] [PMC free article] [PubMed] [Google Scholar]
- van Brederode JFM, Snyder GL. 1992. A comparison of the electrophysiological properties of morphologically identified cells in layers 5B and 6 of the rat neocortex. Neuroscience 50:315–337. [DOI] [PubMed] [Google Scholar]
- Van Horn SC, Erişir A, Sherman SM. 2000. Relative distribution of synapses in the A-laminae of the lateral geniculate nucleus of the cat. J Comp Neurol 416:509–520. [PubMed] [Google Scholar]
- Viaene AN, Petrof I, Sherman SM. 2011. Synaptic properties of thalamic input to the subgranular layers of primary somatosensory and auditory cortices in the mouse. J Neurosci 31(36):12738–12747. [DOI] [PMC free article] [PubMed] [Google Scholar]
- Volgushev M, Kudryashov I, Chistiakova M, Mukovski M, Niesmann J, Eysel UT. 2004. Probability of transmitter release at neocortical synapses at different temperatures. J Neurophysiol 92:212–220. [DOI] [PubMed] [Google Scholar]
- von Krosigk M, Monckton JE, Reiner PB, McCormick DA. 1999. Dynamic properties of corticothalamic excitatory postsynaptic potentials and thalamic reticular inhibitory postsynaptic potentials in thalamocortical neurons of the guinea-pig dorsal lateral geniculate nucleus. Neuroscience 91:7–20. [DOI] [PubMed] [Google Scholar]
- West DC, Mercer A, Kirchhecker S, Morris OT, Thomson AM. 2006. Layer 6 cortico-thalamic pyramidal cells preferentially innervate interneurons and generate facilitating EPSPs. Cereb Cortex 16: 200–211. [DOI] [PubMed] [Google Scholar]
- White EL. 1978. Identified neurons in mouse Sml cortex which are postsynaptic to thalamocortical axon terminals: A combined Golgielectron microscopic and degeneration study. J Comp Neurol 181: 627–661. [DOI] [PubMed] [Google Scholar]
- White EL. 1989. Cortical circuits, synaptic organization of the cerebral cortex, structure, function, and theory. Boston: Birkhauser. [Google Scholar]
- Wörgötter F, Eyding D, Macklis JD, Funke K. 2002. The influence of the corticothalamic projection on responses in thalamus and cortex. Philos Trans R Soc Lond B Biol Sci 357:1823–1834. [DOI] [PMC free article] [PubMed] [Google Scholar]
- Yu C, Derdikman D, Haidarliu S, Ahissar E. 2006. Parallel thalamic pathways for whisking and touch signals in the rat. PLoS Biol 4: e124. [DOI] [PMC free article] [PubMed] [Google Scholar]
- Yutao T, Zhuo Y, Zhang T. 2010. Zinc ion as modulator effects on excitability and synaptic transmission in hippocampal CA1 neurons in Wistar rats. Neurosci Res 68:167–175. [DOI] [PubMed] [Google Scholar]
- Zhang ZW, Deschênes M. 1997. Intracortical axonal projections of lamina VI cells of the primary somatosensory cortex in the rat: A single-cell labeling study. J Neurosci 17:6365–6379. [DOI] [PMC free article] [PubMed] [Google Scholar]
- Zhang ZW, Deschênes M. 1998. Projections to layer VI of the posteromedial barrel field in the rat: A reappraisal of the role of corticothalamic pathways. Cereb Cortex 8:428–436. [DOI] [PubMed] [Google Scholar]
- Zilles K, Wree A. 1985. Cortex: Areal and laminar structure In: Paxinos G, editor. The rat nervous system. 2nd ed. New York: Academic; pp 649–685. [Google Scholar]