Abstract
The Ebola virus (EBOV) is a virulent pathogen that causes severe hemorrhagic fever with a high fatality rate in humans. The EBOV transformer protein VP40 plays crucial roles in viral assembly and budding at the plasma membrane of infected cells. One of VP40’s roles is to form the long, flexible, pleomorphic filamentous structural matrix for the virus. Each filament contains three unique interfaces: monomer NTD-NTD to form a dimer, dimer-to-dimer NTD-NTD oligomerization to form a hexamer, and end-to-end hexamer CTD-CTD to build the filament. However, the atomic-level details of conformational flexibility of the VP40 filament is still elusive. In this study, we have performed explicit-solvent, all-atom molecular dynamic simulations to explore the conformational flexibility of the three different interface structures of the filament. Using dynamic network analysis and other calculational methods, we find that the CTD-CTD hexamer interface with weak inter-domain amino acid communities is the most flexible, and the NTD-NTD Oligomer interface with strong inter-domain communities is the least flexible. Our study suggests that the high flexibility of the CTD-CTD interface may be essential for the supple bending of the Ebola filovirus, and such flexibility may present a target for molecular interventions to disrupt the Ebola virus functioning.
1. Introduction
The pleomorphic Ebola virus (EBOV), a member of the Filoviridae family, is a deadly pathogen that causes a severe hemorrhagic fever with a high mortality rate in humans1-3. This disease is especially dangerous because no approved vaccines or chemotherapeutics are currently available. Of the four known EBOV strains that are transmittable to humans, the Zaire and Sudan EBOVs have been responsible for most of the EBOV clinical cases1, 4. The elucidation of the underlying molecular mechanisms responsible for the EBOV replication and pathogenesis is required for the development of antiviral therapeutics.
Of the proteins that are encoded by the seven genes of EBOV, the 40kDa VP40 5 is a major structural matrix protein that plays a key role in budding and assembly of the EBOV6-10 .The 326-amino acid long VP40 protein has an N-terminal domain (NTD; residues 1-195) and C-terminal domain (CTD; residues 196-326). Rearrangement of the NTD and CTD relative to each other allows VP40 to form different conformational states11, 12, permitting VP40 to display transformer-like protein characteristics13, 14 and to perform different functions in the virus life cycle: a butterfly-shaped dimer structure is essential in the transport of the protein to a cellular membrane11, 12, a hexameric structure acts as a structural building block of the cylindrical viral matrix filament11, and an octamer ring structure binds to RNA and regulates viral transcription11, 15.
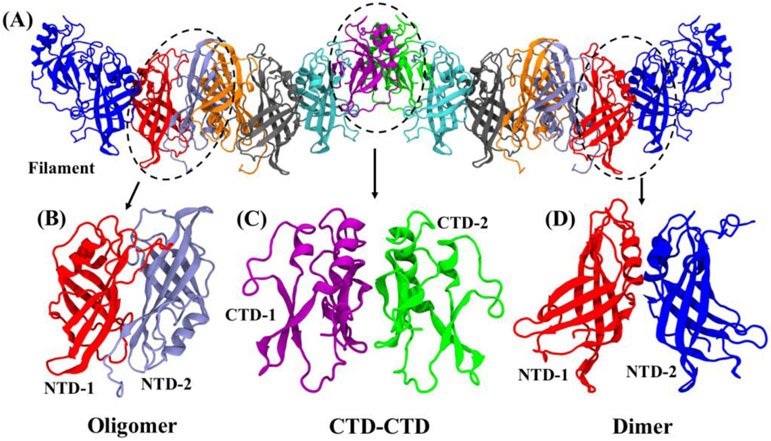
Before reaching the cellular membrane, the butterfly-shaped dimer is formed by interaction of the NTD of one protomer (NTD-NTD Dimer interface of Fig. 1D) with the NTD of another VP40 protomer11,12. The dimer further assembles into a hexamer through several steps as revealed by Bornholdt et al.11 First, the dimeric VP40 migrates to the plasma membrane and the basic patches of the CTDs interact with the membrane. Subsequently, the VP40 dimers assemble with each other through NTD-NTD oligomer interactions as an intermediate. Finally, the central CTDs spring away from the NTDs. At each end of the hexamer is a VP40 protomer with an unsprung CTD. The NTDs of four protomers form the central core of the hexamer and assemble through the NTD-NTD dimer-dimer oligomerization interface of Fig. 1B, and their CTDs are sprung away. A linear VP40 filament is then created via the unsprung CTD-CTD interaction between hexamers (Fig. 1C). The cylindrical structural matrix of the Ebola virus is formed by side-by-side interactions between the VP40 filaments as discussed in Pavadai et al.16. Separately, a VP40 octameric ring can form by springing all CTDs away from their NTDs, followed by oligomerization through the NTD-NTD oligomerization interface11,15. However, information on the molecular mechanisms by which VP40 transforms from a dimeric to a hexameric or octameric structure is still limited. Understanding the dynamical molecular mechanisms of these structural conversion will shed light on how the VP40 protein performs multiple functions in the EBOV life cycle.
Figure 1.
(A) A section of the EBOV VP40 linear filament composed of two hexamers connected through end-to-end ‘unsprung’ CTDs. Three distinct interfaces are highlighted by dashed circles: (B) NTD-NTD oligomerization to connect dimers, (C) CTD-CTD interface to connect hexamers end-to-end, and (D) NTD-NTD dimer interface between monomers to form a dimer. For clarity, the ‘sprung CTDs’ are not shown in ‘B’ for the dimer-dimer oligomer interface, the NTDs are not shown in ‘C’ for the CTD-CTD hexamer interface, and the ‘unsprung’ CTDs are not shown in ‘D’ for the monomer-monomer dimer interface.
Biochemical, biophysical, and structural studies using cryo-electron tomography, sub-tomogram image processing, mutagenesis, and mini-genome assays have provided information about the conformational flexibility of VP4011,15,17,18. In this study, we have employed explicit-solvent atomistic simulations to explore the dynamical flexibility of the three interfaces described above (Fig. 1) in the VP40 filament. Our results from analyzing structural fluctuations, resistance to bending, and dynamic network connectivity implies a high degree of flexibility for CTD-CTD interface and low flexibility for the NTD-NTD dimer-dimer Oligomer interface. We have also used NMA and dynamic-cross correlation matrix to map which amino acid sections are rigid and flexible in the interface structures. Our results suggest that the high flexibility of the CTD-CTD interface may be essential for the supple bending of the Ebola virus, and the other filoviruses. The flexibility of this interface may also present a target for molecular interventions to disrupt the functioning of the Ebola virus.
2. Materials and methods
System preparation:
The initial structures for the VP40 NTD-NTD dimerization, NTD-NTD oligomerization, and end-to-end CTD-CTD interfaces were extracted from the crystal structure of a linear VP40 filament (Protein Data Bank ID: 4LDD)11. These interface structures are shown in Figure 1, and they are referred to as a protein-protein complex or a protein-protein interface throughout the manuscript. The missing residues from the PDB 3D structures of the interfaces are listed in the PDB file. These residues were added to the structure using the Modeller 9.17 software package19 and are shown for each interface in Fig. S1 in the Supporting Information. The protein systems were prepared for simulations using the CHARMM-GUI web interface20 with standard parameters, including physiological pH of 7.4 and physiological salt concentration of 0.15 M KCl.
MD simulations:
All-atom explicit solvent MD simulations were performed with the CHARMM36m force field 21, 22 using the NAMD 2.12 simulation package 23. The particle mesh Ewald method was used to calculate the long-range ionic interactions. The covalent bonds involving hydrogen atoms were constrained by the SHAKE algorithm. For each system, a 10000-step minimization followed by equilibration runs were performed with NVT (constant volume and temperature) simulations. This was followed by NPT (constant pressure and temperature) production runs at 300 K using 2 fs time steps. The pressure was controlled using the Nose–Hoover Langevin-piston method, with a piston period of 50 fs and a decay of 25 fs. Similarly, the temperature was controlled using the Langevin temperature coupling with a friction coefficient of 1 ps. Snapshots of each system were saved every 10 ps. For all three interfaces, energy minimization was performed for 20 ps, followed by equilibration for 50 ps. The production runs were performed for 500 ns. The number of atoms for the oligomer was 68,000, for the CTD-CTD interface 62,000, and for the Dimer interface 80,000.
Steered Molecular Dynamics (SMD) simulations:
SMD was used to determine the bending flexibility for each of the three interfaces. For the SMD simulations, the equilibrated structures of the interfaces were used. We constrained the atoms at the outer edges of the structure and pulled on the Cα atoms at an interface in a direction that produces a bending motion at the interface. Later, in Fig. 5, we provide a detailed description of the Cα atoms that were chosen. We used a spring constant k of 1 kcal/molÅ2 and pulled at a constant speed of 0.4 Å/ns with a time step of 1 fs for 10 ns for all three interfaces. These choices were made in order to create a bending stress at the interface with disturbing the internal structures of the domains, as explained in the Results section. The resistance offered to each interface was observed by plotting force-time graphs.
Figure 5.
(A) Schematic showing the transect line set-up for using SMD to measure the resistance to flexing at the domain interface. (B) An amino on the transect line at the outer edge of each domain is immobilized and an amino acid of each domain at the interface are both pulled perpendicular to the transect line. (C) The pulling force necessary to flex each interface at the same constant speed.
Dynamical Network Analysis:
Dynamic network analysis has been used to understand the pathways and co-related motion of amino-acids of various proteins like tRNA24, protein kinase25, and Rfah14. Dynamic network analysis is applied to understand the co-related atomic motions of the protein. It provides the detailed information in the form of community which highlights the important amino-acids responsible for connecting domains and protein-protein interface.24
The NetworkView plugin24, 26, 27 in VMD was employed to perform the dynamical network analysis for all interface systems. Carma28 software is used to calculate covariance and correlations between pairs of amino-acids and Catdcd is used to break down the trajectory file for Carma calculations. In molecular dynamics simulations, the amino-acids co-relation motion are studied in order to generate communities. In each community, amino acids in the network are represented by a node centered at the Cα for each residue and co-relation values represent the weighted edge between the nodes. Nodes are connected by edges if they are within a cut-off distance of 4.5 Å for at least 75% of the simulation time. The shortest path between the nodes for communication are identified. The communities in the network are defined as the time-averaged connectivity of the nodes and were constructed using the Girvan-Newman algorithm29. The thickness of edges represents the co-relations that define the probability of information transfer along the edge. The strength and size of a community is determined based on many factors including the weight of edges joining nodes and communities, the number of connecting edges, etc.
Normal mode and dynamic cross-correlation analyses:
The low-frequency collective motions of the three interface structures were analyzed by the elastic network model of NMA with the use of the NMA function of the Bio3D software package30. The default settings of the Bio3D program were used for the calculations, which compute the normal modes of the motions of the Cα atoms with an elastic network model (ENM) model using the ‘calpha’ force field31.
The dynamic cross-correlation analysis and map (dccm) for interfaces trajectories obtained from the NMA were computed with the use of the DCCM function of Bio3D. This function calculates the covariance matrix based on mutual information between all Cα atoms in the interface structures. The root mean square deviation (RMSD), root mean square deviation fluctuation (RMSF), center of mass distance, interaction energy, visualization of the trajectories and preparation of figures were performed with the use of VMD27. The angle between the best-fit line of the Cα atom coordinates of domains was created utilizing the fit angle script of the VMD Script Library.
Principal Component Analysis (PCA):
The coordinated motions of the atoms of the three interface structures were further examined with the use of the PCA function of the Bio3D software package. Default settings of the program were used for the PCA calculations and we analyzed the last 200 ns of the MD trajectories. The least squares fitting method was used to remove the overall translational and rotational motions of the trajectories. Subsequently, the PCA function performs a diagonalization of the variance-covariance matrix of the data points of the system based on the mutual information between all Cα atoms in the interface structures. The diagonalization of the covariance matrix produces eigenvectors, each with its corresponding eigenvalue. The eigenvectors indicate the direction of the motion of atoms while the eigenvalues represent the magnitude of the motion.
3. Results and discussion
Analysis of the VP40 linear filament (Figure 1A) shows three distinctive interfaces: NTD-NTD dimer-dimer oligomer interface (Figure 1B), NTD-NTD monomer-monomer dimer interface (Figure 1D), and hexamer-hexamer end-to-end CTD-CTD interfaces (Figure 1C). The dimer interface of Fig. 1C is conserved among all EBOV strains and is formed by residues 52–65 on one NTD and 108–117 on the other NTD. This interface is dominated by hydrophobic interactions and has a limited number of hydrogen bonds. The NTD-NTD dimer-dimer oligomer interface (Fig. 1B) is centered on the hydrophobic Trp-95 residue from each NTD domain when the CTDs are sprung away from the NTDs 11. This interface is the basis for creating the central core of four NTDs of the hexamer and is homologous to the interface found in the VP40 RNA-binding octameric ring structure15. The hexamer-hexamer end-to-end CTD-CTD interface is conserved among all EBOV strains and formed by L203, I237, M241, M305, and I307 hydrophobic residues 11.
In order to explore the flexibility of the filament that is necessary for the viral functions, the three representative interface structures were extracted from the linear VP40 filament. We performed 500 ns all-atom explicit-solvent MD simulations as well as NMA computations as described above. The ‘sprung’ CTDs for the oligomer interface were not considered as they were unstructured in the crystal structures. In addition, the ‘unsprung’ CTDs for the dimer NTD-NTD interface and the NTDs for the CTD-CTD interface were not included for the reasons of comparability and consistency.
3.1. Flexibility of the interface structures
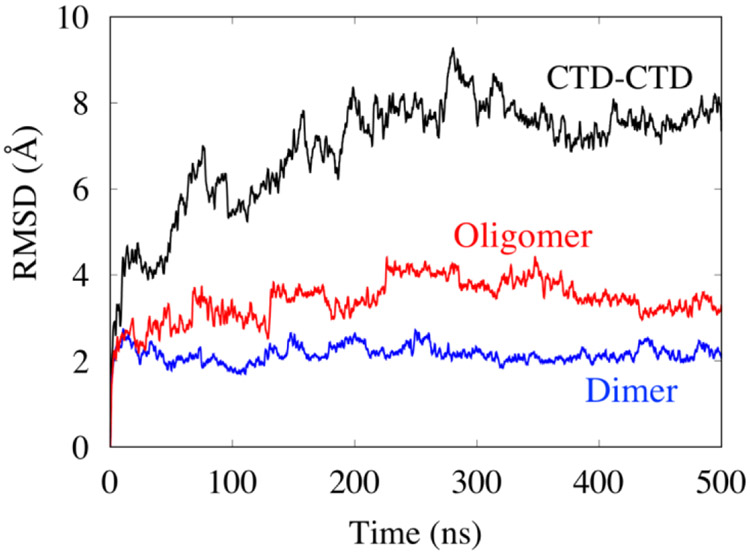
To quantitatively analyze the stability of the interface structures, we computed the root mean-square deviations (RMSD) summed over all of the backbone atoms of the interface structures relative to their initial structures as a function of simulation time as shown in Figure 2. The CTD-CTD interface has an RMSD compared to its initial structure of approximately 8 Å, whereas the dimer and oligomer interface structures have an RMSD of approximately 2 Å and 3 Å, respectively, indicating that the CTD-CTD interface is significantly more flexible than other interface structures. This result agrees with the experimental result that the CTD-CTD interface is flexible and the oligomer interface is rigid (Bornholdt et al. 2013). For each interface, we also examined the RMSD of each member separately, and plot the results in Fig. S2. The results show that for each interface, both members exhibit similar flexibility.
Figure 2.
The RMSD of the different interfaces as a function of MD simulation time.
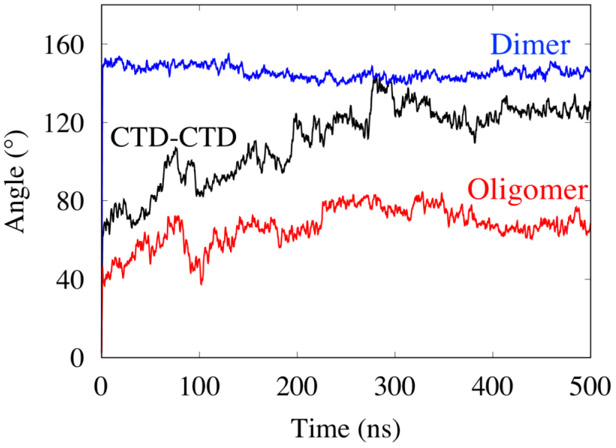
To further understand the relative motion and dynamics of the interface structures, we calculated the angle between the best-fit line of the Cα atom coordinates of the two domains for each of the three interface structures as a function of time. The fluctuations in the curves of Fig. 3 show that the NTD-NTD dimer interface is very rigid and the CTD-CTD interface is the most flexible. The RMSD and angle analyses indicate that all three systems, dimer, oligomer and CTD-CTD interfaces, reached equilibrium by 400 ns.
Figure 3.
Fluctuations in the angle between the best-fit line of the Cα atom coordinates of the two domains for each interface as a function of time.
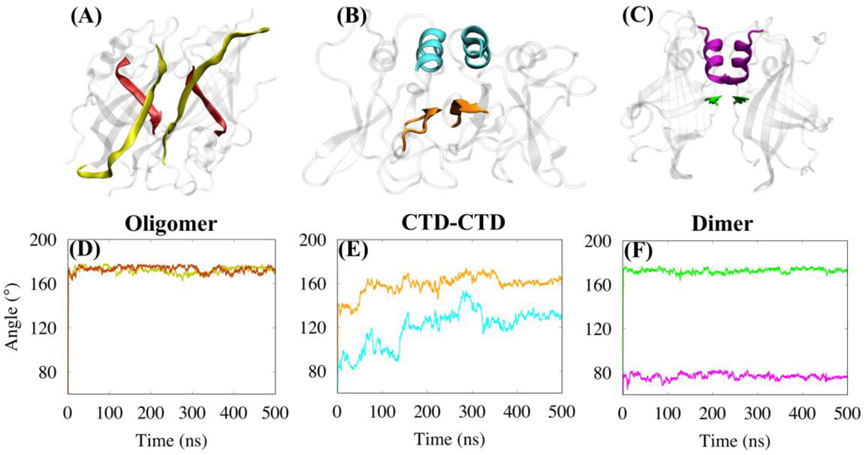
To obtain more detailed information about the structural elements that contribute to the flexibility of the interface structures, we examined the relative motion of small groups of amino acids on either side of each interface. For each interface structure, we chose two pairs of small structural elements. The small structural element is either an α-helix or a β-strand. Within each pair, the amino acids composing the structural element are the same on both domains. The groups of amino acids are listed in Table 1 and displayed in Fig. 4.
Table 1.
For each interface, two small groups (Group I, Group II) of amino acids on each domain are chosen for detailed investigation of flexibility. For each group, the amino acids are the same on each of the two domains.
| Oligomer | CTD-CTD | Dimer | |
|---|---|---|---|
| Group I | β-strand 85-102 | α-helix 233-243 | β-strand 53-56 |
| Group II | β-strand 153-159 | β-strand 303-310 | α-helix 107-118 |
Figure 4.
(A, B, C) Visualization of the structural elements located at the three interfaces; (D,E,F) fluctuations in the angle between the best-fit line of the Cα atom coordinates of the structural elements of each group as a function of simulation time. The group elements are highlighted in A, B and C, and the corresponding colors are used in the plot.
We computed fluctuations in the angles between the best-fit line of the Cα atom coordinates of the two elements and center of mass distance (dCOM) in each group, e.g. for Group I of the oligomer interface, the angle was computed between the principal axis of residues 85-102 of one NTD domain relative to the principal axis of residues 85-102 of the other NTD domain. Figure 4 shows that the fluctuations in the angle are largest for the CTD-CTD interface, with the α-helix↔α-helix Group I display the largest fluctuations. As in the previous diagrams, the Dimer NTD-NTD interface is the most rigid with little fluctuation in the angle for either Group I or Group II. The Oligomer interface also shows little flexibility. Further examination of the flexible CTD-CTD interface reveals that the α-helix shows torsional-like motions until 300 ns and then reached equilibrium. The CTD-CTD β-strands are less flexible than the helices, but the twisted β-strands become parallel. This result is in line with the experimental observation that the CTD-CTD interface allows torsional motions of the domains 11. We also computed dCOM between the structural elements as explained above. The results are displayed in Supporting Information Fig. S3. The structural pairs maintain the distances at both the dimeric and oligomeric interface structures throughout the simulation, indicating that both of these interfaces are stable. Nevertheless, the Group I (α-helixI-α-helixII) structural pair distance at the CTD-CTD interface displays much more motion, but a little motion was observed between β-sheetI and β-sheetII, Group II, signifying that CTD-CTD interface is flexible.
To further understand the fluctuation of individual residues at the interfaces, the root-mean square fluctuation (RMSF) of Cα atoms of interface structures from the last 100 ns simulation trajectory was analyzed, which reveals the flexibility of each residue of the interface structures, as shown in Figure S4. In all interface structures, large fluctuations occur in the loop regions and low fluctuations occur in the α-helix and β-sheet regions. The high RMSF indicates loosely organized loop or terminal regions. As shown in Fig. S4 of the Supporting Information, the structural elements at the interface show lower RMSF values than other regions of the structures, indicating that the domains interact strongly with each other. Interestingly, the CTD-CTD interface shows increased RMSF values compared to the other two interface structures, signifying that there is considerable fluctuation at the CTD-CTD interface.
Bending Flexibility of Interfaces
The relative flexibility for bending of each interface was determined by measuring the force necessary to flex it. For each interfacial structure, we chose a transect line that started on the Cα atom of a residue near the middle of the outside edge of one domain, through the middle of the interface, to the Cα atom of a residue near the middle of the outside edge of the other domain. A schematic of this transect line is shown in Fig. 5A. As shown in Fig. 5B, for the SMD we immobilized the Cα on the transect line at the outer edge of each domain. We chose two Cα close to the transect line, one for each domain, that are directly at the interface and pulled on both of the amino acids in a direction perpendicular to the transect line of the domains so that the interface would flex. We pulled at a relatively slow constant flex speed of 0.4 Å/ns with an SMD virtual spring of k=1 Kcal/mol·Å2 with a timestep of 1 fs for 10 ns. We chose relatively low values of pulling speed and spring constant to avoid disrupting the internal structure of the domains and non- equilibrium effects in order to focus on the bending motion. These low values of pulling speed and spring constant produces gradual changes on the system as compared to dynamics that would occur with higher values32, 33.
Figure 5C shows the pulling force necessary for each interface to maintain the same speed of flex. Consistent with the high flexibility displayed in the previous figures, in Fig. 5C, the CTD-CTD interface shows the least resistance to flexing.
3.2. Interaction of the interface structures
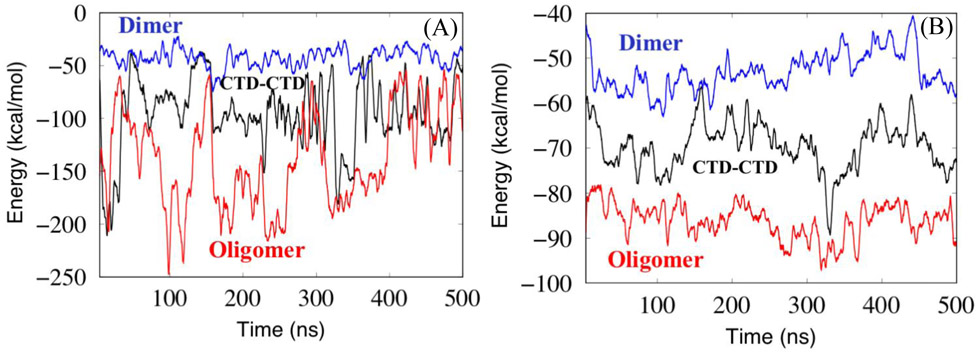
The flexibility analyses above show that the CTD-CTD interface is more flexible than the NTD-NTD Dimer and Oligomer interfaces. To understand which amino acids and molecular interactions are responsible for the differences, we calculated the energies for various types of interactions between the domains at the interface. Figure 6 shows the electrostatic interaction energy and van der Waals (vdW) contact energy as a function of simulation time. The plots of both the electrostatic inter-domain energy and the vdW inter-domain energy show that interactions between the domains of the CTD-CTD interface are intermediate in strength between the Dimer and the Oligomer interfaces. This shows that the CTD-CTD interface is a secure connection that does not easily break, but these bonding energies do not explain the enhanced flexibility of the CTD-CTD interface. Therefore, it is necessary to investigate the inter-domain interactions in more detail to explain the relative flexibility of the different interfaces. In the next section, we describe the inter-domain network analysis that we performed.
Figure 6.
Inter-domain interaction energy computed between domains for the interface structures as a function of simulation time. (A) electrostatic, (B) van der Waals
3.3. Dynamical network analysis
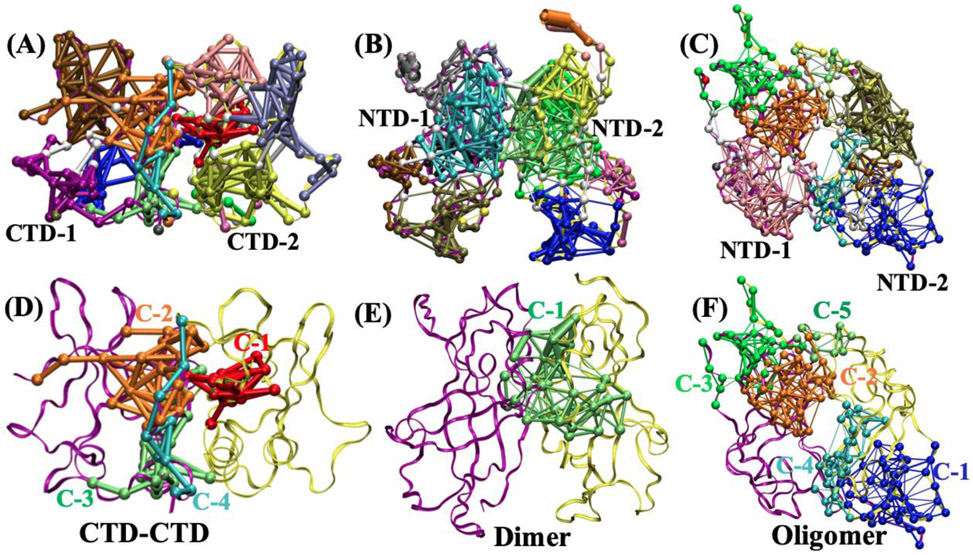
The relative flexibility of a domain-domain interface is affected by the number and strength of the inter-domain interactions, and also depends on their topological arrangement. In order to visualize the topological networks formed by different groups (communities) of amino acids at the interface as a result of their correlated molecular motions, we calculated the dynamical networks of each of the three interface structures obtained from the last 100 ns of their separate MD trajectories using the NetworkView plugin in VMD. In Fig. 7, amino acids are represented by a node centered at the Cα for each residue and co-relation values are represented by the weighted edge between the nodes. The shortest path between the nodes for communication are identified. The communities in the network are defined as the time-averaged connectivity of the nodes and were constructed using the Girvan-Newman algorithm 29. The thickness of edges represents the co-relations that define the probability of information transfer along the edge.
Figure 7.
Dynamic network community analysis from the last 100 ns of the MD trajectories. Different communities are shown in different colors. The line thickness between the amino acids represents how strongly the motions of residues within the community are correlated. (A) CTD-CTD, (B) dimer, (C) oligomer. Amino acid communities formed by residues that span both domains are shown in (D) CTD-CTD, (E) Dimer, (F) Oligomer.
We found a total of 18 communities for the CTD-CTD interface, 15 communities for the Oligomer interface, and 18 communities for the Dimer interface as shown in Figs. 7(A-C). In Figs. 7, different communities are displayed in different colors.
Especially important for the flexibility of an interface are communities composed of amino acids from both domains and span the domain-domain interface. Since the amino acids within a community have highly correlated motions, the communities that span an interface reduce the flexibility of one domain relative to the other domain. The communities with amino acids that span each interface are numbered in Figs. 7(D-F). Communities that do not span the interface are not numbered in Figs. 7(D-F) and are shown in yellow or purple. There are five communities that span the oligomer interface, one community that spans the dimer interface, and three communities that span the CTD-CTD interface. Most importantly for reducing domain-domain flexibility is the number of connections between amino acids on opposite domains. Examination of the domain-spanning communities in more detail shows that the number of inter-domain connections differs among the communities. Table 2 shows the amino acids that are connected across the interface for each community and the characterization of the properties of those connections are summarized in Table S1. Within the two columns for each interface structure, each row identifies the amino acids that are connected to each other across the interface from one domain to the other. Though the Dimer interface has only one community that spans both domains, this interface is especially dense with inter-domain connections. The bottom row of the table provides the sum of all inter-domain connections for each interface: Oligomer-33, Dimer-19, CTD-11. This ordering is the same in Fig. 5 that displays the pulling force necessary to flex each interface.
Table 2.
For each of the inter-domain communities pictured in Figs. 7(D-F) for each interface structure, a list of amino acids in each inter-domain network community that are dynamically connected to amino acids on the other domain. The bottom row of the table provides the sum of all inter-domain amino acid connections for each interface.
| Community | Oligomer | Dimer | CTD-CTD | |||
|---|---|---|---|---|---|---|
| NTD-1 | NTD-2 | NTD-1 | NTD-2 | CTD-1 | CTD-2 | |
| Comm-1 | P93 | P187 | I54, A55, D56, D57 | R52 | V306, I307, T308 | T304 |
| K90, I92 | A189 | A55, I59 | L117 | |||
| M89, K90 | T190 | A55, M116 | M116 | |||
| L88, M89 | W191 | T112 | L117 | |||
| L88, V87 | T192 | R52, M116, L117 | A55 | |||
| Q91 | A188, A189 | R52 | D57 | |||
| I92 | A189 | L117 | I59 | |||
| D109, S110, A113 | D109 | |||||
| A113, L117 | T112 | |||||
| Comm-2 | V100 | E160, F161, V162, L163 | P234 | Q238, T242 | ||
| L186, P187 | P93 | |||||
| S70, V100 | P164 | |||||
| A72, Q184 | W95 | |||||
| Comm-3 | T190 | M89, K90 | L295 | R214, S316 | ||
| W191 | L88, M89 | P297 | K212, L213, P215 | |||
| Comm-4 | W95, Q160, F161, L163 | V100 | H315 | I293 | ||
| P165 | S70 | |||||
| W95 | L186 | |||||
| Comm-5 | D102 | P165 | ||||
| Total Connections | 33 | 19 | 11 | |||
Additional information about the contacts in Table 2 is provided in Table S1 in the Supporting Information. Information on the time-evolution of the inter-domain contacts is given in Fig. S5.
3.4. Normal mode analysis
Molecular dynamics (MD) simulations and normal mode analysis (NMA) haven been successfully used to obtain information about the functionally relevant dynamic processes of proteins under their physiological-mimic environments 34-37. To obtain additional information about the conformational flexibility, we performed normal mode analyses (NMA) of all three interfaces. The NMA can provide insight into the flexibility of interface structures in terms of collective motions of groups of atoms 38. The analyses were performed using the NMA function of the Bio3D package39 with default settings. Figure 8 displays one of the low frequency internal modes for each interface. Each figure is the superposition of the Cα NMA trajectory and the gray shading shows regions with large motion. As expected for flexing-type normal modes, residues execute larger motion the farther they are from the domain-domain interface. The CTD-CTD interface displays the largest flexibility.
Figure 8.
One of the low frequency internal modes for each interface. Each figure is the superposition of the Cα NMA trajectory and the gray shading shows regions with large motion.
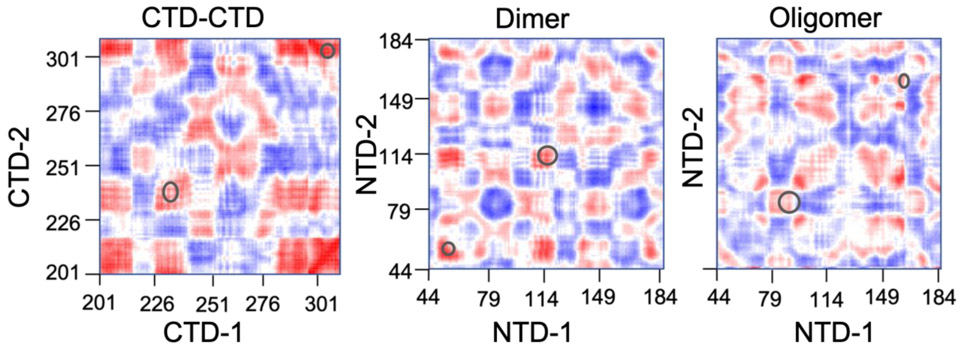
To provide further insight into the flexibility of the interface structures, we plot in Fig. 9 the correlation between the motions of the Cα atoms in the residues of one domain (horizontal axis) with respect to the residues in the other domain (vertical axis) for all three interface structures from their NMA trajectories. The correlation matrices were calculated using the dccm function of the Bio3D package. In order to capture a significant part of the motion, we plot the cross-correlation matrix using the combined motions from the 10 lowest frequency modes. The correlation is measured by calculating the cross-correlation coefficient (−1 to +1) between the Cα atomic motions. A value of +1 (red color) represents atoms moving in a similar direction, whereas −1 (blue color) represents atoms moving in the opposite direction. A value of zero (white color) represents no correlation in the motion of the atoms. Figure 9 shows that the interdomain motions are more positively correlated for the CTD-CTD interface and least correlated for the Oligomer interface. Further, the groups of amino acids across the two domains for each interface that are highlighted in Table 1 and Fig. 4 as being especially important for interdomain flexibility display high correlation values in Fig. 9 and are circled.
Figure 9.
Dynamical cross-correlation matrix demonstrating the correlation of motion between Cα atoms of residues in one domain (horizontal axis) with respect to residues on the other domain (vertical axis). The circles highlight the strong interdomain correlations between amino acids that are listed in Table 1 and Fig. 4.
3.5. Principal component analysis
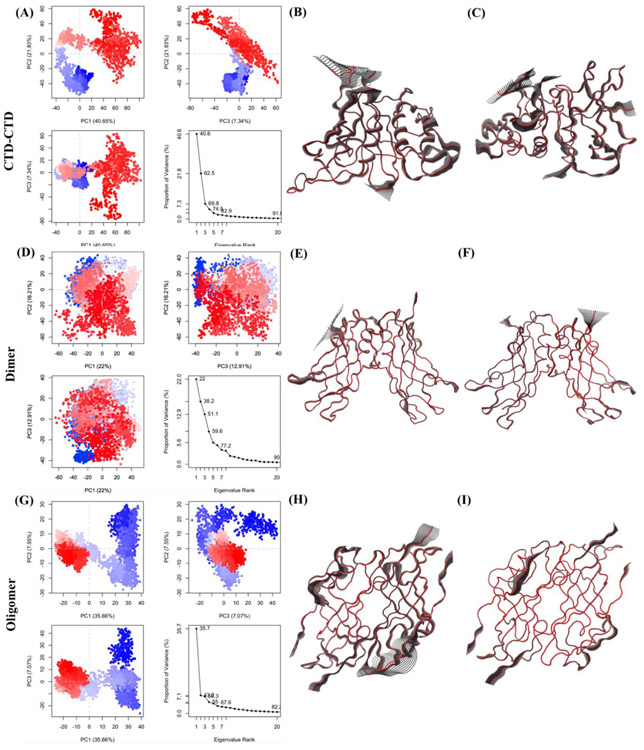
To further understand the distinct conformational transitions and motions of the interfaces, PCA was performed on the last 200ns of the MD trajectories for each of the three interfaces. The results are shown in Figs. 10-A,B,C for the CTD-CTD interface, Figs. 10-D,E,F for the Dimer interface, and Figs. 10-G,H,I for the Oligomer interface. The conformational motions are analyzed by projecting the trajectories onto two-dimensional subspaces spanned by the first PCA three eigenvectors (PC1, PC2, and PC3). Figures 10-A, D and G show the conformational spaces of the three interface structures: (PC1,PC2), (PC1,PC3), and (PC2,PC3). The different conformational states are shown in red and blue dots in the plot. The distributions displayed in Fig. 10A show that the CTD-CTD interface has conformations that are clustered with long-distance jumps between conformations. This is also true for the Oligomer interface as shown in Fig. 10G. However, Fig. 10D shows that the conformational states of the Dimer are not arranged in separated clusters. In addition to the PC plots, we also display visualization of the motions of the Cα atoms for PC1 and PC2 for each of the three interfaces: Figs. 10-B,C for the CTD-CTD interface, Figs. 10-E,F for the Dimer interface, and Figs. 10-H,I for the Oligomer interface. The analysis and visualization of the PC1 and PC2 for the interface structures in Figure 10 shows that the CTD-CTD is relatively more flexible compared to the other two interface structures. This result is consistent with the NMA and angle analyses.
Figure 10.
From Principal Component Analysis, projections of the trajectories onto planes by the first three eigenvectors. (A) Projection of trajectories into PC1, PC2, and PC3 for the CTD-CTD interface, (D) Projection of trajectories into PC1, PC2, and PC3 for the Dimer interface and (G) Projection of trajectories into PC1, PC2, and PC3 for the Oligomeric interface. The color scale from blue to white to red shows that there are periodic jumps between these conformers through the trajectory. (B) Visualization of the molecular motions along (B) PC1 and (C) PC2 for CTD-CTD, (E) PC1 and (F) PC2 for the Dimer, and (H) PC1 and (I) PC2 for the Oligomeric interfaces. The gray shading shows regions with large motion.
4. Conclusions
The EBOV matrix protein VP40 is the main structural protein of the long, thin, flexible Ebola virion. VP40 hexamers attach end-to-end at a CTD-CTD interface into linear filaments. Analysis of the long VP40 filament shows three unique interfaces; Dimer, Oligomer, and the end-to-end CTD interfaces. The conformational flexibility of the VP40 structural matrix has been suggested to be essential for the pleomorphic nature of the Ebola virions11, 40, 41. Here, we have performed MD simulations, normal mode analysis, principal component analysis, and other calculations to investigate the dynamical flexibility and stability of the three different structural interfaces to determine which contributes most to the flexibility of the virion. MD simulations and analysis show that the CTD-CTD interface is the most flexible and the oligomer interface is the most rigid. Though all three interfaces have similar numbers of strong domain-domain interactions, our dynamical network analysis shows that the rigidity of the oligomer interface is due to a large number of weak interactions across the domain interface. In contrast, the flexible CTD-CTD interface has a relatively small number of this type of connections.
The high flexibility of the CTD-CTD interface may be essential for the supple bending of the EBOV, while the rigidity of the Oligomer interface may be necessary for the structural stability of the EBOV. The flexibility and rigidity of the interfaces may present targets for molecular interventions to disrupt the functioning of the EBOV.
Supplementary Material
Acknowledgement
VP40 related studies are supported by AI081077 (R.V.S.)
Footnotes
Supporting Information
Missing amino acids that were added using Modeller, the RMSD plotted separately for each member of each interface, fluctuations in distance between interdomain structural elements, RMSF of interface structural elements, additional information about interdomain interactions, time-evolution of inter-domain contacts.
The authors declare no competing financial interest.
References
- 1.Bwaka MA; Bonnet MJ; Calain P; Colebunders R; De Roo A; Guimard Y; Katwiki KR; Kibadi K; Kipasa MA; Kuvula KJ; et al. Ebola hemorrhagic fever in Kikwit, Democratic Republic of the Congo: clinical observations in 103 patients. J Infect Dis 1999, 179 Suppl 1, S1–7. [DOI] [PubMed] [Google Scholar]
- 2.Kuhn JH Filoviruses. A compendium of 40 years of epidemiological, clinical, and laboratory studies. Arch Virol Suppl 2008, 20, 13–360. [PubMed] [Google Scholar]
- 3.Team, W. H. O. E. R.; Aylward B; Barboza P; Bawo L; Bertherat E; Bilivogui P; Blake I; Brennan R; Briand S; Chakauya JM; et al. Ebola virus disease in West Africa--the first 9 months of the epidemic and forward projections. N Engl J Med 2014, 371 (16), 1481–95. [DOI] [PMC free article] [PubMed] [Google Scholar]
- 4.Osterholm MT; Moore KA; Kelley NS; Brosseau LM; Wong G; Murphy FA; Peters CJ; LeDuc JW; Russell PK; Van Herp M; et al. Transmission of Ebola viruses: what we know and what we do not know. MBio 2015, 6 (2), e00137. [DOI] [PMC free article] [PubMed] [Google Scholar]
- 5.Hoenen T; Groseth A; Falzarano D; Feldmann H Ebola virus: unravelling pathogenesis to combat a deadly disease. Trends Mol Med 2006, 12 (5), 206–15. [DOI] [PubMed] [Google Scholar]
- 6.Harty RN; Brown ME; Wang G; Huibregtse J; Hayes FP A PPxY motif within the VP40 protein of Ebola virus interacts physically and functionally with a ubiquitin ligase: implications for filovirus budding. Proc Natl Acad Sci U S A 2000, 97 (25), 13871–6. [DOI] [PMC free article] [PubMed] [Google Scholar]
- 7.Madara JJ; Han Z; Ruthel G; Freedman BD; Harty RN The multifunctional Ebola virus VP40 matrix protein is a promising therapeutic target. Future Virol 2015, 10 (5), 537–546. [DOI] [PMC free article] [PubMed] [Google Scholar]
- 8.Panchal RG; Ruthel G; Kenny TA; Kallstrom GH; Lane D; Badie SS; Li L; Bavari S; Aman MJ In vivo oligomerization and raft localization of Ebola virus protein VP40 during vesicular budding. Proc Natl Acad Sci U S A 2003, 100 (26), 15936–41. [DOI] [PMC free article] [PubMed] [Google Scholar]
- 9.Radzimanowski J; Effantin G; Weissenhorn W Conformational plasticity of the Ebola virus matrix protein. Protein Sci 2014, 23 (11), 1519–27. [DOI] [PMC free article] [PubMed] [Google Scholar]
- 10.Stahelin RV Could the Ebola virus matrix protein VP40 be a drug target? Expert Opin Ther Targets 2014, 18 (2), 115–20. [DOI] [PMC free article] [PubMed] [Google Scholar]
- 11.Bornholdt ZA; Noda T; Abelson DM; Halfmann P; Wood MR; Kawaoka Y; Saphire EO J. C. Structural rearrangement of ebola virus VP40 begets multiple functions in the virus life cycle. 2013, 154 (4), 763–774. [DOI] [PMC free article] [PubMed] [Google Scholar]
- 12.Dessen A; Volchkov V; Dolnik O; Klenk HD; Weissenhorn W Crystal structure of the matrix protein VP40 from Ebola virus. EMBO J 2000, 19 (16), 4228–36. [DOI] [PMC free article] [PubMed] [Google Scholar]
- 13.Gc JB; Bhandari YR; Gerstman BS; Chapagain PP Molecular dynamics investigations of the alpha-helix to beta-barrel conformational transformation in the RfaH transcription factor. J Phys Chem B 2014, 118 (19), 5101–8. [DOI] [PubMed] [Google Scholar]
- 14.Gc JB; Gerstman BS; Chapagain PP The Role of the Interdomain Interactions on RfaH Dynamics and Conformational Transformation. J Phys Chem B 2015, 119 (40), 12750–9. [DOI] [PubMed] [Google Scholar]
- 15.Gomis-Ruth FX; Dessen A; Timmins J; Bracher A; Kolesnikowa L; Becker S; Klenk HD; Weissenhorn W The matrix protein VP40 from Ebola virus octamerizes into pore-like structures with specific RNA binding properties. Structure 2003, 11 (4), 423–33. [DOI] [PMC free article] [PubMed] [Google Scholar]
- 16.Pavadai E; Gerstman BS; Chapagain PP A cylindrical assembly model and dynamics of the Ebola virus VP40 structural matrix. Sci Rep 2018, 8 (1), 9776. [DOI] [PMC free article] [PubMed] [Google Scholar]
- 17.Bhattarai N; Gc JB; Gerstman BS; Stahelin RV; Chapagain PP Plasma membrane association facilitates conformational changes in the Marburg virus protein VP40 dimer. RSC Adv 2017, 7 (37), 22741–22748. [DOI] [PMC free article] [PubMed] [Google Scholar]
- 18.Booth TF; Rabb MJ; Beniac DR How do filovirus filaments bend without breaking? Trends Microbiol 2013, 21 (11), 583–93. [DOI] [PubMed] [Google Scholar]
- 19.Sali A; Blundell TL Comparative protein modelling by satisfaction of spatial restraints. J Mol Biol 1993, 234 (3), 779–815. [DOI] [PubMed] [Google Scholar]
- 20.Jo S; Kim T; Iyer VG; Im W J. J. o. c. c. CHARMM‐GUI: a web‐based graphical user interface for CHARMM. 2008, 29 (11), 1859–1865. [DOI] [PubMed] [Google Scholar]
- 21.Huang J; MacKerell AD Jr. CHARMM36 all-atom additive protein force field: validation based on comparison to NMR data. J Comput Chem 2013, 34 (25), 2135–45. [DOI] [PMC free article] [PubMed] [Google Scholar]
- 22.Huang J; MacKerell AD Jr. Force field development and simulations of intrinsically disordered proteins. Curr Opin Struct Biol 2018, 48, 40–48. [DOI] [PMC free article] [PubMed] [Google Scholar]
- 23.Phillips JC; Braun R; Wang W; Gumbart J; Tajkhorshid E; Villa E; Chipot C; Skeel RD; Kale L; Schulten KJ J. o. c. c. Scalable molecular dynamics with NAMD. 2005, 26 (16), 1781–1802. [DOI] [PMC free article] [PubMed] [Google Scholar]
- 24.Sethi A; Eargle J; Black AA; Luthey-Schulten Z Dynamical networks in tRNA:protein complexes. Proc Natl Acad Sci U S A 2009, 106 (16), 6620–5. [DOI] [PMC free article] [PubMed] [Google Scholar]
- 25.McClendon CL; Kornev AP; Gilson MK; Taylor SS Dynamic architecture of a protein kinase. Proc Natl Acad Sci U S A 2014, 111 (43), E4623–31. [DOI] [PMC free article] [PubMed] [Google Scholar]
- 26.Eargle J; Luthey-Schulten Z NetworkView: 3D display and analysis of protein.RNA interaction networks. Bioinformatics 2012, 28 (22), 3000–1. [DOI] [PMC free article] [PubMed] [Google Scholar]
- 27.Humphrey W; Dalke A; Schulten KJ J. o. m. g. VMD: visual molecular dynamics. 1996, 14 (1), 33–38. [DOI] [PubMed] [Google Scholar]
- 28.Glykos NM Software news and updates. Carma: a molecular dynamics analysis program. J Comput Chem 2006, 27 (14), 1765–8. [DOI] [PubMed] [Google Scholar]
- 29.Girvan M; Newman ME Community structure in social and biological networks. Proc Natl Acad Sci U S A 2002, 99 (12), 7821–6. [DOI] [PMC free article] [PubMed] [Google Scholar]
- 30.Skjaerven L; Yao XQ; Scarabelli G; Grant BJ Integrating protein structural dynamics and evolutionary analysis with Bio3D. BMC Bioinformatics 2014, 15, 399. [DOI] [PMC free article] [PubMed] [Google Scholar]
- 31.Hinsen K ; Petrescu AJ; Dellerue S; Bellissent Funel MC; Kneller GR Harmonicity in slow protein dynamics. Chemical Physics 2000, 261, 25–37. [Google Scholar]
- 32.Huang H; Ji H; Li H; Jing Q; Labby KJ; Martasek P; Roman LJ; Poulos TL; Silverman RB Selective monocationic inhibitors of neuronal nitric oxide synthase. Binding mode insights from molecular dynamics simulations. J Am Chem Soc 2012, 134 (28), 11559–72. [DOI] [PMC free article] [PubMed] [Google Scholar]
- 33.Bavi N; Bavi O; Vossoughi M; Naghdabadi R; Hill AP; Martinac B; Jamali Y Nanomechanical properties of MscL alpha helices: A steered molecular dynamics study. Channels (Austin) 2017, 11 (3), 209–223. [DOI] [PMC free article] [PubMed] [Google Scholar]
- 34.Mishra SK; Jernigan RL Protein dynamic communities from elastic network models align closely to the communities defined by molecular dynamics. PLoS One 2018, 13 (6), e0199225. [DOI] [PMC free article] [PubMed] [Google Scholar]
- 35.Salmas RE; Stein M; Yurtsever M; Seeman P; Erol I; Mestanoglu M; Durdagi S The signaling pathway of dopamine D2 receptor (D2R) activation using normal mode analysis (NMA) and the construction of pharmacophore models for D2R ligands. J Biomol Struct Dyn 2017, 35 (9), 2040–2048. [DOI] [PubMed] [Google Scholar]
- 36.Shi S; Zhang S; Zhang Q Insight into binding mechanisms of inhibitors MKP56, MKP73, MKP86, and MKP97 to HIV-1 protease by using molecular dynamics simulation. J Biomol Struct Dyn 2018, 36 (4), 981–992. [DOI] [PubMed] [Google Scholar]
- 37.Su J; Liu X; Zhang S; Yan F; Zhang Q; Chen J A theoretical insight into selectivity of inhibitors toward two domains of bromodomain-containing protein 4 using molecular dynamics simulations. Chem Biol Drug Des 2018, 91 (3), 828–840. [DOI] [PubMed] [Google Scholar]
- 38.Tirion MM Large Amplitude Elastic Motions in Proteins from a Single-Parameter, Atomic Analysis. Phys Rev Lett 1996, 77 (9), 1905–1908. [DOI] [PubMed] [Google Scholar]
- 39.Grant BJ; Rodrigues AP; ElSawy KM; McCammon JA; Caves LS Bio3d: an R package for the comparative analysis of protein structures. Bioinformatics 2006, 22 (21), 2695–6. [DOI] [PubMed] [Google Scholar]
- 40.Beniac DR; Melito PL; Devarennes SL; Hiebert SL; Rabb MJ; Lamboo LL; Jones SM; Booth TF The organisation of Ebola virus reveals a capacity for extensive, modular polyploidy. PLoS One 2012, 7 (1), e29608. [DOI] [PMC free article] [PubMed] [Google Scholar]
- 41.Bharat TA; Noda T; Riches JD; Kraehling V; Kolesnikova L; Becker S; Kawaoka Y; Briggs JA Structural dissection of Ebola virus and its assembly determinants using cryo-electron tomography. Proc Natl Acad Sci U S A 2012, 109 (11), 4275–80. [DOI] [PMC free article] [PubMed] [Google Scholar]
Associated Data
This section collects any data citations, data availability statements, or supplementary materials included in this article.


