

Abstract
This study sought to develop a noninvasive, reliable, clinically relevant, and easy-to-implement mouse model that can be used for investigation of the pathophysiology of PTOA and for preclinical testing of new therapies of PTOA. Accordingly, we have established a closed intraarticular tibial plateau compression loading-induced injury model of PTOA in C57BL/6J mice. In this model, a single application of a defined loading force was applied with an indenter to the tibial plateau of the right knee to create injuries to the synovium, menisci, ligaments, and articular cartilage. The limiting loading force was set at 55 N with the loading speed of 60 N/sec. This loading regimen limits the distance that the indenter would travel into the joint, but still yields substantial compression loading energy to cause significant injuries to the synovium, meniscus, and articular cartilage. The joint injury induced by this loading protocol consistently yielded evidence for key histological hallmarks of PTOA at 5-11 weeks post-injury, including loss of articular cartilage, disorganization of chondrocytes, meniscal hyperplasia and mineralization, osteophyte formation, degenerative remodeling of subchondral bone. These arthritic changes were highly reproducible and of a progressive nature. Because 50% of patients with meniscal and/or ligament injuries without intraarticular fractures developed PTOA over time, this intraarticular tibial plateau compression loading-induced injury model is clinically relevant. In summary, we have developed a noninvasive intraarticular tibial plateau compression loading-induced injury model in the mouse that can be used to investigate the pathophysiology of PTOA and for preclinical testing for new therapies.
Keywords: Posttraumatic osteoarthritis, osteoarthritis, animal model, tibial plateau injury, mice
Introduction
Osteoarthritis (OA) is a painful and debilitating disease of the joints. It is characterized by intra-articular inflammation, resulting in degenerative changes to structures of articular cartilage, peri-articular bone, and subchondral bone. OA is a complex disease process. Early-stage of OA is associated with acute synovial inflammation that activates infiltrated neutrophils/monocytes, synovial macrophages, and synoviocytes to release pro-inflammatory cytokines (e.g., IL-1β, TNF-α) and matrix proteinases (e.g., MMPs, ADAMTSs) to break down matrices of articular cartilage and subchondral bone (1,2). Osteophytes may grow on edges of the joint. Bits of bone or cartilage can break off and float inside the joint, causing further inflammation and damage. Chronic inflammation to the joint also increases the risk of arthrofibrosis (2). OA is the most common degenerative joint disease afflicting ~50 million people in the US alone with an annual healthcare cost estimated to be over 3 billion dollars (3). About 12% of all OA (~12.7 million) are consequences of traumatic injuries to the joint due to persistent direct or indirect joint impact loading to tears in meniscal, ligament, or joint capsule, joint dislocations, intra-articular fractures, and acute trauma to the joint. They are referred to as post-traumatic osteoarthritis (PTOA) (4). Primary OA affects mostly people older than 60 years of age, particularly women (5,6), whereas PTOA can afflict younger and physically active individuals. There is no cure for either PTOA or OA. Thus, the significant impact of this disease on our healthcare, along with our limited knowledge of pathophysiology of the various subtypes of OA/PTOA, necessitates the demand for further research efforts to better define the disease and to understand the processes involved in the disease development. This information is also essential for the development of an effective and safe treatment and prevention strategy.
Current information on OA/PTOA has come from both human clinical and animal preclinical studies. Human clinical studies are essential for investigation of the disease development and progression, but they have several significant limitations, including the variable onset of the symptoms among different human patients, the chronic nature of the disease, and the large variability in the rate of disease progression in human subjects. The restricted ability of investigators to manipulate the disease status in human subjects present additional challenges. Laboratory animal models are invaluable preclinical investigative tools. Both large (such as dog, goat/sheep, horse) and small (such as mouse, rat, rabbit, guinea pig) animal models have been used, but small laboratory animal models have noteworthy advantages for the early preclinical studies, because small animal models are relatively quicker, less expensive, and easier to implement than large animal models. Rodents are the most commonly used small animal species in initial pre-clinical studies. They have significant benefits with respect to costs, time (i.e., time required for developing OA/PTOA is much shorter in rodents than in larger animals), and multiplicity over larger animal models. The mouse models also allow for the use of genetically engineered mice with knockout, knockdowns, knockin mutations, or transgenic expression to directly test the role of a given gene in the disease development (7,8).
Current mouse model of PTOA can generally be divided into two classes: 1) surgically-induced models, and 2) noninvasive models (9). Surgically-induced PTOA models include, but are not limited to, the use of a needle to induce cruciate ligament transection in the closed knee (10), open-surgical transection or injury of ligaments [e.g., anterior cruciate ligament transection (ACLT)] of the knee, medial meniscus (partial or total meniscectomy or medial meniscal tear) to induce joint instability (11-14), or to create full or partial thickness articular cartilage defects (15). Noninvasive models include multiple bouts of compression loading of knee joint (16), cyclic articular cartilage tibial axial compression loading (17), knee compression overload-induced injury (18), or creation of intra-articular tibial plateau fractures (19). Both invasive and noninvasive models have their unique advantages and disadvantages (9). For example, the invasive surgically-induced models increase the risk of infections. Infection-mediated inflammatory changes can confound the results of the experiment. The induction of changes in articular cartilage and subchondral bone structures seen in surgically-induced models also occur very quickly, which may be too rapid to follow the early events of the disease or for measuring early drug treatment effects. Conversely, noninvasive models could have significant effects of age, gender (hormonal status), and mouse strain on the results (20,21). However, noninvasive models can avoid the potential artifacts of surgical intervention and the inflammatory changes or factors due to the surgery or healing, rendering noninvasive models more attractive options than invasive models for investigation of the pathophysiology of PTOA. Many noninvasive models also closely resemble human injuries that lead to PTOA.
The objective of this study was to establish and characterize a convenient, reliable, non-invasive mouse model of PTOA that can be used for investigation of the pathophysiology of PTOA and for preclinical development of effective therapies. We chose the mouse closed intra-articular tibial plateau fracture model (19), because 1) tibial plateau fracture is a common injury of the lower extremity that is seen in the population with a bimodal age distribution (22), 2) the intra-articular tibial plateau fractures resemble one of the most common traumatic insults to the knee joint encountered in PTOA patients in the military and veterans population (22), 3) up to 45% of patients develop PTOA after intraarticular fractures (22), and 4) it is simple to implement and noninvasive. However, our work has identified significant issues with this closed intra-articular tibial plateau fracture model. Specifically, this approach often created complex and multiple fractures, and the severity of these intraarticular fractures varied significantly. The large variation in the fractures greatly diminishes the statistical power of study design with this model. Additionally, the subsequent fracture healing process also impeded the analyses of the various histological and μ-CT hallmarks of PTOA. These issues together have made it difficult to use this model to investigate the pathophysiology of PTOA or to monitor the disease progression. To avoid the potential confounding issues caused by the severe fractures, we have modified the procedure by reducing the applied compression force and energy, such that the loading force would produce significant injuries to the synovium, the meniscus, and the articular cartilage layer, but would not create intraarticular fractures. This modified model yielded highly reproducible results with respect to development and progression of PTOA in the afflicted joint. Because this model caused intraarticular injuries rather than intraarticular fractures, we referred to it as a closed intraarticular tibial plateau compression loading-induced injury model of PTOA.
Methods
Animals.
Twelve weeks-old young adult C57BL/6J mice of both genders were purchased from the Jacksons Laboratory (Bar harbor, Maine, USA). All animal protocols were reviewed and approved by the Animal Care and Use Committee of the Pettis Memorial VA Medical Center and the Animal Care and Use Review Office (ACURO) of US Army Medical Research and Materiel Command of the Department of Defense.
Closed intraarticular tibial plateau compression injury model of PTOA.
Our model was modified from the mouse closed intraarticular tibial plateau fracture model of PTOA developed by Furman et al. (19). Briefly, the intraarticular tibial plateau injury was produced using an “Instron” servohydraulic mechanical tester (Norwood, MA) with the animal under inhalation anesthesia (3% isoflurane, 0.5 L/min oxygen delivered through a Bains circuit). The right knee of 12-week-old C57BL/6J mouse was positioned on an apparatus attached to the load cell of the Instron 8841 servohydraulic tester. To injure tissues at the tibial plateau, the excursion of a blunt indenter blade was set on the top of the tibial plateau. An impact force (controlled by computer using Instron “FastTrack 2” software) was applied under a defined force of 55 N at a speed of 60 N/sec to the tibial plateau of the mouse as the leg of the animal is positioned in a custom-made cradle support, as shown in Fig. 1. Our cradle is smaller than that used by Furman et al. (19), allowing us to bend the knee joint to expose the tibial plateau for the compression loading. This rapid impact yielded substantial compression loading energy that was sufficient to create significant injuries to the synovium, the meniscus, and the articular cartilage layer, but did not create fractures, at the tibial plateau. X-ray analysis of the knee immediately after the procedure confirmed no fractures to tibial plateau or to the bone of femoral condyle.
Figure 1.

A schematic representation of the loading model that would create an intraarticular tibial plateau compression loading-induced injury along with a picture of the indenter and the custom-made cradle to hold the right knee joint of a mouse.
At the time of sacrifice, both the injured right knee joint and the contralateral uninjured left joint, including the distal femur and the proximal tibia, were removed from each animal. The bones and muscles were fixed with 10% cold neutral buffered formalin for 4–5 days and rinsed with PBS. The bones were first subjected to μ-CT analyses for subchondral trabecular bone parameters. After the μ-CT analyses, the knee joints were decalcified, embedded in paraffin wax, sectioned longitudinally, and subjected to histology analysis.
μ-CT analysis of periarticular and subchondral bone mass and structure.
The periarticular and subchondral trabecular bone near the tibial plateau was analyzed by micro-computed tomography (μCT) using a Scanco vivaCT40 μCT scanner (Scanco Medical, Brüttisellen, Switzerland). The trabecular masks were defined in a semiautomatic manner, starting from the outer mask of the proximal tibial end and application of 15 erosion cycles to ensure that no cortex was included in the measurement. Scans were performed at 55 keV, and the analysis was conducted using density thresholds segmented at 220–570 mg/cm3 hydroxyapaptite (HA) for the lower density trabecular bone and 570-1,000 mg/cm3 HA for the higher density cortical bone. Images at each tomography projection were acquired at 55 kVp X-ray energy and 100 ms integration time.
Because we were interested in changes in the periarticular and subchondral trabecular bone, we targeted the region of interest (ROI) at periarticular and subchondral areas. Accordingly, we divided the periarticular and subchondral bone areas within the proximal tibial end into three relative zones for measurement: 1) the articular cartilage layer/periarticular zone – covering the area from the apex of tibial plateau to a distance 15% from the apex to the growth plate; 2) the articular cartilage layer/periarticular and some subchondral zone –covering the areas from the apex to the 30% distance from the apex to growth plate; and 3) the entire epiphyseal zone – covering the area from the apex to the growth plate. Each scan consisted of 0.8 mm in thickness.
Histology.
Briefly, the injured right joint and contralateral uninjured left joint (containing both distal femoral end and proximal tibial ends) of each mouse were removed at sacrifice. Muscles and other soft-tissues were cleaned off, and the joints were fixed in formalin and stored in PBS with 0.01% sodium azide. After μ-CT analyses, the joints were cleaned, decalcified, dehydrated, and embedded in paraffin by standard procedures. Serial 5-μm sagittal thin sections were cut from the medial side. Multiple serial sections corresponding to the injured tibial plateau region were deparaffinized, followed by graded ethanol dehydration and stained with Safranin O/Fast Green for cartilage, Alcian Blue/Fast Red for chondrocytes, or Orange G/hematoxylin for all other cell and tissue types. To evaluate the loss (or thinning) of articular cartilage during development of PTOA, we sought to measure the relative thickness of the articular cartilage layer at the afflicted joint, particularly around the impacted tibial plateau on three to eight serial sections of each joint. However, it has been quite challenging to determine the relative thickness of articular cartilage accurately with the OsteoMeasure system, because it is very difficult to determine linear distance from one point to the other with this system. However, the system allows measurement of circular area. Accordingly, we drew a circle from the edge of the articular cartilage layer to the edge of the periarticular bone of the site-of-interest and then measured the total area of the circle using the OsteoMeasure system equipped with a digitizing tablet (Osteometrics, Atlanta, GA). The determined area was then converted into diameter using an Online Circle area-to-diameter calculator software at www.sensorsone.com website. The obtained diameter of this circle is the direct linear distance between the edge of the articular cartilage layer to the periarticular bone, or the thickness of the articular cartilage, at this particular site-of-measurement. We measured several sites along the articular cartilage layer at the site of insult under a microscope to obtain the average thickness of the articular cartilage.
A histology-based modified Mankin OA disease scoring system.
Most OA studies have relied on quasi-quantitative histology-based disease grading systems, such as the Mankin OA disease score (23) or the OARSI OA Cartilage Histopathology Assessment System (24), to assess the relative severity of the disease. To have a quantitative measurement of the relative severity of PTOA/OA in our model, we have also developed a histology-based scoring system that resembles the Mankin OA scoring system. This scoring system is a 0-15 points system based collectively on four histology-based parameters: 1) the smoothlessness of the articular cartilage surface (0 to 4), 2) the loss of gliding and intermediate zones (0 to 4); 3) the uniformity of chondrocyte rows (0 to 4), and 4) the relative size of osteophyte area (0 to 3) (Table 1). The scoring was performed on serial slices by the same investigator who was “blinded” to the group identity of the samples. We found that this scoring system was reproducible.
Table 1:
Histologic criteria used in our modified Mankin OA disease scoring system.
| Histologic criteria |
0 | 1 | 2 | 3 | 4 |
|---|---|---|---|---|---|
| Smoothless of articular cartilage surface | Smooth surface | Wavy, irregular surface with hypercellularity | Thickening of cartilage layer | Hypocellularity with erosion to tidemark | Erosion beyond tidemark |
| Loss of gliding and intermediate zones | No loss | <10% loss | 10-25% loss | 25-50% loss | >50% loss |
| Uniformity of chondrocyte rows | Uniformed rows | Hypercellularity, small clustering of cells | Clustering of chondrocytes | Disorganization of chondrocyte columns | Disorganization and loss of chondrocyte rows |
| Size of osteophyte | None present | Small area | Medium area | Large area |
Statistical analysis.
Results are shown as mean ± SEM. Statistical significance was analyzed with two-tailed Student’s t test. Statistical significance of studies with two or more variables was analyzed with one-way ANOVA followed by the Tukey post-hoc test using the Systat11 software (Systat Inc., Chicago, IL, USA). The difference was considered significant when p<0.05.
Results
A non-invasive mouse model of PTOA/OA.
To set up a mouse model of PTOA/OA for use in our laboratory, we initially sought to establish the mouse closed intra-articular tibial plateau fracture model of PTOA developed by Furman et al. (19). We followed the protocol described by Furman et al. and applied a loading force of 55 N at a rate of 20 N/sec with the indenter displacement limit of −2 to −6 mm to the tibial plateau of the right knee of 12-weeks old C57BL/6J mice. As previously reported (19), this loading scheme had reproducibly produced fractures at the tibial plateau as shown by X-ray. However, the severity, the type (i.e., simple, comminuted, or complex fractures), the number (single or multiple), and the location of fractures were highly variable and uncontrollable (data not shown). The variable fractures led to drastic reduction in statistical power of our experimental design. In addition, the subsequent fracture healing process was found to greatly confound the μ-CT and histology measurements. For example, Fig. 2A, which shows the anterior, medial, posterior, and lateral views of the μ-CT three-dimensional reconstruction of the bony structure of a fractured right knee joint created by this approach and the corresponding contralateral unfractured left knee joint of a representative mouse at 8 weeks post-trauma clearly demonstrates that there was massive ectopic bone and osteophytes formation near the fractured sites. This large amount of ectopic bone mass prevented the accurate μ-CT measurements of the amounts and structure of periarticular and subchondral bones (data not shown). Safranin O staining of acidic proteoglycan at the tibial plateau (Fig. 2B) also revealed substantial and highly variable loss in acidic proteoglycan at the articular cartilage layer (due to loss of cartilage and bony tissues) at fracture sites. These significant limitations together have precluded the accurate and reproducible quantitation of changes in the articular cartilage and subchondral bone. Thus, the severity and complexity of the highly variable tibial plateau fractures confounded our ability to analyze the various histological and μ-CT hallmarks of PTOA/OA.
Figure 2. Evidence that the closed intraarticular tibial plateau fracture model caused substantial ectopic and osteophyte formation after 8 weeks post-fracture.

A: The anterior, medial, posterior, and lateral views of the μ-CT three-dimensional reconstruction of the fractured right knee (upper panel) and the contralateral unfractured left knee (lower panel) of a representative mouse at 8 weeks after the application of a compressive loading force of 55 N at 20 N/sec with a 3.2 mm indenter displacement limit. B: The Safranin-Orange staining of uninjured left knee joint showing normal articular cartilage layer (left, scale bar = 1 mm), and the injured right knee joint showing substantial loss of the articular cartilage layer at the tibial plateau and femoral condyle surfaces at 8 weeks post-trauma (right, scale bar = 0.1 mm).
To search for an alternative way to apply a similar approach to establish a mouse model of PTOA that would avoid the potential problems associated with the variable fractures, we modified the loading protocol, such that the compression loading caused significant physical injuries to the tissues but without bony fractures at the tibial plateau. We found that increasing the speed of the loading force from 20 N/sec to 60 N/sec with the limiting force of 55 N would decrease the indenter displacement distance to an average of 1.7 mm and thereby limited the overall distance that the indenter traveled into the joint. This would yield substantial compression loading impact on the synovium, the meniscus, and the articular cartilage, but with much less impact on subchondral bone. Moreover, the greater loading speed (60 N/sec as opposed to 20 N/sec) increased the acceleration of the compression load that yielded a greater and highly focused impact energy to the tibial plateau to injure the soft tissues, including the synovium, meniscus, tendon, and cartilage at the tibial plateau, but it would not create intraarticular fractures. Because this model created intraarticular injuries rather than fractures, we referred it to as a closed intraarticular tibial plateau compression loading-induced injuries model of PTOA.
Intraarticular tibial plateau compression loading injury did not appear to cause significant pain and stress to the mouse.
To determine whether the intraarticular tibial plateau compression loading injury would adversely affect the mobility of the mouse or cause the injured mouse to favor the uninjured mouse during walking, we made qualitative observational assessments of several behavioral and physical parameters of pain in 16 experimental mice immediately after the tibial plateau compression injury protocol and 8 uninjured control mice daily for one week and then once weekly for five weeks. The physical parameters that we observed include evidence for: 1) for edema, inflammation, abnormal discharge or severe bleeding at the injured knee joint; 2) dehydration by examining the skin elasticity; and 3) abnormal walking or running pattern that may indicate the favoring of the uninjured limb. General behavior parameters include: 1) whether the animal was lethargic in response to a stimuli; 2) whether the animal demonstrated ataxia (wobbly gait) during movement; 3) whether the animal showed abnormal, hunched posture combined with unwillingness to move; 4) whether the animal lacked grooming, as evidenced by a matted appearance of the fur that produces a “scruffy” appearance; 5) whether the animals displaced overly aggressive behavior beyond what would be considered normal defensive tendencies to handling; and/or 6) whether the animal produced abnormal vocalizations (i.e., “squawking”). We did not detect any discernable evidence that the experimental injured mice displaced visible behavioral and physical signs indicative of discomfort and pain when compared to uninjured control mice.
One of the telltale physical signs of mice who were in pain and distress is the significant weight loss, since mice in distress and pain would lose their appetite that lead to weight loss over time. Accordingly, we also measured the body weight of these 16 experimental mice and the 8 uninjured control mice from the age of 10 weeks of age to 21 weeks of age. The intraarticular tibial plateau injury was created when the mice were 10 weeks of age. As shown in Fig. 3, there was no any differences in the body weight between the experimental mice and the uninjured control mice over the observational period. This would strongly suggest that the intraarticular tibial plateau injury did not cause significant pain and distress to the mice. We also did not find any evidence for an impaired mobility or favoring of the uninjured contralateral limb in any of the operated mice.
Figure 3. The intraarticular tibial plateau compression loading-induced injury did not cause significant loss in body weight in the experimental mice.

The intraarticular tibial plateau compression loading-induced injury was created on the right knee of 16 male the experimental mice at 10 weeks of age. The body weight of these experimental mice, along with 8 uninjured male control mice of the same age was monitored every 3 to 5 weeks for 11 weeks. There was no significant difference in the weight gain between the group of experimental mice and the group of uninjured control mice.
Characterization of the mouse closed intraarticular tibial plateau compression loading-induced injuries model of PTOA.
In our model, the compression load has consistently and reproducibly produced clear evidence for several well-known histological hallmarks of OA/PTOA at the impacted tibial plateau after 5 weeks post-injury. For example, longitudinal sections of the tibial joint at 125 μm laterally from the medial edge of the knee joint of the injured right knee and the contralateral uninjured left joint stained with Safranin Orange showed significant erosion of articular cartilage at the tibial plateau surface of the injured joint compared to the contralateral uninjured left joint at 5 weeks post-trauma (Fig. 4A). Under higher magnifications, both the gliding zone (zone 1) and the transitional zone (zone 2) of the articular cartilage layer were eroded away and not readily identifiable. The calcified cartilage zone (zone 4) of the articular cartilage of the injured joint also became disorganized. The destruction of the gliding and transitional zones (zones 1 and 2) and disorganization of the radial zone (zones 3) and calcified cartilage zone (zone 4) was confirmed by Alcian Blue staining with Fast Red counterstain on serial sections (Fig. 4B). The subchondral bone remodeling also appeared to be increased, as reflected by the highly irregular shape of the underlying subchondral bones. We then estimated the average thickness of the articular cartilage layer at areas around the impact site on the injured tibial plateau compared to that of the same areas of contralateral uninjured tibial plateau (Fig. 4C). The average thickness of the articular cartilage layer of the injured joint has lost ~0.045 μm at 5 weeks post-injury and ~0.06 μm at 11 weeks post-injury compared to that of corresponding contralateral uninjured left joints, indicating a progressive loss of articular cartilage from 5 weeks to 11 weeks post-injury. We found no significant differences between males and females in the injury-induced reduction in the average articular cartilage thickness, the increase in the meniscal area and the increase in the meniscal mineralized nodule area, after the results were normalized against each corresponding contralateral uninjured joint (Fig. 5), suggesting that there were no gender differences in the responses to the injury.
Figure 4. Safranin-orange/fast green (A) and Alcian blue/orange G staining (B) of the articular cartilage layer and its four zones of articular cartilage of a representative injured right knee joint and its corresponding contralateral uninjured left knee joint.

A: The closed intraarticular tibial plateau compression loading-induced injuries at 5 weeks post-injury caused substantial loss of articular cartilage (top panel, indicated by the arrow heads) and disorganization of four zones of articular cartilage layer (bottom panel). 1, 2, 3, and 4 indicate the gliding zone, transitional zone, radial zone, and calcified cartilage zone, respectively. T = the “tidemark”; SB = subchondral bone. B: Alcian blue/orange G staining of chondrocytes confirmed disorganization of the four zones at the articular layer of the injured joint. The scale line represents 100 μm. C: Comparison of the loss in the average articular cartilage thickness at the injured sites of the impact right knee compared to that at the corresponding sites of the contralateral uninjured left knee joints at 5 weeks or 11 weeks post-injury supports the conclusion that there was a progressive loss of articular cartilage at the injured joint. N= 14 to 17 knee joints per group. * P<0.05 compared to the uninjured left knee joint. P<0.05 denotes the statistical significance between the loss in the average articular cartilage thickness at 5 weeks post-injury and that at 11 weeks post-injury.
Figure 5. Evidence that there were no significant differences in the response in the loss of average articular cartilage thickness, the increase in the average meniscus area (meniscal hypertrophy), and the average area of the mineralized nodules within the meniscus (right) of the injured tibial plateau when compared to those of the contralateral uninjured tibial plateau after 5 weeks of the intraarticular compression loading-induced injury between male and female mice.

Left panel shows the loss in the average thickness of articular cartilage layer on the injured right tibial plateau of 8 male mice and 4 female mice when compared to corresponding uninjured contralateral left tibial plateau. Right panel shows the average area of the meniscus and the area of the mineralized nodule within the meniscus of the injured right tibial plateau of 9 males and 4 females when compared to corresponding uninjured contralateral left tibial plateau. Each parameter (i.e., the thickness of articular cartilage layer, meniscus area, and meniscal mineralized nodule area) was performed on three to eight serial slides to obtain the average values for each animal. Results are shown as mean±SEM. N.S. = not significant, i.e., P>0.05 by Student’s t-test.
The formation of osteophytes, which are fibrocartilage-capped bony outgrowths originating from the periosteum, is often associated with the onset of arthritis. Thus, we next evaluated whether this model would also induce osteophyte formation at the injured joints. Three-dimensional μ-CT reconstruction of the bony structures at the knee joints indeed shows that substantial amounts of osteophytes were formed at the edge of the injured right joint, but not on the contralateral uninjured left joint (Fig. 6A). Additionally, substantial amounts of Safranin Orange-stained (for fibrocartilage) osteophyte tissues were found at the edge of the periosteum surrounding the injured tibial plateau on longitudinal thin sections at the injured site (Fig. 6B). Serial slides were also stained with Alcian blue/Orange G stain to identify both cartilage and bony tissues within active osteophytes (Fig. 6C), which confirmed the presence of substantial amounts of osteophyte tissues at the edge of the tibial joints. These findings indicate that the intraarticular tibial plateau injuries caused osteophyte formation at as early as 5 weeks post-injury.
Figure 6. The closed intraarticular tibial plateau compression load-induced injuries led to formation of osteophytes.

A: The anterolaterial, lateral, and medial view of three-dimensional reconstruction of the bony structures of a representative injured right knee joint and its corresponding contralateral uninjured left knee joint at 5 weeks post-injury. White arrows indicate that substantial amounts of osteophytes were formed at the periosteum of the injured knee joint. The scale bar = 1 mm. B: Safranin Orange/fast green staining revealed that cartilage-enriched osteophytes (indicated by the black arrows) were found at the edge of the injured tibial plateau. The green arrow indicates the site of the injury. C: The alcian blue/orange G staining of the injured right knee joint. The right micrograph is the enlarge area of the left micrograph. The orange arrows depict the areas containing osteophytes.
Meniscus is made up of fibroelastic cartilage. Abnormal cell arrangements within the menisci included both regional hypercellularity and hypocellularity along with hypertrophy and cell clusters are often seen in OA joints of mice (25). Fig. 7A shows that the chondrocytes within the fibroelastic cartilage of the meniscus of the injured joint at 5 weeks after the intra-articular injury became highly hypercellular when compared to the meniscus of the contralateral uninjured knee. The intraarticular tibial plateau injury not only increased the total tissue area, but also the area of hypertrophic chondrocytes within the meniscus (Fig. 7B). The increase in the hypertrophic chondrocyte area, after normalized against the total tissue area, was increased 4- to 5-fold of that in the contralateral uninjured meniscus (Fig. 7C). It seems that cellular factors responsible for the increased cellularity in hyaline cartilage also enhanced hypercellularity in fibroelastic cartilage of meniscus.
Figure 7. Injury in the intra-articular tibial plateau increased chondrocyte hypercellularity of the fibroelastic cartilage and calcification of the meniscus.

A: Longitudinal thin sections (5 μm) of the femoral-tibial junction, including the meniscus, were stained with alcian blue with orange G counterstain. GAG-proteoglycan of cartilage is stained in blue/purple color, and bone is stained in orange to red color. Arrows indicates the hypertropic chondrocyte areas in the injured meniscus. B: The hypertrophic chondrocyte and total tissue areas of the meniscus of both the injured right knee joint as well as the control contralateral intact knee joint were determined with the aid of an osteomeasure software. C: The comparison of the relative ratio of the hypertrophic chondrocyte area to total tissue area of meniscus of the injured joints with that of contralateral uninjured joint. Results are shown as mean±SEM, n=8 per group. *P<0.05; ***P<0.001, by two-tailed Student’s t-test.
Most studies have used a histology-based OA scoring system, such as Mankin OA disease score (23) or OARSI OA Cartilage Histopathology Assessment System (24), to obtain semi-quantitative assessment of the relative severity of POTA/OA. We also developed a histology-based modified Mankin OA scoring system, which was based on the various histological parameters that we measured in this study (Table 1). Based on this 15-points OA disease scoring system, the average score of the relative severity at 5 weeks after the injury was determined to be ~8, which increased to ~11 at 11 weeks post-injury (Fig. 8), indicating that the intraarticular tibial plateau insult induced PTOA/OA slowly and progressively.
Figure 8. Comparison of the relative severity of PTOA developed after the closed intraarticular tibial plateau compression loading-induced injury at 5 weeks post-injury and at 11-weeks post-injury.
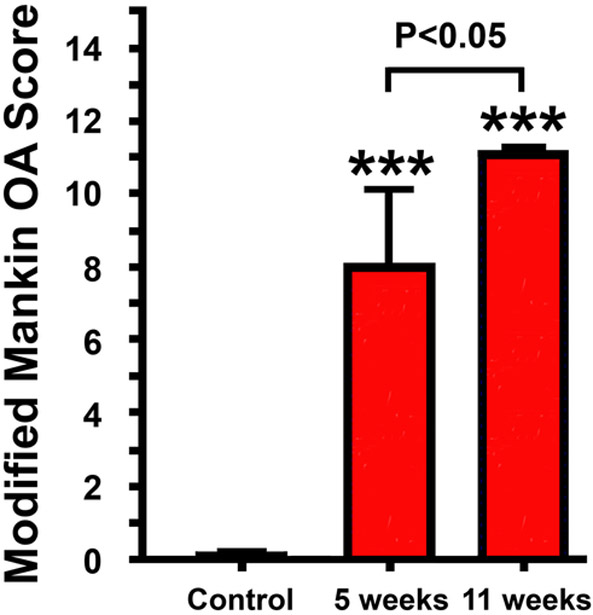
The relative severity of PTOA was assessed by a 15 points-scale histology-based modified Mankin OA scoring system. Results are shown as Mean ± SEM. N = 17 for the control group, N= 17 for the 5 weeks group, and N = 13 for the 11 weeks group. Comparison between each treatment group with the control was done with two-tailed Student’s t-test. Comparison among the two treatment groups was done with one-way ANOVA with the Tukey post-hoc test.
Effect of the closed intraarticular tibial plateau compression loading-induced injury on the bone parameters of subchondral bones.
PTOA/OA caused inflammation-induced localized deterioration and abnormal remodeling of periarticular and subchondral bone structures (26). Thus, we next performed μ-CT to assess the effect of the intraarticular tibial plateau compression load-induced injury on the bone density and structure of periarticular and subchondral bones. As an attempt to separate periarticular, “proximal” subchondral, and “distal” subchondral bone, we divided the proximal tibial epiphysis into three regions-of-interest (ROI) for measurements: 1) 100% distance between the apex of the articular cartilage surface of the tibial plateau and the growth plate of the tibia (periarticular and all subchondral bone); 2) 30% distance between the apex and growth plate (periarticular bone plus “proximal” subchondral bone); and 3) 15% distance between the apex and growth plate (predominantly periarticular bone). Trabecular bone measurements were performed with the density thresholds of 220–570 mg/cm3 HA. As shown in Table 2, the intraarticular compression loading-induced injury caused significant loss of trabecular bone mass and deterioration of bone structures at the entire epiphysis (i.e., from the apex to 100% distance to the growth plate) at 5 weeks post-injury, in that the injured joints reduced BMD by 8% BMD, Connectivity-Density by 39%, and Tb.N by 25%, along with a 39% increase in Tb.Sp, compared to respective contralateral uninjured left joints. These reductions appeared to be more significant in the region covering from mostly periarticular bone (from apex to 15% distance to the growth plate) and in the region containing both periarticular and “proximal” subchondral bone (from apex to 30% distance to the growth plate). Because we were interested in both periarticular and “proximal” subchondral bones, we subsequently focused on the region covering from apex of tibial plateau to 30% distance to the growth plate, which we believe to contain predominantly periarticular bone and “proximal” subchondral bone. We also measured cortical bone mass at these regions using the thresholds of 570-1,000 mg/cm3 HA and found no significant differences between the injured joint and the contralateral uninjured joint (data not shown).
Table 2.
Comparison of measurements of μ-CT parameters of periarticular and subchondral bone density and structure at three compartments of the epiphyseal region of the proximal tibial plateau of the right injured joints with those of the corresponding contralateral uninjured left joints. #
| Apex of tibial plateau to 15% distance to the growth plate (predominantly periarticular bone) |
Apex of tibial plateau to 30% distance to the growth plate (periarticular + subchondral bones) |
Apex of tibial plateau to 100% distance to the growth plate (all bone inside the epiphyseal) |
||||
|---|---|---|---|---|---|---|
| Uninjured left joint (n=9) |
Injured right joint (n=9) |
Uninjured left joint (n=9) |
Injured right joint (n=9) |
Uninjured left joint (n=9) |
Injured right joint (n=9) |
|
| BV/TV | 0.043±0.007 | 0.021±0.005** (−51.2%)## |
0.288±0.006 | 0.293±0.007 (+1.7%) |
0.057±0.007 | 0.042±0.007 (−26.3%) |
| BMD, mg/cm3 | 338.040±13.750 | 304.991±6.63* (−9.8%) |
449.64±14.09 | 366.30±15.23*** (−18.5%) |
426.129±12.495 | 390.151±13.136* (−8.4%) |
| Conn-Density, #/mm3 | 193.056±28.94 | 58.717±15.75*** (−69.6%) |
116.299±6.479 | 83.997±6.145*** (−27.8%) |
204.119±25.804 | 125.188±24.228* (−38.7%) |
| BS/BV, mm−1 | 75.319±3.51 | 95.037±8.06* (+26.2%) |
30.748±0.754 | 25.460±0.778*** (−17.2%) |
83.611±3.904 | 86.247±3.719 (+3.2%) |
| Tb.N, #/mm | 1.389±0.167 | 0.666±0.104*** (−52.1%) |
4.342±0.431 | 3.688±0.129*** (−15.1%) |
2.094±0.176 | 1.564±0.184* (−25.3%) |
| Tb.Th, mm | 0.027±0.001 | 0.022±0.002* (−18.5%) |
0.065±0.002 | 0.079±0.002*** (+21.5%) |
0.024±0.001 | 0.024±0.001 (0%) |
| Tb.Sp, mm | 0.797±0.112 | 1.740±0.239** (+118.3%) |
0.167±0.006 | 0.195±0.008 (+16.8%) |
0.480±0.042 | 0.667±0.058* (+39.0%) |
Measured with density thresholds of 220–570 mg/cm3 hydroxyapaptite.
Relative percentage change compared to each corresponding group of contralateral uninjured left joints.
Microscopically, trabecular bone structures, including those in the proximal subchondral bone, consist of an intricate network of rod-like and plate-like trabeculae, which undergo dynamic bone remodeling to maintain their microstructural and mechanical integrity (27). Recent studies suggested that erosion and alteration of the subchondral bone structure induced during the initiation and progression of OA/PTOA was characterized by the substantial loss of trabecular rods and the thickening of trabecular plates in subchondral bones and that these changes preceded cartilage degeneration (28). To evaluate the rod vs. plate structure relationship within the subchondral bone, we measured the Structure Model Index (SMI) of the subchondral bone of the injured right tibial plateau and compared it with that of the uninjured left tibial plateau of groups of 6 mice. The score of 0 indicates that all trabecular bone structures are of parallel plates; while a score of 3 indicates that all trabecular bone structures are of cylindrical rods. Fig. 9 shows that the subchondral bone structure of the uninjured contralateral knee joints had an average SMI of 1.81±0.19, whereas the average SMI of the injured subchondral bone was 1.28±0.25 (left panel), which represents a decrease of 0.539±0.169 in SMI of subchondral bone of the injured joint (middle panel), or a 32% reduction in the subchondral rod structure (right panel) compared with the corresponding uninjured left joint. A previous study reports a strong association between the initiation and progression of OA/PTOA and the substantial loss of trabecular rod structure in subchondral bone (28). Therefore, these findings strongly indicate that the knee joint injured by our defined compression load has developed PTOA/OA.
Figure 9. Intraarticular tibial plateau compression loading-induced injury decreased Structural Model Index (SMI).

A: Comparison of the SMI of trabecular bone within the epiphysis between the injured right joints and the uninjured contralateral left joints. Reduction in SMI suggests a shift in the structure of subchondral trabeculae in the epiphysis of the injured right joint from the more rod-like structure to the more sheet-like structure. B: The difference in SMI between the contralateral uninjured left tibial plateau and the injured right tibial plateau. C: The relative percentage change in SMI of the injured right tibial plateau to the contralateral uninjured left tibial plateau. Results are shown as mean ± SEM with N=6 per group. Statistical significance was done with two-tailed Student’s t-test.
Discussion
The objective of this study was to establish a noninvasive, reliable, clinically relevant, and easy-to-implement mouse model of PTOA/OA for use in our future investigation of the pathogenesis and pathophysiology of PTOA/OA and in preclinical testing of therapeutic treatments for PTOA/OA. In this regard, we have accomplished this objective by successfully developing a closed intraarticular tibial plateau compression loading-induced injury model in the mouse that can be used for investigation of PTOA and/or OA. Accordingly, the intraarticular injury to the synovium, the meniscus, and the articular cartilage induced by the tibial plateau compression loading led to the subsequent progressive development of PTOA. This conclusion is based on the presence of several well-known hallmark characteristics of OA in the impacted joint, such as erosion of the articular cartilage layer, deterioration of periarticular and subchondral bone structures, formation of osteophytes around the edge of the injured joint, enhanced hypertrophy and calcification of fibroelastic cartilage of menisci, and loss of trabecular rod and thickening of trabecular plate in subchondral bone. This mouse model is highly reproducible, and evidence for PTOA with similar severity was observed in every injured joint. The presence of PTOA in the injured joint was also confirmed by a histology-based modified Mankin OA scoring system. We chose the tibial plateau site for the site of injury in our model, because this site has thicker articular cartilage than do other joints (29) and because tibial plateau is one of the most common sites of traumatic insults at lower extremity of PTOA patients in the military and veterans populations (22). We also believe that the compression loading-induced injury approach is the most convenient, direct, and noninvasive means to induce substantial injuries to the tibial plateau and to generate PTOA/OA.
Our intraarticular tibial plateau compression loading-induced injury model of PTOA has several noteworthy features. First, this model is noninvasive and does not involve surgically opening of the joint. This would not only allow preservation of the integrity of the synovial environment and avoidance of manipulation of the articular tissues, but also would avoid any issues concerning potential infection due to the surgical procedure. Second, the mice after the procedure did not displace any observable evidence for an impaired mobility or the favoring of the uninjured contralateral limb (e.g., gait) based on our weekly observations of several physical and behavioral parameters as listed in the Methods section. Our μ-CT and histology analyses reveal that there was no evidence for degenerative changes in articular cartilage and subchondral bone structure on the contralateral knee joints. These findings together indicate that the intraarticular compression loading on the tibial plateau did not affect the contralateral joint via systemic effects or altered gait. Similarly, the intraarticular tibial plateau fractures model developed by Furman et al. (19), which is similar in many aspects to our model, also showed no obvious adverse effects on the contralateral joint. Consequently, the lack of an effect of the intraarticular tibial plateau injury procedure on the contralateral knee joint allows us to employ the contralateral uninjured knee joint as the internal control for the injured joint of individual mouse. The use of contralateral joints as internal paired controls would not only avoid or reduce the inter-animal variations but also would reduce the number of animals needed for each experiment. Third, the duration for the onset of PTOA development in this intraarticular compression loading appears to be shorter than other noninvasive models. Accordingly, we were able to detect clear histological and bone density evidence for PTOA as early as 5 weeks post-injury; whereas other noninvasive models require at least 8 weeks for the PTOA to develop (19). Importantly, this shorter duration for the onset of the disease does not appear to be too rapid to preclude its use in the investigations of early events of the PTOA progression.
During the past few years, several noninvasive models of PTOA that utilize the compression loading approach to injure relevant tissues or to cause intra-articular fractures at the knee joint were developed. For example, Poulet et al. (16) developed a mouse repetitive axial loading at the knee model of PTOA, in which repetitive loading of 40 cycles at 9 N is applied to the knee joint of a mouse six times over a period of 2 weeks. This loading regimen induced localized articular cartilage lesions at the lateral femur, which eventually evolved into PTOA/OA. A similar repetitive tibial compression axial loading model of PTOA was developed by De Souza et al. (17), in which repetitive cyclic axial compressive loads of 5 to 13 N consisting of 1,200 cycles per day, 4 cycles per second, for 5 days per week for 1 to 6 weeks, is applied to the lower leg of the mouse through the ankle and knee joints with loads transmitted through natural joint articulations. Mice subjected to this model eventually developed PTOA/OA in the loaded knee joint. Our tibial plateau compression loading-induced injury model differs from these repetitive joint loading models in four major ways. First, our model involves only a single application of the loading force; whereas the repetitive joint loading models require multiple repeated compression loadings, often for several weeks, to produce PTOA/OA. A single loading application is much more convenient and less variable to implement than do repeat loadings on multiple settings. Second, our model utilizes an indenter with a narrow point of contact that allows the delivery of the loading force and energy to a relatively small and defined localized area, and as a result, articular cartilage lesions would occur also in relatively localized and defined areas of the tibial plateau. Conversely, the repetitive knee loading protocols employ a loading cap that distributes the loading force and energy to wide and variable regions, resulting in articular cartilage lesions occurring in wide and variable areas of both femur and tibia. The wide and highly variable areas of lesions render the analyses of the progression of PTOA/OA more difficult in the repetitive knee loading models. Third, the repetitive loading regimen also yielded substantial repetitive axial loading (bending) of tibia, which has been shown to increase cortical bone formation and alter trabecular structures (17), and which could be an additional uncontrollable variable that could interfere with the analyses of PTOA progression and disease status. Finally, because the repetitive joint loading models also produce substantial loading force and strains on the ankle of the animals, which could create injuries to the ankle of the animal and thereby may confound the analysis of the progression of PTOA.
In addition to the repetitive knee loading models, a murine model of an anterior cruciate ligament rupture through a single tibial compression overload was developed by Christiansen et al. (18). In this model, a continuous loading force of 12 N with a loading rate of 1 mm/s was applied to the knee joint until it reaches the point of the rupture of the cruciate ligaments associated with cartilage degradation with moderate to severe injury, knee dislocation, avulsion fractures, and eventually PTOA. A major difference between this model and ours is that animals with cruciate ligaments rupture would substantially affect the mobility of the injured limb, which would preclude the use of the contralateral limb as respective internal control for intrinsic differences among the experimental mice.
Of the available compression loading of the knee models of PTOA, our model in many aspects is very similar to the closed intraarticular tibial plateau fracture model of PTOA developed by Furman et al. (19). However, there is a major and important difference between our model and their model, in that the loading rate of the compression force applied to the tibial plateau in our model was three times faster (i.e., 60 N/sec vs. 20 N/sec) than that in their tibial plateau fracture model. In this regard, the rate of loading and the energy of the loading force are important determining factors of whether intraarticular fractures would occur. When a load is applied slowly, fluid movement and realignment of the macromolecular framework of the joint would allow the meniscus and articular cartilage to deform but not to be injured. When loading occurs rapidly as in our model, the macromolecular framework can be ruptured, damaging cartilage cells. Accordingly, the loading regimen used in our model would likely cause more significant injuries to the synovium, the meniscus, and the articular cartilage than the intraarticular fracture model. In addition, the three-fold increase in the loading speed in our model would shorten the time for the indenter to reach the limiting loading force by also 3-fold (e.g., 0.92 sec vs. 2.75 sec). Accordingly, the shorter time needed to reach the limiting loading force in our model would also reduce the traveling distance of the indenter into the knee joint, which would then reduce the chance for the loading energy to damage and fracture the underlying bone at the loading site. As a result, while the intraarticular fracture model consistently yielded variable intraarticular fractures, our model does not cause any detectable fractures. While it is true that intraarticular fractures are a key risk factor for PTOA (22), we should note that 50% of patients with meniscus or ligament injuries but without intraarticular fractures also developed PTOA over time (30,31). Therefore, we believe that our intraarticular tibial plateau compression loading-induced injury model is also clinically relevant to human PTOA. A major reason for us to use the intraarticular tibial plateau compression loading-induced injury over the intraarticular fracture model is because the presence of multiple and complex intraarticular fractures and their subsequent healing process had drastically affected our ability to accurately determine the μ-CT and histological parameters of the arthritic changes in articular cartilage and subchondral bone. For this reason, we believe that the intraarticular tibial plateau injury model might have an important advantage over the intraarticular tibial plateau fracture model.
Finally, it has been established that females are more susceptible to OA development and present with more severe OA than males (32,33). This might be related to hormonal factors, though evidence of a hormonal link is conflicting (34). On the other hand, an association between patient’s gender and PTOA prevalence has not been thoroughly investigated. A recent study indicates that while there was a significant rise in the prevalence of incidence of PTOA of the knee in the United States military, gender was not a significant determining factor for the prevalence of PTOA (35). Furthermore, our pilot experiment in this study has suggested that there were no gender differences in the PTOA responses to the intraarticular tibial plateau injury. Nevertheless, it is an important issue, and much additional work is required to resolve the issue as to whether gender or sex hormones are key determining risk factors for PTOA.
In summary, we have developed a non-invasive closed intraarticular tibial plateau compression loading-induced injury model of PTOA in the mouse. In this model, the impacted knee joints showed clear hallmark histologic and μ-CT evidence of PTOA, such as erosion of articular cartilage, formation of osteocytes, degenerative remodeling of periarticular and subchondral bones, meniscal hyperplasia and hypocellularity, calcification of chondrocytes within meniscus, as well as loss of trabecular rod and the thickening of trabecular plate in subchondral bones. These arthritic changes were of progressive nature and could be detected in the impacted joint as early as 5 weeks post-injury. Importantly, this model of PTOA is highly reproducible. In conclusion, we believe this noninvasive mouse model of PTOA could be a useful small animal model for preclinical investigation of PTOA and/or OA.
Acknowledgments
The work is supported by a grant from the Department of Defense, the US Army Medical Research and Materiel Command (USAMRMC) under grant no. W81XWH-14-1-0207 and a Merit Review grant (IO1 BX002964) from the Biomedical Laboratory Research and Development Service, Department of Veterans Affairs, Veterans health Administration, Office of Research and Development. The views, opinions and/or findings contained in this report are those of the authors and should not be construed as an official Department of the Army position, policy or decision, unless so designated by other documentation. The funders had no role in study design, data collection and analysis, decision to publish, or preparation of the manuscript. Dr. Lau is also the recipient of a Research Career Scientist award (IK6 BX002782) from the Department of Veterans Affairs, Veterans Health Administration, Office of Research and Development. In conducting research using animals, the investigators adhered to the Animal Welfare Act Regulations and other Federal statutes relating to animals and experiments involving animals and the principles set forth in the current version of the National Institutes of Health (NIH) Guidelines for Research Involving Recombinant DNA Molecules.
References
- 1.Strobel S, Loparic M, Wendt D, Schenk AD, Candrian C, Lindberg RL, Moldovan F, Barbero A, and Martin I (2010) Anabolic and catabolic responses of human articular chondrocytes to varying oxygen percentages. Arthritis Res Ther 12, R34. [DOI] [PMC free article] [PubMed] [Google Scholar]
- 2.Lotz MK, and Kraus VB (2010) New developments in osteoarthritis. Posttraumatic osteoarthritis: pathogenesis and pharmacological treatment options. Arthritis Res Ther 12, 211. [DOI] [PMC free article] [PubMed] [Google Scholar]
- 3.Anderson DD, Chubinskaya S, Guilak F, Martin JA, Oegema TR, Olson SA, and Buckwalter JA (2011) Post-traumatic osteoarthritis: improved understanding and opportunities for early intervention. J Orthop Res 29, 802–809 [DOI] [PMC free article] [PubMed] [Google Scholar]
- 4.Brown TD, Johnston RC, Saltzman CL, Marsh JL, and Buckwalter JA (2006) Posttraumatic osteoarthritis: a first estimate of incidence, prevalence, and burden of disease. J Orthop Trauma 20, 739–744 [DOI] [PubMed] [Google Scholar]
- 5.Neogi T (2013) The epidemiology and impact of pain in osteoarthritis. Osteoarthritis Cartilage 21, 1145–1153 [DOI] [PMC free article] [PubMed] [Google Scholar]
- 6.Neogi T, and Zhang Y (2013) Epidemiology of osteoarthritis. Rheumatic diseases clinics of North America 39, 1–19 [DOI] [PMC free article] [PubMed] [Google Scholar]
- 7.Little CB, and Hunter DJ (2013) Post-traumatic osteoarthritis: from mouse models to clinical trials. Nat Rev Rheumatol 9, 485–497 [DOI] [PubMed] [Google Scholar]
- 8.Blaker CL, Clarke EC, and Little CB (2017) Using mouse models to investigate the pathophysiology, treatment, and prevention of post-traumatic osteoarthritis. J Orthop Res 35, 424–439 [DOI] [PubMed] [Google Scholar]
- 9.Kuyinu EL, Narayanan G, Nair LS, and Laurencin CT (2016) Animal models of osteoarthritis: classification, update, and measurement of outcomes. Journal of orthopaedic surgery and research 11, 19. [DOI] [PMC free article] [PubMed] [Google Scholar]
- 10.Vuolteenaho K, Moilanen T, Hamalainen M, and Moilanen E (2003) Regulation of nitric oxide production in osteoarthritic and rheumatoid cartilage. Role of endogenous IL-1 inhibitors. Scand J Rheumatol 32, 19–24 [DOI] [PubMed] [Google Scholar]
- 11.Visco DM, Hill MA, Widmer WR, Johnstone B, and Myers SL (1996) Experimental osteoarthritis in dogs: a comparison of the Pond-Nuki and medial arthrotomy methods. Osteoarthritis Cartilage 4, 9–22 [DOI] [PubMed] [Google Scholar]
- 12.Kamekura S, Hoshi K, Shimoaka T, Chung U, Chikuda H, Yamada T, Uchida M, Ogata N, Seichi A, Nakamura K, and Kawaguchi H (2005) Osteoarthritis development in novel experimental mouse models induced by knee joint instability. Osteoarthritis Cartilage 13, 632–641 [DOI] [PubMed] [Google Scholar]
- 13.Glasson SS, Askew R, Sheppard B, Carito B, Blanchet T, Ma HL, Flannery CR, Peluso D, Kanki K, Yang Z, Majumdar MK, and Morris EA (2005) Deletion of active ADAMTS5 prevents cartilage degradation in a murine model of osteoarthritis. Nature 434, 644–648 [DOI] [PubMed] [Google Scholar]
- 14.Glasson SS, Blanchet TJ, and Morris EA (2007) The surgical destabilization of the medial meniscus (DMM) model of osteoarthritis in the 129/SvEv mouse. Osteoarthritis Cartilage 15, 1061–1069 [DOI] [PubMed] [Google Scholar]
- 15.Panahifar A, Jaremko JL, Tessier AG, Lambert RG, Maksymowych WP, Fallone BG, and Doschak MR (2014) Development and reliability of a multi-modality scoring system for evaluation of disease progression in pre-clinical models of osteoarthritis: celecoxib may possess disease-modifying properties. Osteoarthritis Cartilage 22, 1639–1650 [DOI] [PubMed] [Google Scholar]
- 16.Poulet B, Hamilton RW, Shefelbine S, and Pitsillides AA (2011) Characterizing a novel and adjustable noninvasive murine joint loading model. Arthritis Rheum 63, 137–147 [DOI] [PubMed] [Google Scholar]
- 17.De Souza RL, Matsuura M, Eckstein F, Rawlinson SC, Lanyon LE, and Pitsillides AA (2005) Non-invasive axial loading of mouse tibiae increases cortical bone formation and modifies trabecular organization: a new model to study cortical and cancellous compartments in a single loaded element. Bone 37, 810–818 [DOI] [PubMed] [Google Scholar]
- 18.Christiansen BA, Anderson MJ, Lee CA, Williams JC, Yik JH, and Haudenschild DR (2012) Musculoskeletal changes following non-invasive knee injury using a novel mouse model of post-traumatic osteoarthritis. Osteoarthritis Cartilage 20, 773–782 [DOI] [PubMed] [Google Scholar]
- 19.Furman BD, Strand J, Hembree WC, Ward BD, Guilak F, and Olson SA (2007) Joint degeneration following closed intraarticular fracture in the mouse knee: a model of posttraumatic arthritis. J Orthop Res 25, 578–592 [DOI] [PubMed] [Google Scholar]
- 20.Melville KM, Kelly NH, Surita G, Buchalter DB, Schimenti JC, Main RP, Ross FP, and van der Meulen MC (2015) Effects of Deletion of ERalpha in Osteoblast-Lineage Cells on Bone Mass and Adaptation to Mechanical Loading Differ in Female and Male Mice. J Bone Miner Res 30, 1468–1480 [DOI] [PMC free article] [PubMed] [Google Scholar]
- 21.Galea GL, Hannuna S, Meakin LB, Delisser PJ, Lanyon LE, and Price JS (2015) Quantification of Alterations in Cortical Bone Geometry Using Site Specificity Software in Mouse models of Aging and the Responses to Ovariectomy and Altered Loading. Frontiers in endocrinology 6, 52. [DOI] [PMC free article] [PubMed] [Google Scholar]
- 22.Honkonen SE (1995) Degenerative arthritis after tibial plateau fractures. J Orthop Trauma 9, 273–277 [DOI] [PubMed] [Google Scholar]
- 23.Mankin HJ, Dorfman H, Lippiello L, and Zarins A (1971) Biochemical and metabolic abnormalities in articular cartilage from osteo-arthritic human hips. II. Correlation of morphology with biochemical and metabolic data. J Bone Joint Surg Am 53, 523–537 [PubMed] [Google Scholar]
- 24.Pritzker KP, Gay S, Jimenez SA, Ostergaard K, Pelletier JP, Revell PA, Salter D, and van den Berg WB (2006) Osteoarthritis cartilage histopathology: grading and staging. Osteoarthritis Cartilage 14, 13–29 [DOI] [PubMed] [Google Scholar]
- 25.Kwok J, Onuma H, Olmer M, Lotz MK, Grogan SP, and D'Lima DD (2016) Histopathological analyses of murine menisci: implications for joint aging and osteoarthritis. Osteoarthritis Cartilage 24, 709–718 [DOI] [PMC free article] [PubMed] [Google Scholar]
- 26.Cox LG, van Rietbergen B, van Donkelaar CC, and Ito K (2011) Bone structural changes in osteoarthritis as a result of mechanoregulated bone adaptation: a modeling approach. Osteoarthritis Cartilage 19, 676–682 [DOI] [PubMed] [Google Scholar]
- 27.Gong JK, Burgess E, and Bacalao P (1966) Accretion and exchange of strontium-85 in trabecular and cortical bones. Radiation research 28, 753–765 [PubMed] [Google Scholar]
- 28.Chen Y, Hu Y, Yu YE, Zhang X, Watts T, Zhou B, Wang J, Wang T, Zhao W, Chiu KY, Leung FK, Cao X, Macaulay W, Nishiyama KK, Shane E, Lu WW, and Guo XE (2018) Subchondral Trabecular Rod Loss and Plate Thickening in the Development of Osteoarthritis. J Bone Miner Res 33, 316–327 [DOI] [PubMed] [Google Scholar]
- 29.Dirschl DR, Marsh JL, Buckwalter JA, Gelberman R, Olson SA, Brown TD, and Llinias A (2004) Articular fractures. The Journal of the American Academy of Orthopaedic Surgeons 12, 416–423 [DOI] [PubMed] [Google Scholar]
- 30.Lohmander LS, Englund PM, Dahl LL, and Roos EM (2007) The long-term consequence of anterior cruciate ligament and meniscus injuries: osteoarthritis. The American journal of sports medicine 35, 1756–1769 [DOI] [PubMed] [Google Scholar]
- 31.Roos H, Adalberth T, Dahlberg L, and Lohmander LS (1995) Osteoarthritis of the knee after injury to the anterior cruciate ligament or meniscus: the influence of time and age. Osteoarthritis Cartilage 3, 261–267 [DOI] [PubMed] [Google Scholar]
- 32.Felson DT, Naimark A, Anderson J, Kazis L, Castelli W, and Meenan RF (1987) The prevalence of knee osteoarthritis in the elderly. The Framingham Osteoarthritis Study. Arthritis Rheum 30, 914–918 [DOI] [PubMed] [Google Scholar]
- 33.Litwic A, Edwards MH, Dennison EM, and Cooper C (2013) Epidemiology and burden of osteoarthritis. British medical bulletin 105, 185–199 [DOI] [PMC free article] [PubMed] [Google Scholar]
- 34.Zhang Y, and Jordan JM (2010) Epidemiology of osteoarthritis. Clinics in geriatric medicine 26, 355–369 [DOI] [PMC free article] [PubMed] [Google Scholar]
- 35.Showery JE, Kusnezov NA, Dunn JC, Bader JO, Belmont PJ Jr., and Waterman BR (2016) The Rising Incidence of Degenerative and Posttraumatic Osteoarthritis of the Knee in the United States Military. The Journal of arthroplasty 31, 2108–2114 [DOI] [PubMed] [Google Scholar]