Abstract.
Mapping the optical absorption and scattering properties of tissues using spatial frequency-domain imaging (SFDI) enhances quantitative fluorescence imaging of protoporphyrin IX (PpIX) in gliomas in the preclinical setting. The feasibility of using SFDI in the operating room was investigated here. A benchtop SFDI system was modified to mount directly to a commercial operating microscope. A digital light processing module imposed a selectable spatial light pattern from a broad-band xenon arc lamp to illuminate the surgical field. White light excitation and a liquid crystal-tunable filter allowed the diffuse reflectance images to be recorded at discrete wavelengths from 450 to 720 nm on a sCMOS camera. The performance was first tested in tissue-simulating phantoms, and data were then acquired intraoperatively during brain tumor resection surgery. The optical absorption and transport scattering coefficients could be estimated with average errors of 3.2% and 4.5% for the benchtop and clinical systems, respectively, with spatial resolution of better than 0.7 mm. These findings suggest that SFDI can be implemented in a clinically relevant configuration to achieve accurate mapping of the optical properties in the surgical field that can then be applied to achieve quantitative imaging of the fluorophore.
Keywords: spatial frequency-domain imaging, optical properties, clinical devices, in vivo
1. Introduction
Due to their infiltrative nature, primary brain tumors, even low-grade cancers, often progress rapidly and present with poor prognosis. Completeness of resection in combination with preservation of maximal neurocognitive function has been shown to coincide with increased survival and better quality of life.1,2 While standard of care involves coregistration of preoperative magnetic resonance imaging (MRI) for navigational guidance, fluorescence techniques are being widely adopted3,4 for intraoperative guidance, as brain shift can cause deviation from the preoperative MRI.5 Fluorescence imaging is useful for interrogating biological tissues as it provides information on underlying microstructure that can be obtained through a variety of optical imaging modalities.6,7 Indeed, the US Food and Drug Administration (FDA) recently approved fluorescence guidance with ALA-PpIX (5-aminolevulinic acid that leads to selective endogenous synthesis of the fluorescent photosensitizer protoporphyrin IX) for human use in high-grade glioma resection. 8 We have previously shown that quantification of ALA-PpIX fluorescence, i.e., determination of the absolute concentration of PpIX in the tissue, over a wide field (up to ) yields diagnostic information about the surgical bed that extends beyond visual fluorescence for guiding brain tumor resection by detecting unresected tumor tissue that is not otherwise visible.9,10 Furthermore, by comparing fluorescence signals measured at two wavelengths within the emission spectra of PpIX, we developed a technique to estimate the depth of the fluorescence emissions as well as to distinguish between multiple inclusions at different depths and locations within the surgical field of view (FOV).11,12 This technique, however, relies on knowledge of the optical (absorption and transport scattering) properties of the tissue being imaged, and places a premium on having a reliable, accurate, and rapid method to estimate these properties across the neurosurgical FOV.
Spatial frequency-domain imaging (SFDI) is a form of diffuse optical imaging that has been shown to estimate tissue optical properties accurately with submillimeter spatial resolution over fields of view of .13,14 By projecting sine-wave patterns of illumination intensity onto the surface, the technique effectively samples the tissue at multiple source–detector separations to collect spatially resolved diffuse reflectance. SFDI can, therefore, improve intraoperative wide-field imaging by producing quantitative maps of absorption and scattering properties of the tissue being evaluated.15–17
In the present study, we modified a clinical operating microscope to allow SFDI during neurosurgery with the goal of measuring the optical properties of the operative field during brain tumor resection. We verified these estimates in tissue-simulating phantoms to compare with the clinical system and present preliminary data on the first intraoperative optical property maps of human brain tissue with SFDI during neurosurgery.
2. Materials and Methods
2.1. Instrumentation
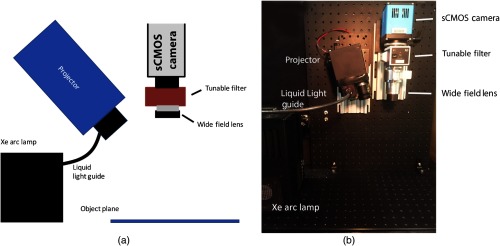
A schematic of the benchtop SFDI instrument is shown in Figure 1 and is described here briefly for completeness. This realization is similar to those reported by Sibai et al.17 The custom-built SFDI system comprises a xenon arc lamp that provides broadband light via a liquid light guide (Sutter Instruments) to a digital micromirror array projector module (CEL5500, DLI, Texas) to modulate the light before it is focused onto the sample at the object plane.
Fig. 1.
(a) Schematic of the benchtop SFDI system and (b) photograph of its physical implementation.
On the detection side, light is collected and passed through a visible-range liquid-crystal tunable filter (LCTF: varispec-07-02, Perkin Elmer. Inc., Waltham, Massachusetts) before it is registered on a 14-bit sCMOS camera (Pixelfly, PCO AG, Kelheim, Germany). Two-by-two binning is chosen for all image acquisitions to enhance signal to noise under acquisition times of interest (50 to 1000 ms). Seven patterns of light are projected at spatial frequencies of 0, 0.1, 0.3, 0.5, 0.6, 0.8, and . Control of the projected light as well as the image acquisition are done in LabVIEW (National Instruments), while a MATLAB script (MathWorks) quantifies the optical properties across the acquired FOV.
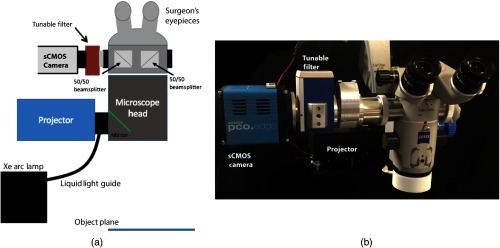
To modify the benchtop SFDI approach for clinical neurosurgery, a commercial surgical microscope stand (S1, Zeiss) was modified to accept light from the projector module and focus it on the image plane (Fig. 2). The detection subassembly, consisting of the same LCTF and sCMOS camera components, was attached to the side port of the microscope head via a custom optical adapter (TrueTex) that ensured that the magnification and image FOV were consistent with the corresponding ocular view.
Fig. 2.
(a) Schematic of the clinical SFDI system and (b) photograph of the system. The Xe Arc lamp (not shown) is mounted to the base of the microscope stand.
2.2. Tissue-Simulating Phantom Studies
Diffuse reflectance measurements were acquired with both the benchtop and clinical SFDI setups on tissue-simulating phantoms covering a wide range of absorption and transport scattering coefficients, produced by varying concentrations of India Ink (VWR) and Intralipid (Intralipid 20%, Patterson Veterinary Supply), respectively, spanning the range of optical properties found in brain tissue.18 The absorption coefficient was varied from 0.001 to in intervals for a total of six values, while scattering properties were varied from 0.4 to in intervals of for a total of nine values, creating a total of 54 combinations of absorption and scattering properties calculated at 670 nm.
For the modified SFDI system to measure optical properties in vivo on complex surfaces accurately, variations in surface topology that translate into differences in surface-to-detector distances across the FOV were corrected. Two experiments were conducted, accordingly: (1) to determine accuracy of optical property estimation and establish a profilometry calibration for the clinical system and (2) to evaluate and compare spatial resolution across the FOV of the benchtop and clinical SFDI systems. For the first test, a deep dish was filled with each phantom material [Fig. 3(a)]. Under white light illumination, diffuse reflectance images from 450 to 710 nm were acquired at 5-nm intervals, with exposure times of 250 ms. The method for phase profilometry is described elsewhere19–21 and briefly summarized here. By projecting an intensity sine wave with three different phase shifts and recovering the fringe phase at each pixel with the phantom positioned in multiple orientations and at different heights, we estimated the linear relationship between the inverse of sample height variation and the inverse of phase variation. For the clinical system, height was varied over a 3-cm range using a -translation stage, while tilt angle was varied from to by rotating the head of the clinical microscope to determine the height-dependent and angle-dependent intensity calibrations. In total, 155 images were acquired for each spatial frequency for a total integration time of 46.8 s. Images were analyzed using a rapid two-frequency lookup table (LUT) (see Sec. 2.3 below).
Fig. 3.

Diagrams of phantom experiments evaluated. (a) Experiment 1 involved homogeneous phantoms in a single well and (b) experiment 2 involved a heterogeneous phantom consisting of five separate wells filled with solutions of different optical properties.
For the second test, five different solutions were selected to represent a range of absorption and scattering parameters. Solutions were placed in a container that had five sections, each being separated by 0.17-mm glass cover slips [Fig. 3(b)]. Acquisition timing remained at 250 ms. In this test, the heterogeneous phantom was imaged in multiple orientations to assess the system’s ability to return optical properties under different sample-detector distances similar to more complex clinical settings. For the benchtop system, the phantom was translated in the -dimension and for the clinical system, the phantom was translated in the -dimension and the head of the microscope was tilted. Using a two-frequency LUT, edge-response functions were averaged for the different phantom orientations and compared between benchtop and clinical setups.
2.3. Lookup Table Method
To build the LUT, a reference set of phantoms was created to measure diffuse reflectance at two spatial frequencies of 0 and . Absorption values were varied from 0.001 to in intervals for a total of 10 absorption values, while the reduced scattering coefficients were varied from 0.3 to in intervals of , for a total of 10 scattering values, to create a set of 100 phantoms with varying optical property combinations. The measured diffuse reflectance was used to construct a two-frequency LUT.14,18 A MATLAB script based on cubic spline interpolation was formed to infer optical properties from newly acquired diffuse reflectance images based on this reference phantom dataset.
2.4. In Vivo Human Experiments
To test performance in an operative setting, the clinical SFDI system was used under an Internal Review Board-approved protocol at Dartmouth Hitchcock Medical Center to estimate absorption and scattering parameters of exposed cortex, intraoperatively. In the surgical setting, we limited acquisitions to reflectance images at 670 and 710 nm, as the optical properties at these wavelengths are needed to estimate fluorescence at depth.11,12
Three images with the spatial frequency of were acquired for profilometry at each wavelength. For acquisition of diffuse reflectance values, and , three phases of , one uniform illumination (), and one dark image were acquired at each wavelength (totaling 16 image acquisitions, requiring total). Images were processed for height and optical property estimation with profilometry correction.
3. Results
Projection areas were and for the benchtop and clinical systems, respectively. Based on previous work, fluorescence intensities and optical properties at two distinct wavelengths near the peak in the emission of the fluorophore are required for depth estimation of the fluorophore.11,12 The wavelengths empirically chosen were 670 and 710 nm so we focus our study on optical properties in this range. At these wavelengths of interest, the incident light intensities at the object plane were 0.78 and at 670 nm and 0.66 and at 710 nm for the benchtop and clinical systems, respectively. The results presented below include measurements over all wavelengths (450 to 710 nm) and spatial frequencies acquired.
3.1. Optical Property Estimation Accuracy
As the phantom solutions were homogeneous over the FOV, the estimated optical properties were averaged over a region of interest that was chosen as the area over which light was projected within the acquired image. Table 1 summarizes the errors in estimating the absorption and transport reduced scattering coefficients for benchtop and clinical systems averaging over the set of 54 phantoms. Even with reduced light intensity, the errors were comparable between the benchtop and clinical systems.
Table 1.
Summary of errors in absorption and reduced scattering coefficients between benchtop and the clinical SFDI systems.
| Benchtop system | Clinical system | |
|---|---|---|
| error(%) | ||
| error(%) |
3.2. Spatial Resolution
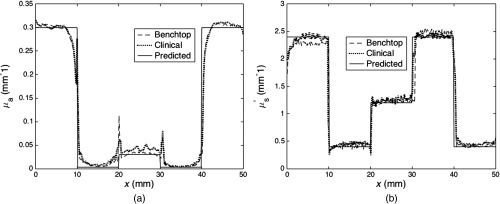
Spatial resolution was evaluated with the phantom filled with five solutions varying from low scattering () and absorption () to high scattering () and absorption (). Figure 4 (a) absorption and (b) reduced scattering maps acquired with the clinical system, as well as (c) a photograph of the heterogeneous phantom, itself. From left to right, wells contained solutions with the following properties; and , and , and , and , and and . For the benchtop system, a total of four heights were tested over a range of 3 cm, and for the clinical system, four front and side tilt angles from to were evaluated including a horizontal orientation at each of four heights over a range of 3 cm for a total of 45 orientations. Edge response functions were measured and averaged for the orientations of the benchtop and clinical setups and are shown in Figs. 5(a) and 5(b) for absorption and scattering, respectively. Here, spatial resolution was defined as the distance at which the edge-response contrast was reduced by 90%, as described elsewhere.13 The edge resolutions from the benchtop and clinical systems were similar for both absorption and scattering maps. The spatial resolution of scattering estimates for the transition between high- and low absorption wells was 0.51 and 0.53 mm for the benchtop and clinical systems, respectively, and similarly, 0.51 and 0.54 mm for low and medium absorption wells, respectively. The corresponding spatial resolutions in absorption were 0.63 and 0.65 mm for transitions between high and low, and 0.65 and 0.70 mm between low and medium absorption properties. These results are shown in Table 2.
Fig. 4.
(a) Absorption and (b) reduced scattering maps with corresponding scale bars of the heterogeneous phantom acquired at 670 nm using spatial frequency of with the clinical SFDI system. (c) Photograph of the heterogeneous phantom.
Fig. 5.
Edge response functions for the benchtop and clinical SFDI systems for (a) absorption and (b) reduced scattering maps of the heterogeneous phantom.
Table 2.
Summary of spatial resolution estimates for absorption and reduced scattering coefficients from the benchtop and clinical SFDI systems.
| Absorption resolution (mm) | Scattering resolution (mm) | |||||
|---|---|---|---|---|---|---|
| High-low | Medium-low | Average | High-low | Medium-low | Average | |
| Benchtop system | 0.63 | 0.65 | 0.64 | 0.51 | 0.51 | 0.51 |
| Clinical system | 0.65 | 0.70 | 0.68 | 0.53 | 0.54 | 0.53 |
3.3. In Vivo Imaging
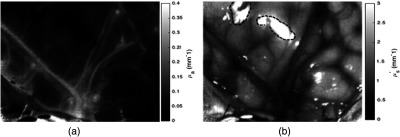
Processing the data into 2-D maps of profilometry corrected absorption and transport scattering values involved of computation time. Figure 6 shows an example of the absorption and scattering property maps of the cortical surface. Blood vessels in the field correspond to higher relative absorption values and lower relative values in scattering, as expected. Dashed lines in the reduced scattering map correspond to areas of specular reflection. Further discussion of the limitations with this current setup will be explored in Sec. 4.
Fig. 6.

(a) Absorption and (b) reduced scattering maps measured at 670 nm of the cortical surface during a brain tumor resection surgery. . Dashed lines in reduced scattering map highlight areas of specular reflection.
4. Discussion and Conclusions
In this study, the feasibility of transitioning SFDI from the benchtop to a surgery-ready imaging system was demonstrated. In the past, reflectance and fluorescence signals have been measured intraoperatively to form quantitative images of fluorophore concentration,9 and use of SFDI techniques is of interest to estimate absorption and scattering properties of the tissue in the surgical field to enable fluorescence depth estimation, as reported previously.11,12 For operating room use, the benchtop detection did not require alteration, but the illumination technique was modified. Specifically, a clinical microscope stand was adapted with a projector module to modulate the light used to illuminate the object plane. To ensure the eyepiece view remained uninterrupted, the optics within the microscope head were not altered, resulting in FOV and light intensity differences compared with the benchtop system. Nonetheless, these modifications did not significantly degrade the SFDI performance in terms of either accuracy of optical property estimation or spatial resolution and high-quality SFDI data were obtained intraoperatively to recover optical properties, corrected for profilometry on the cortical surface at the beginning of brain tumor resection surgery.
Previous work has shown that depth of fluorescence signals below the tissue surface can be estimated. This is potentially valuable when the fluorescence appears to originate from below the immediate surgical surface, but brain shift has caused tracking errors in tumor position relative to the coregistered preoperative images.5 Fluorescence depth estimation techniques have relied on knowing the optical properties of tissue. Using SFDI, we are now able to estimate these properties rapidly in vivo in the brain, using a wide-field approach. Placement of a filter wheel on the illumination side of our clinical system will allow rapid switching between reflectance and fluorescence image acquisitions.
The spatial frequency of for light patterns projected onto the imaging plane to acquire diffuse reflectance data was chosen, as it was the highest frequency available that did not have degradation resulting from the resolution of the projector. As previously reported,22,23 the effective penetration depth of light decreases with the spatial frequency of the projected pattern, and a frequency of probes only superficial layers in tissue. The use of a single spatial frequency assumes that the tissue is optically homogeneous. Clearly, this is not usually the case, so that there would be errors in the depth estimate of any subsurface tumor. To address this limitation, future clinical work will focus on using multiple spatial frequencies and taking advantage of the differences in penetration depth at each frequency to apply optical sectioning techniques to estimate the optical properties at multiple depths within the surgical field.
In its current configuration, the clinical system is limited by specular reflection effects and the amount of time required to process optical property maps. Illumination and detection side polarizers have previously been used to eliminate specular reflection.24 However, the polarization elements of the LCTF in combination with an additional detection side filter resulted in decreased throughputs at our wavelengths of interest, significantly increasing error in the optical property estimates. In future studies, polarizers will be added to the illumination side in combination with a detection system being developed to transmit polarization-dependent signal returned from the object plane more efficiently. With these improvements, we hope to investigate the additional benefits of polarization imaging in combination with SFDI.
Given the current SFDI processing time of , we are now working to speed up the method to provide quantitative fluorescence information near real time. In this report, we focused on the instrumentation and methods for imaging intraoperatively, and let the processing algorithm run on the available CPU. With an upgrade to the graphics card of our clinical computer, the code is being optimized to execute on GPUs to handle the optical property LUT more efficiently.
Fluorescence guided resection is a powerful tool for treatment of brain tumors. However, fluorescence signals from below the surgical bed are challenging to interpret without knowledge of tissue absorption and scattering parameters. By modifying a surgery-ready microscope to spatially modulate illumination light, we have demonstrated optical properties of brain-tissue-like phantoms can rapidly and accurately be estimated with errors at spatial resolutions better than 0.7 mm over fields of view of . These results suggest that SFDI is likely to enhance fluorescence-guided resection of brain tumors even further.
Acknowledgments
This work was supported by US National Institutes of Health (US) under Grant No. R01NS052274-01A2.
Biography
Biographies for the authors are not available.
Disclosures
Drs. Roberts and Paulsen have equity in InSight Surgical Technologies LLC.
References
- 1.Lacroix M., et al. , “A multivariate analysis of 416 patients with glioblastoma multiforme: prognosis, extent of resection, and survival,” J. Neurosurg. 95, 190–198 (2001). 10.3171/jns.2001.95.2.0190 [DOI] [PubMed] [Google Scholar]
- 2.Stummer W., Kamp M. A., “The importance of surgical resection in malignant glioma,” Curr. Opin. Neurol. 22, 645–649 (2009). 10.1097/WCO.0b013e3283320165 [DOI] [PubMed] [Google Scholar]
- 3.Colditz M. J., Jeffree R. L., “Aminolevulinic acid (ALA)-protoporphyrin IX fluorescence guided tumour resection. Part 1: Clinical, radiological and pathological studies,” J. Clin. Neurosci. 19(11), 1471–1474 (2012). 10.1016/j.jocn.2012.03.009 [DOI] [PubMed] [Google Scholar]
- 4.Stummer W., et al. , “Fluorescence-guided surgery with 5-aminolevulinicacid for resection of malignant glioma: a randomized controlled multicentre phase III trial,” Lancet Oncol. 7, 392–401 (2006). 10.1016/S1470-2045(06)70665-9 [DOI] [PubMed] [Google Scholar]
- 5.Roberts D. W., et al. , “Intraoperative brain shift and deformation: a quantitative analysis of cortical displacement in 28 cases,” Neurosurgery 43, 749–758 (1998). 10.1097/00006123-199810000-00010 [DOI] [PubMed] [Google Scholar]
- 6.“Aminolevulinic acid hydrochloride, known as ALA HCl (Gleolan, NX Development Corp.) as an optical imaging agent indicated in patients with gliomas,” https://www.fda.gov (June 6 2009).
- 7.Marcu L., et al. , “Fluorescence lifetime spectroscopy of glioblastoma multiforme,” Photochem. Photobiol. 80(1), 98–103 (2004). 10.1562/2003-12-09-RA-023.1 [DOI] [PubMed] [Google Scholar]
- 8.Valdés P. A., et al. , “Quantitative fluorescence in intracranial tumor: implications for ALA-induced PpIX as an intraoperative biomarker,” J. Neurosurg. 115(1), 11–17 (2011). 10.3171/2011.2.JNS101451 [DOI] [PMC free article] [PubMed] [Google Scholar]
- 9.Valdés P. A., et al. , “Combined fluorescence and reflectance spectroscopy for in vivo quantification of cancer biomarkers in low and high-grade glioma surgery,” J. Biomed. Opt. 16(11), 116007 (2011). 10.1117/1.3646916 [DOI] [PMC free article] [PubMed] [Google Scholar]
- 10.Valdés P. A., et al. , “Quantitative fluorescence using 5-aminolevulinic acid-induced protoporphyrin IX biomarker as a surgical adjunct in low-grade glioma surgery,” J. Neurosurg. 123(3), 771–780 (2015). 10.3171/2014.12.JNS14391 [DOI] [PMC free article] [PubMed] [Google Scholar]
- 11.Kolste K. K., et al. , “Macroscopic optical imaging technique for wide-field estimation of fluorescence depth in optically turbid media for application,” J. Biomed. Opt. 20(2), 260002 (2012). 10.1117/1.JBO.20.2.026002 [DOI] [PMC free article] [PubMed] [Google Scholar]
- 12.Wirth D., et al. , “Fluorescence depth estimation from wide-field optical imaging data for guiding brain tumor resection: a multi-inclusion phantom study,” Biomed. Opt. Express 8(8), 3656–3670 (2017). 10.1364/BOE.8.003656 [DOI] [PMC free article] [PubMed] [Google Scholar]
- 13.Cuccia D. J., et al. , “Quantitation and mapping of tissue optical properties using modulated imaging,” J. Biomed. Opt. 14, 024012 (2009). 10.1117/1.3088140 [DOI] [PMC free article] [PubMed] [Google Scholar]
- 14.Erickson T. A., et al. , “Lookup-table method for imaging optical properties with structured illumination beyond the diffusion theory regime,” J. Biomed. Opt. 15(3), 036013 (2010). 10.1117/1.3431728 [DOI] [PMC free article] [PubMed] [Google Scholar]
- 15.Gioux S., et al. , “First-in-human pilot study of a spatial frequency domain oxygenation imaging system,” J. Biomed. Opt. 16, 086015 (2011). 10.1117/1.3614566 [DOI] [PMC free article] [PubMed] [Google Scholar]
- 16.Laughney A. M., et al. , “System analysis of spatial frequency domain imaging for quantitative mapping of surgically resected breast tissues,” J. Biomed. Opt. 18, 036012 (2013). 10.1117/1.JBO.18.3.036012 [DOI] [PMC free article] [PubMed] [Google Scholar]
- 17.Sibai M., et al. , “Preclinical evaluation of spatial frequency domain-enabled wide-field quantitative imaging for enhanced glioma resection,” J. Biomed. Opt. 22(7), 076007 (2017). 10.1117/1.JBO.22.7.076007 [DOI] [PMC free article] [PubMed] [Google Scholar]
- 18.Michels R., Foschum F., Kienle A., “Optical properties of fat emulsions,” Opt. Express 16, 5907–5925 (2008). 10.1364/OE.16.005907 [DOI] [PubMed] [Google Scholar]
- 19.Gioux S., et al. , “Three-dimensional surface profile intensity correction for spatially-modulated imaging,” J. Biomed. Opt. 14(3), 034045 (2009). 10.1117/1.3156840 [DOI] [PMC free article] [PubMed] [Google Scholar]
- 20.Srinivasan V., Liu H. C., Halioua M., “Automated phase-measuring profilometry of 3-D diffuse objects,” Appl. Opt. 23, 3105 (1984). 10.1364/AO.23.003105 [DOI] [PubMed] [Google Scholar]
- 21.Zhou W. S., Su X. Y., “A direct mapping algorithm for phase-measuring profilometry,” J. Mod. Opt. 41, 89–94 (1994). 10.1080/09500349414550101 [DOI] [Google Scholar]
- 22.Rajaram N., Nguyen T., Tunnell J., “Lookup table–based inverse model for determining optical properties of turbid media,” J. Biomed. Opt. 13(5), 050501 (2008). 10.1117/1.2981797 [DOI] [PMC free article] [PubMed] [Google Scholar]
- 23.Yang B., et al. , “Polarized light spatial frequency domain imaging for non-destructive quantification of soft tissue fibrous structures,” Biomed. Opt. Express 6(4), 1520–1533 (2015). 10.1364/BOE.6.001520 [DOI] [PMC free article] [PubMed] [Google Scholar]
- 24.Kashima S., “Non-contact laser tissue blood flow measurement using polarization to reduce the specular reflection artifact,” Opt. Laser Technol. 26(3), 169–175 (1994). 10.1016/0030-3992(94)90039-6 [DOI] [Google Scholar]


