Abstract.
A multi-spectral laser speckle contrast imaging (MS-LSCI) system is proposed using only a single wavelength-swept laser, which provides both highly coherent and multi-spectral outputs to simultaneously generate laser speckle contrast images and multi-spectral images, respectively. Using a laser light swept from 770 to 821 nm at a repetition rate of 5 Hz and a CCD camera of 335 fps, 67 multi-spectral frame images are acquired in 0.76 nm wavebands over 51 nm spectral range. The spectral sub-windowing method of single wavelength-swept laser source is used to solve the lack of spectral information from a few individual light sources, which is a limitation of conventional MS-LSCI systems. In addition to the speckle flow index from the LSCI frames, the multi-spectrally encoded images can generate additional images of spectral absorbance. To further examine the performance of the MS-LSCI system, an in vivo cuff-induced ischemia experiment was conducted to show the real-time imaging of hemodynamic and blood oxygen saturation changes simultaneously over the entire field of view.
Keywords: laser speckle imaging, multi-spectral imaging, wavelength-swept laser
1. Introduction
Laser speckle contrast imaging (LSCI) is a simple and useful imaging technique that utilizes the speckle pattern randomly produced on the image sensor from a highly coherent light source.1 This imaging technique has been known as an economical and efficient method to acquire information about movement or flow of the target subject, including blood cells in living organisms.2 Owing to its advantages of real-time imaging, ease of use, and non-invasive nature, LSCI is widely used in the fields of biological sciences and clinical diagnosis.3 Multi-spectral imaging (MSI) is another popular imaging technique using multiple wavelengths from a broadband light source. This technique collects a series of images of the target over multiple wavelengths from an image sensor, such as a charge-coupled device (CCD) or a complementary metal-oxide semiconductor (CMOS) sensor, to analyze the composition of the target by acquiring spectrally distributed information, such as the reflectance and absorbance.4,5 Recently, there have been reports of a few multi-modal imaging modalities combining LSCI and MSI systems.6–8
The light source for such multi-modal imaging systems requires both high-coherence and broadband light output. For this multi-spectral laser speckle contrast imaging (MS-LSCI) system, a broadband light source with a spectral filter can acquire spectral information for MSI, but an additional high-coherence light source should be used to measure LSCI simultaneously. A combination of a white light with a rotary filter wheel and a laser diode (LD) have been applied to generate multiple wavelengths and high coherency, respectively.7 Instead of using a broadband light source with a spectral filter, an LD array can be used to obtain both multi-spectral and LSCI data. However, it is hard to increase the number of LDs in the system because adding more components complicates the configuration. When two LDs of different wavelengths are applied sequentially to utilize both their coherence and spectral properties, such a system requires only one CCD camera.8 For the beam-combining method employing two dichroic beam splitters, an additional dichroic mirror and two CMOS cameras were used to acquire images of two wavelengths simultaneously.9 A color CCD camera with Bayer filters was also used with two laser diodes to obtain the speckle pattern and the dual-wavelength optical reflectance simultaneously.10
In this paper, we propose a novel MS-LSCI system that uses only a single wavelength-swept laser to provide both highly coherent and multi-spectral outputs, to simultaneously generate laser speckle contrast images and multi-spectral images, respectively. We conducted an in vitro experiment with a phantom to demonstrate that our system can be sensitive to the flow, and the absorbance can be encoded with spectral information. We also present results of the experiment applied to human subjects during the occlusion protocols in vivo for the feasibility test of the proposed system.
2. Materials and Methods
2.1. System Setup
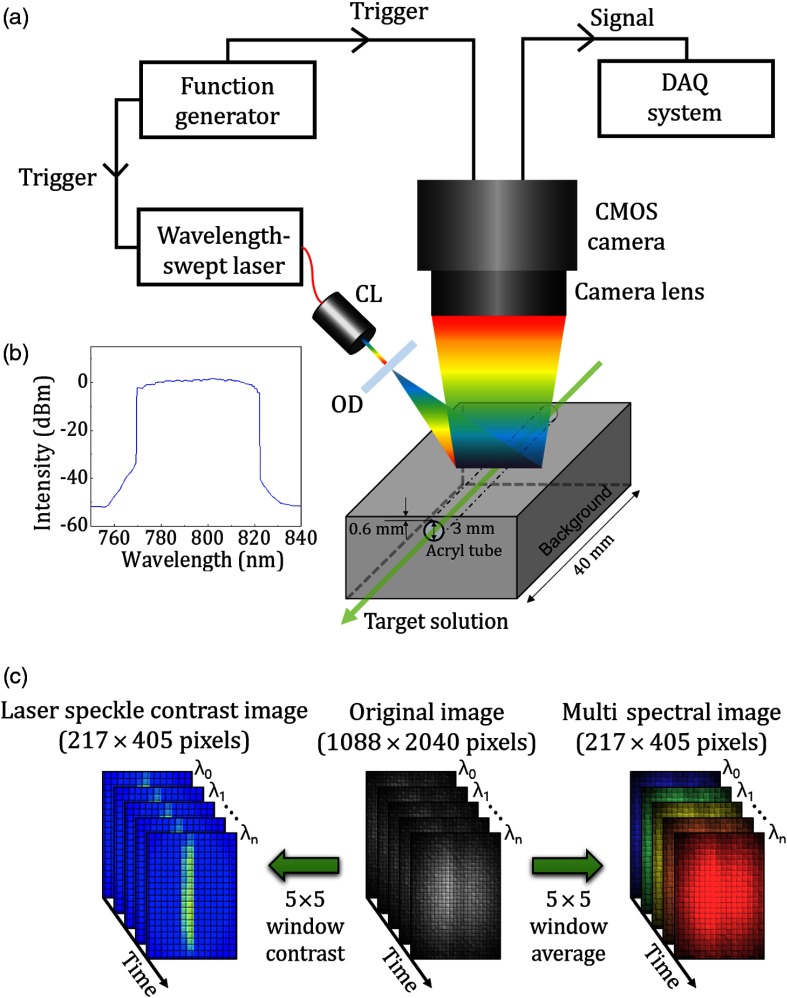
Figure 1(a) presents the experimental setup of the proposed MS-LSCI system based on the wavelength-swept laser. An acousto-optic tunable filter was used in the laser cavity, owing to its superior stability and wavelength-linear tunability compared to conventional mechanical filters, such as a tunable Fabry–Pérot etalon or a tunable micro electro mechanical system.11 The spectral bandwidth of the wavelength-swept laser output spans 51 nm from 770 to 821 nm as shown in Fig. 1(b). The average output power of the laser is approximately 18 mW. An optical diffuser (ED1-S500-MD, Thorlabs) was used to diffuse the illumination light with uniform intensity over the entire imaging area. Reflected light passing through the camera lens is acquired by a CMOS camera (VC-2MC-M/C 340, Vieworks Co., Ltd., , pixel size ).
Fig. 1.
(a) Experimental set-up of the MS-LSCI system based on the wavelength-swept laser including phantom used for validation experiments. (CL: collimation lens; OD: optical diffuser; DAQ: data acquisition). (b) Peak-hold mode spectrum of the wavelength-swept laser. (c) MS-LSCI image conversion process. Processed images on the left and right sides represent laser speckle contrast and multi-spectral absorbance images derived from the original raw images, respectively.
The size of the speckle is determined by the specific imaging condition values of the imaging system.12 The spectral bandwidth of our light source covers from 770 to 821 nm. The size of the camera sensor is and the field of view (FOV) on the sample is . The magnification is set to 0.05 and the f-number of the lens (MVL50M23, Navitar) is 11. Under these imaging conditions, the speckle size of this system is determined to be approximately , which is 1–3 times larger than the pixel size of the camera sensor. Owing to the CMOS camera’s limit of 335 frames per second (fps), the wavelength-swept laser was swept at 5 Hz, and 67 frames of images were acquired during a single sweep. Accordingly, the 67 divisions of the spectral range of 51 nm result in spectral sub-windows for each frame of approximately 0.76 nm. To synchronize the wavelength-swept laser and the CMOS camera, a function generator with a trigger signal was used. The acquired raw images were processed by a self-coded LabVIEW program and converted in parallel laser speckle contrast and multi-spectral image, as shown in Fig. 1(c). The original raw image of is divided into windows of for the effective conversion to LSCI and MSI with each of by LabVIEW code.
First, a phantom experiment was conducted to demonstrate the reliability of the proposed MS-LSCI system to measure both laser speckle contrast and multi-spectral absorbance images. The background medium of the phantom was fabricated with a silicon material (MK-Silicone, MOLKANG) made by mixing the base and hardener with the ratio of 100:3. The base consists of 30% polydimethylsiloxanes, 45% polydimethylsiloxane-terminated silanol, and 25% cristobalite. An acryl tube with an outer diameter of 5 mm and an inner diameter of 3 mm was located at a depth of 0.6 mm below the top surface of the background medium as shown in Fig. 1(a). Since the acryl tube is bigger than what is expected in tissue, the phantom experiment can show that the system is sensitive to flow but it is hard to comment about the accuracy and linearity of in vivo flow exactly. Two kinds of target solutions, A and B, were prepared by using 1 vol% diluted intralipid solution to have a reduced scattering coefficient of at 800 nm.13 Two different dyes, NIR782E and NIR869A (QCR Solutions Corp.), were added to target solutions A and B, respectively. In the case of the target solution A, the concentration of NIR782E corresponding to an absorption coefficient of at 800 nm was . In case of the target solution B, the concentration of NIR869A corresponding to an absorption coefficient of at 800 nm was . A dye-free solution was used as a reference to compare with solutions A and B. The prepared solutions were poured into a syringe separately and constantly injected to the acryl tube through a rubber tube with a syringe pump (NE-1000, New Era Pump Systems, Inc.). The syringe pump was set at a flow rate of 1 mL/min, which corresponds to a flow velocity of 2 mm/s in a 3 mm diameter tube. To determine the relation between the absorbance and absorption coefficient, we prepared nine samples with different absorption coefficients to illustrate the sensitivity of the system within the physiological range. All samples were made with the same 1 vol% intralipid solution but have absorption coefficients of at 800 nm because of different concentrations of NIR782E. After preparing the samples accurately, the spectroscopic absorbances of all samples were measured with a commercial spectrometer (USB2000+, Ocean Optics, Inc.).
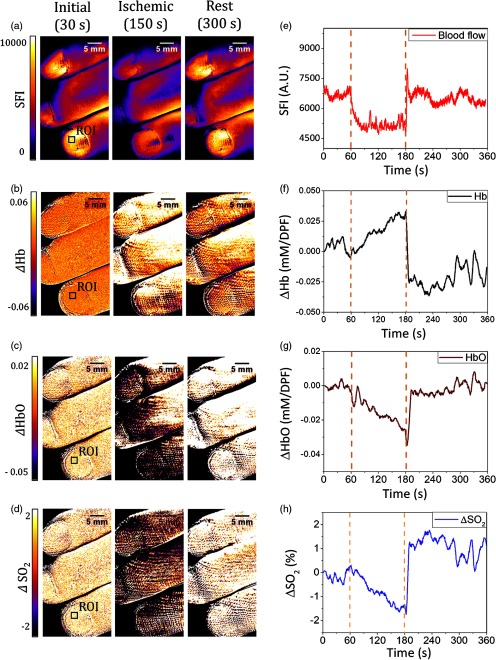
For the next experiment, hemodynamics and blood oxygen saturation changes were measured by the proposed MS-LSCI system during an in vivo cuff-induced ischemia experiment, resulting in laser speckle contrast and multi-spectral absorbance images. The experimental procedures were approved by the Institutional Review Board of Pusan National University, Korea (IRB approval No. PNU IRB/2018_97_HR). The experiment was carried out for 360 s. After 60 s at the initial resting state, a pressure of 220 mmHg was applied by a cuff around a subject’s arm to block blood flow. During the ischemia experiments, we put the cuff 2.5 cm above the elbow. We measured hemodynamic change during the ischemic state. The ring finger of the left hand was selected as a region of interest (ROI). The size of the ROI on the obtained image is , which corresponds to about in real imaging area. This ischemic state lasted for 120 s. Then, the pressure was released to measure the resting state again for 180 s.
2.2. Imaging Processing
The original image captured by the CMOS camera has both speckle and multispectral information. The speckle contrast and the multispectral images can be determined out by analyzing the reflection intensity of the image. The speckle contrast, , can be calculated using Eq. (1):1
| (1) |
In Eq. (1), represents the speckle contrast, is the standard deviation, and is the mean of the intensity of the reflectance image in a region of interest. In this experiment, the original raw image array of are divided into windows before calculating the speckle contrast. Therefore, each 25-pixel region in the original image is converted to a single pixel, reducing the lateral pixel resolution of the laser speckle contrast image by five times compared to the raw image. Assuming that all photons are Doppler shifted and have a random velocity distribution (Lorentzian or Gaussian), the relationship between and dynamic fluctuation of the speckle can be derived as in Eq. (2).2,14,15
| (2) |
where is the correlation time that is time taken for the contrast to fall to a specific level. It is inversely proportional to the velocity of the scatterers, and is the exposure time of the camera. It is known that the reciprocal of the speckle contrast squared, , can be approximated by .1,16 Since is related to the flow, the velocity of scatterers is approximately can be derived as in Eq. (3).17
| (3) |
where speckle flow index (SFI) represents the relative speed of the scatteres. Thus, we can convert speckle contrast values to maps of SFI using the Eq. (3). In our system in particular, there is a periodic change of intensity on each pixel corresponding to the swept wavelength owing to the variation in sensitivity of the camera over the wavelength range in use. This kind of intensity change can be manifested as a noise factor in the LSCI. To mitigate this source of noise, repeatedly measured frames of laser speckle contrast images, corresponding to multiple spectral sweeps, were averaged to minimize SNR reduction.8,10
To validate the reliability of the MSI modality, absorbances over the wavelength ranges are compared to a commercial white light spectrometer (USB 2000+, Ocean Optics, Inc.). Absorbance can be represented as in Eq. (4).10,18
| (4) |
where represents the spectrally encoded absorbance parameter. is the intensity of the wavelength-dependent diffuse reflection for the baseline image of the reference solution without dye. is the corresponding reflectance intensity for the solution with dye. The absorbance is calculated over the 67 frames corresponding to each waveband individually. Similarly, to the LSCI process, the MSI process also employs a window-based protocol, however, MSI only calculates the average value of the total intensity. Thus, 67 frames of -sized multi-spectral images are generated for every spectral sweep. The absorbances of the two different target solutions (A and B, as previously described) are measured by both the white light spectrometer and the MS-LSCI system for comparison. In the case of the white light spectrometer, two solutions are prepared in separate beakers. Absorbances of the target solutions A and B are calculated by comparing their reflectance to that of the reference solution through a fiber optic reflection bundle (RP021, Thorlabs). Owing to the low intensity of the white light, the reflected light was integrated for 30 s to increase the signal to noise ratio (SNR). In the case of the MS-LSCI system, the absorbances of the target solutions A and B were measured every 0.2 s, in correspondence with the sweep speed. The reference solution is flowed through the acryl tube before the target solutions are injected. For each solution, 10 absorbance spectra are averaged for 2 s to reduce intensity fluctuations from speckle contrast.
In the in vivo experiment, relative concentrations of oxy-hemoglobin (HbO) and deoxy-hemoglobin (Hb) were calculated by the following multiple-wavelength Beer-Lambert law.8,19
| (5) |
where and indicate the time-dependent concentrations of HbO and Hb, respectively. Note that is the extinction coefficient of HbO or Hb in accordance with the subscript, which is well-known.20 is the spectrally encoded absorbance parameter, which can be calculated by Eq. (4). A differential path-length factor (DPF) is introduced to take into account light scattering effects in Beer-Lambert law.21 It accounts for an extended distance that light travels through a scattering medium. Here, DPF is considered an unknown parameter, we only track relative change over time. It means that this model is just sufficient enough to track the relative changes in oxy- and deoxy- hemoglobin in a non-linear manner.22 The relative degree of oxygen saturation changes, [], can be expressed as in Eq. (6):23
| (6) |
3. Results
3.1. Phantom Experiment
There are some factors that reduce the sensitivity of the measurement. Since the standard deviation of the speckle contrast influences the sensitivity of flow velocity, it can be difficult to measure the change in flow velocity when the deviation of the speckle contrast is greater than that of the flow. The SNR for the flow velocity measurement can be shown as follows:24
| (7) |
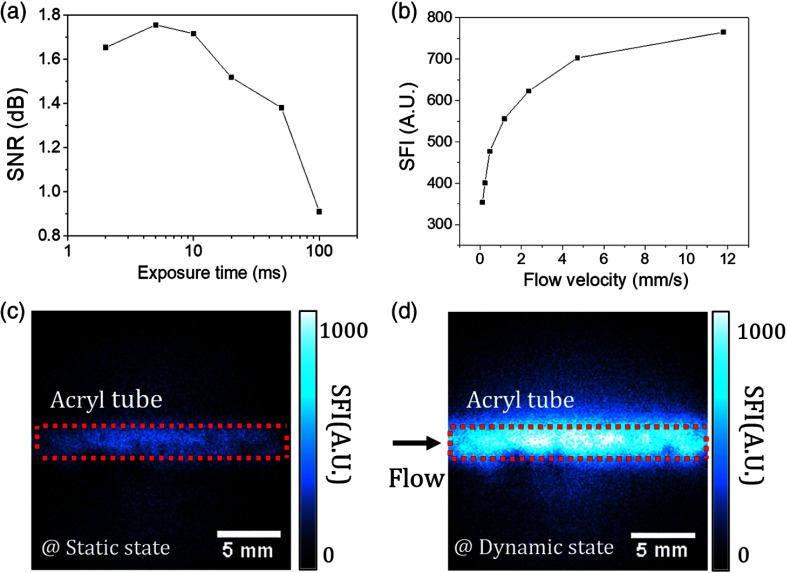
where is the variation of the speckle contrast caused by change in flow velocity, and is the standard deviation of the speckle contrast. To determine the optimal exposure time, we measured the SNR of a speckle contrast image under a fixed exposure time condition for a flow velocity of 1 mm/s.
Figure 2(a) shows the SNR measurement results according to the various camera exposure times for a flow velocity of 1 mm/s. The highest SNR occurred at an exposure time of 5 ms. As exposure time was increased from 5 ms the SNR decreased, dropping rapidly beyond 10 ms. Thus, we use exposure times within the range 1 to 10 ms for the MS-LSCI system.
Fig. 2.
(a) Signal to noise ratio (SNR) of speckle contrast according to camera exposure time for a flow velocity of 1 mm/s. (b) Relation of SFI increases with flow velocity. SFI image of phantom experiments in the (c) static state, and (d) dynamic state, respectively.
Under the same phantom conditions, the camera exposure time is set to 5 ms by adjusting the camera frame-rate to 200 fps for maximum SNR, and the ROI of the acrylic tube is set to for flow velocity detection, which corresponds to an area of on the sample. Figure 2(b) presents the correlation between flow velocity and the SFI. The measured correlation is similar to conventional LSCI systems.17,25 Figures 2(c) and 2(d) shows the SFI images acquired in the static state, and dynamic state with a flow rate of 5 mL/min, corresponding to a flow velocity of 11.7 mm/s using a syringe pump, respectively. The SFI of the acryl tube area in the dynamic state is dramatically higher than in the static state owing to the increased flow movement of the solution.
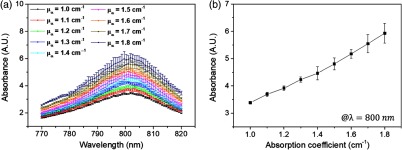
Figure 3(a) shows the absorbance spectrum of samples with different absorption coefficients. In this experiment, the frame rate of the camera is set to the limit of 335 fps, which corresponds to an exposure time of approximately 3 ms. Thus, the absorbance spectrum was measured for all 67 wavebands of the swept-laser (sweep frequency 5 Hz) covering the range of 51 nm. Figure 3(b) shows the measured relation between absorption coefficient and absorbance at the specific wavelength of 800 nm, which has the highest absorbance value between 770 and 821 nm. The absorbance is shown to increase linearly with the absorption coefficient. The absorbance difference between the two samples ( and ) on the left side of Fig. 3(b) is about 0.3 and the derived standard deviation is 0.04. This means that the smallest measurable change in absorption coefficient using the MS-LSCI system is . Whereas, although the standard deviation of the measured absorbance difference between the two samples ( and ) on the right side of Fig. 3(b) is still 0.3, the derived standard deviation has a much higher value of 0.36. The larger the absorption coefficient measured, the greater the standard deviation. Since the increase of standard deviation is caused by low light intensity owing to absorption by the sample, we expect that the standard deviation of the imaging system can be reduced by increasing the sensitivity of the camera or the intensity of the laser.
Fig. 3.
(a) Absorbance spectra of the nine samples with different absorption coefficients ( with interval), and (b) relation between absorption coefficient and absorbance at 800 nm.
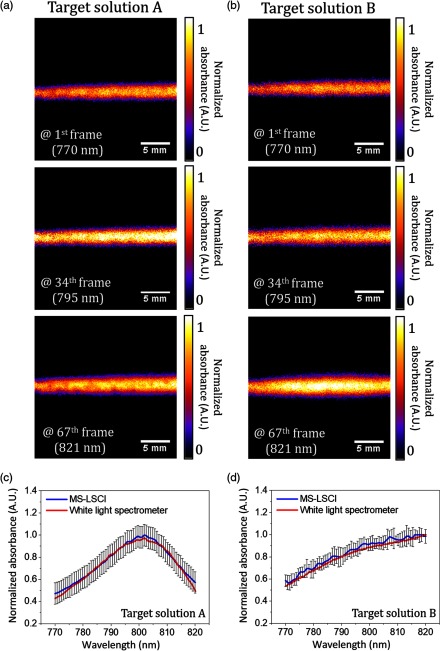
Figures 4(a) and 4(b) respectively show the spectrally encoded absorbance images of target solutions A and B at three different wavelength points: of 770, 795, and 821 nm. Because the maximum absorption point of target solution A is located near 800 nm, the absorbance in the center image is higher than the other two images shown in Fig. 4(a). In target solution B shown in Fig. 4(b), the absorbance increases as the wavelength increases. Figures 4(c) and 4(d) represent normalized absorbance spectra of the target solution A and B over the entire wavelength region. Data from the MS-LSCI and the white-light spectrometer are expressed as blue and red solid lines, respectively. The absorbance spectra measured by the two systems appear to have no significant differences.
Fig. 4.
Measured absorbance images of (a) target solution A and (b) B at three wavelength points. Normalized absorbance spectra of (c) target solution A and (d) B in the entire wavelength region measured by white light spectrometer and the MS-LSCI system.
3.2. In Vivo Experiment
Figures 5(a)–5(d) represent acquired images of SFI, , , and at 30, 150, and 300 s, with a field of view of . It can be simply monitored that SFI, , and decrease but increases during the ischemic state. Figures 5(e)–5(h) represent the change over time of SFI, , , and in the ROI. The ROI is located on the nail of the ring finger and is marked in Figs. 5(a)–5(d). The size of the ROI is , which is corresponds to . As expected logically from the conventional observation in Hb and HbO concentrations, SFI, , , and changed continuously during the ischemic state and most of the four values changed dramatically at the moment when the pressure was released at 180 s. During the ischemic state, the maximum concentration changes of Hb and HbO from the baseline were 0.033 and , respectively. These trends during the occlusion protocols follow other similar studies.26–28
Fig. 5.
(a)–(d) Acquired images of SFI, , and at 30, 150, and 300 s. (e)–(h) Time series data of SFI, , , and in the marked region of interest (ROI).
4. Discussion
The MS-LSCI system was developed to obtain laser speckle contrast and multi-spectral images simultaneously over a spectral range from 770 to 821 nm. The repetition rate is 5 Hz, which corresponds to the sweep frequency of the wavelength-swept laser. It is possible to increase the repetition rate by decreasing the number of frames at every spectral sweep. Experimental validations for the SFI and spectrally encoded absorbance images were performed with in vitro phantom and in vivo human experiments. Although the spectral range used in the experiment to measure HbO and Hb was narrower compared to other multi-spectral image studies, it was available to observe changes of value during the occlusion protocols. Since we acquired 67 wavelength images, which is much larger than conventional laser speckle imaging systems, the proposed technique can be potentially extended to measure other chromophores, such as water or lipid. However, in order to reliably measure the more chromophore components, it is necessary to expand the overall spectral range over 51 nm. We expect the output spectral bandwidth of wavelength-swept laser can be increased by employing a multiple gain chips in a single cavity configuration.29,30
5. Conclusion
For the feasibility test of the proposed MS-LSCI system, a single wavelength-swept laser was used to provide both highly coherent and multi-spectral outputs to simultaneously generate laser speckle contrast and multi-spectral images, respectively. We simply demonstrated that our system can be sensitive to the flow and the absorbance can be encoded with spectral information. In a further study, other various imaging techniques, such as spatial frequency domain imaging, can be combined with the proposed MS-LSCI system. Experiments with an improved wavelength-swept laser with wider spectral range and deeper analysis of more chromophores will be commenced in the near future.
Acknowledgments
This study was supported by the National Research Foundation of Korea (NRF) grant funded by the Ministry of Science and ICT, Republic of Korea (NRF-2017R1A4A1015627), the Korea Institute for Advancement of Technology (KIAT) grant funded by the Korea Government (MOTIE) (P0008763, The Competency Development Program for Industry Specialists), and the Civil & Military Technology Cooperation Program, Republic of Korea (16-CM-SS-09).
Biographies
Jeong Won Kim received his BS degree from Pusan National University, Busan, South Korea, in 2018, where he is currently working toward his MS degree in the Department of Cogno-Mechatronics Engineering. His current research interests include optical imaging techniques and fiber laser systems.
Hansol Jang received his BS and MS degrees from Pusan National University, Busan, South Korea, in 2015, where he is currently working toward the PhD in the Department of Cogno-Mechatronics Engineering. His current research interests include pulse fiber laser, long coherence laser, and biomedical imaging.
Gyeong Hun Kim received his BS and MS degrees from Pusan National University, Busan, South Korea, in 2015, where he is currently working toward his PhD in the Department of Cogno-Mechatronics Engineering. His current research interests include fiber laser and optical fiber sensors.
Seung Won Jun received his BS, MS and PhD degrees from Pusan National University, Busan, South Korea, in 2019. He is currently a postdoctoral researcher at the Optomechatronics Research Institute, Pusan National University. His current research interests include fiber laser, multiphoton microscopy, and multifunctional image.
Chang-Seok Kim received his BS degree from the Korea Advanced Institute of Science and Technology, Daejeon, South Korea, in 1996, his MS degree from the Gwangju Institute of Science and Technology, Gwangju, South Korea, in 1999, and his PhD from the Johns Hopkins University, Baltimore, MD, USA, in 2004. From 1999 to 2000, he was a research engineer with Korea Telecom, Daejeon. From 2004 to 2005, he was a postdoctoral researcher with the Beckman Laser Institute and Medical Clinic, University of California, Irvine. Since 2005, he has been a professor in the Department of Cogno-Mechatronics Engineering, Pusan National University, Busan, South Korea. His research interests include development of novel fiber laser systems and application of them into biomedical, telecommunication, and sensor areas.
Disclosures
The authors have no relevant financial interests in this article and no potential conflicts of interest to disclose
References
- 1.Briers J., Webster S., “Laser speckle contrast analysis (LASCA): a nonscanning, full-field technique for monitoring capillary blood flow,” J. Biomed. Opt. 1(2), 174–179 (1996). 10.1117/12.231359 [DOI] [PubMed] [Google Scholar]
- 2.Briers D., et al. , “Laser speckle contrast imaging: theoretical and practical limitations,” J. Biomed. Opt. 18(6), 066018 (2013). 10.1117/1.JBO.18.6.066018 [DOI] [PubMed] [Google Scholar]
- 3.Dunn A. K., et al. , “Simultaneous imaging of total cerebral hemoglobin concentration, oxygenation, and blood flow during functional activation,” Opt. Lett. 28(1), 28–30 (2003). 10.1364/OL.28.000028 [DOI] [PubMed] [Google Scholar]
- 4.Miao P., et al. , “Chronic wide-field imaging of brain hemodynamics in behaving animals,” Biomed. Opt. Express 8(1), 436–445 (2017). 10.1364/BOE.8.000436 [DOI] [PMC free article] [PubMed] [Google Scholar]
- 5.Webere J. R., et al. , “Multispectral imaging of tissue absorption and scattering using spatial frequency domain imaging and a computed-tomography imaging spectrometer,” J. Biomed. Opt. 16(1), 011015 (2011). 10.1117/1.3528628 [DOI] [PMC free article] [PubMed] [Google Scholar]
- 6.Boas D. A., Dunn A. K., “Laser speckle contrast imaging in biomedical optics,” J. Biomed. Opt. 15(1), 011109 (2010). 10.1117/1.3285504 [DOI] [PMC free article] [PubMed] [Google Scholar]
- 7.Jones P. B., et al. , “Simultaneous multispectral reflectance imaging and laser speckle flowmetry of cerebral blood flow and oxygen metabolism in focal cerebral ischemia,” J. Biomed. Opt. 13(4), 044007 (2008). 10.1117/1.2950312 [DOI] [PMC free article] [PubMed] [Google Scholar]
- 8.Luo Z., et al. , “Simultaneous imaging of cortical hemodynamics and blood oxygenation change during cerebral ischemia using dual-wavelength laser speckle contrast imaging,” Opt. Lett. 34(9), 1480–1482 (2009). 10.1364/OL.34.001480 [DOI] [PubMed] [Google Scholar]
- 9.Qin J., et al. , “Fast synchronized dual-wavelength laser speckle imaging system for monitoring hemodynamic changes in a stroke mouse model,” Opt. Lett. 37(19), 4005–4007 (2012). 10.1364/OL.37.004005 [DOI] [PMC free article] [PubMed] [Google Scholar]
- 10.Wang J., et al. , “Dual-wavelength laser speckle imaging to simultaneously access blood flow, blood volume, and oxygenation using a color CCD camera,” Opt. Lett. 38(18), 3690–3692 (2013). 10.1364/OL.38.003690 [DOI] [PubMed] [Google Scholar]
- 11.Han G.-H., et al. , “Electro-optic swept source based on AOTF for wavenumber-linear interferometric sensing and imaging,” Fibers 4(2), 14 (2016). 10.3390/fib4020014 [DOI] [Google Scholar]
- 12.Ramirez-San-Juan J. C., et al. , “Effects of speckle/pixel size ratio on temporal and spatial speckle-contrast analysis of dynamic scattering systems: implication for measurements of blood-flow dynamics,” Biomed. Opt. Express 4(10), 1883–1889 (2013). 10.1364/BOE.4.001883 [DOI] [PMC free article] [PubMed] [Google Scholar]
- 13.McGlone V. A., et al. , “Measuring optical temperature coefficients of Intralipid,” Phys. Med. Biol. 52(9), 2367–2378 (2007). 10.1088/0031-9155/52/9/003 [DOI] [PubMed] [Google Scholar]
- 14.Cheng H., et al. , “Laser speckle imaging of blood flow in microcirculation,” Phys. Med. Biol. 49(7), 1347–1357 (2004). 10.1088/0031-9155/49/7/020 [DOI] [PubMed] [Google Scholar]
- 15.Fercher A. F., Briers J. D., “Flow visualization by means of single-exposure speckle photography,” Opt. Commun. 37, 326–330 (1981). 10.1016/0030-4018(81)90428-4 [DOI] [Google Scholar]
- 16.Ramirez-San-Juan J. C., et al. , “Impact of velocity distribution assumption on simplified laser speckle imaging equation,” Opt. Express 16(5), 3197–3203 (2008). 10.1364/OE.16.003197 [DOI] [PMC free article] [PubMed] [Google Scholar]
- 17.Cheng H., Duong T.Q., “Simplified laser-speckle-imaging analysis method and its application to retinal blood flow imaging,” Opt. Lett. 32(15), 2188–2190 (2007). 10.1364/OL.32.002188 [DOI] [PMC free article] [PubMed] [Google Scholar]
- 18.Nishidate I., et al. , “Simultaneous evaluation of cerebral hemodynamics and light scattering properties of the in vivo rat brain using multispectral diffuse reflectance imaging,” J. Vis. Exp. 123, e55399 (2017). 10.3791/55399 [DOI] [PMC free article] [PubMed] [Google Scholar]
- 19.Du C., et al. , “Simultaneous detection of blood volume, oxygenation, and intracellular calcium changes during cerebral ischemia and reperfusion in vivo using diffuse reflectance and fluorescence,” J. Cereb. Blood Flow Metab. 25, 1078–1092 (2005). 10.1038/sj.jcbfm.9600102 [DOI] [PubMed] [Google Scholar]
- 20.Matcher S. J., et al. , “Performance comparison of several published tissue near-infrared spectroscopy algorithms,” Anal. Biochem. 227, 54–68 (1995). 10.1006/abio.1995.1252 [DOI] [PubMed] [Google Scholar]
- 21.Delpy D. T., et al. , “Estimation of optical pathlength though tissue from direct time of flight measurement,” Phys. Med. Biol. 33, 1433–1442 (1988). 10.1088/0031-9155/33/12/008 [DOI] [PubMed] [Google Scholar]
- 22.Kim J. G., Liu H., “Variation of haemoglobin extinction coefficients can cause errors in the determination of haemoglobin concentration measured by near-infrared spectroscopy,” Phys. Med. Biol. 52(20), 6295–6322 (2007). 10.1088/0031-9155/52/20/014 [DOI] [PubMed] [Google Scholar]
- 23.Zhang H. F., et al. , “Imaging of hemoglobin oxygen saturation variations in single vessels in vivo using photoacoustic microscopy,” Appl. Phys. Lett. 90, 053901 (2007). 10.1063/1.2435697 [DOI] [Google Scholar]
- 24.Wang J., et al. , “Assessment of optical clearing induced improvement of laser speckle contrast imaging,” J. Innov. Opt. Health Sci. 3(3), 159–167 (2010). 10.1142/S1793545810001052 [DOI] [Google Scholar]
- 25.Cho B., et al. , “Linear response range characterization and in vivo application of laser speckle imaging of blood flow dynamics,” J. Biomed. Opt. 11(4), 041129 (2006). 10.1117/1.2341196 [DOI] [PubMed] [Google Scholar]
- 26.Seong M., et al. , “Simultaneous blood flow and blood oxygenation measurements using a combination of diffuse speckle contrast analysis and near-infrared spectroscopy,” J. Biomed. Opt. 21(2), 027001 (2016). 10.1117/1.JBO.21.2.027001 [DOI] [PubMed] [Google Scholar]
- 27.Re R., et al. , “Multi-channel medical device for time domain functional near infrared spectroscopy based on wavelength space multiplexing,” Biomed. Opt. Express 4(10), 2231–2246 (2013). 10.1364/BOE.4.002231 [DOI] [PMC free article] [PubMed] [Google Scholar]
- 28.Nioka S., et al. , “A novel method to measure regional muscle blood flow continuously using NIRS kinetics information,” Dyn. Med. 5, 5 (2006). 10.1186/1476-5918-5-5 [DOI] [PMC free article] [PubMed] [Google Scholar]
- 29.Jeon M. Y., et al. , “High-speed and wide bandwidth Fourier domain mode-locked wavelength swept laser with multiple SOAs,” Opt. Express 16(4), 2547–2554 (2008). 10.1364/OE.16.002547 [DOI] [PMC free article] [PubMed] [Google Scholar]
- 30.Oh W. Y., et al. , “Wide tuning range wavelength-swept laser with two semiconductor optical amplifiers,” IEEE Photonics. Technol. Lett. 17(3), 678–680 (2005). 10.1109/LPT.2004.841003 [DOI] [PMC free article] [PubMed] [Google Scholar]


