Abstract
Type 2 diabetes has become an epidemic disease largely explained by the dramatic increase in obesity in recent years. Mitochondrial dysfunction is suggested as an underlying factor in obesity and type 2 diabetes. In this study, we evaluated changes in oxidative phosphorylation and mitochondrial biogenesis in a new human obesity and type 2 diabetes model, TALLYHO/Jng mice. We hypothesized that the sequence variants identified in the whole genome analysis of TALLYHO/Jng mice would affect oxidative phosphorylation and contribute to obesity and insulin resistant phenotypes. To test this hypothesis, we investigated differences in the expression and activity of oxidative phosphorylation complexes, including the transcription and translation of nuclear- and mitochondrial-encoded subunits and enzymatic activities, in the liver and kidney of TALLYHO/Jng and C57BL/6 J mice. A significant decrease was observed in the expression of nuclear- and mitochondrial-encoded subunits of complex I and IV, respectively, in TALLYHO/Jng mice, which coincided with significant reductions in their enzymatic activities. Furthermore, sequence variants were identified in oxidative phosphorylation complex subunits, a mitochondrial tRNA synthetase, and mitochondrial ribosomal proteins. Our data suggested that the lower expression and activity of oxidative phosphorylation complexes results in the diminished energy metabolism observed in TALLYHO/Jng mice. Sequence variants identified in mitochondrial proteins accentuated a defect in mitochondrial protein synthesis which also contributes to impaired biogenesis and oxidative phosphorylation in TALLYHO/Jng mice. These results demonstrated that the identification of factors contributing to mitochondrial dysfunction will allow us to improve the disease prognosis and treatment of obesity and type 2 diabetes in humans.
Keywords: TALLYHO/Jng mice, Mitochondrial biogenesis, Oxidative phosphorylation, Mitochondrial ribosomal proteins, Type 2 diabetes
1. Introduction
Diabetes and obesity are two of the major metabolic diseases worldwide that are becoming an epidemic due to an increase in sedentary lifestyles. Type 2 diabetes (T2D) accounts for at least 90% of the diabetic cases and is commonly associated with an increased risk for morbidity and mortality (Bouret et al., 2015; Romao and Roth, 2008). The etiology of obesity and T2D involves complex interactions of several susceptibility genes and environmental factors, making disease prevention difficult (Bouret et al., 2015; Romao and Roth, 2008). Animal models with both physiologic and genetic similarities to humans have become valuable resources for obesity and T2D studies; however, to date, only a few polygenic animal models exist (Rees and Alcolado, 2005). Recently, TALLYHO/Jng (TH) mice were developed as models for human obesity and type 2 diabetes (Kim et al., 2001). The polygenic pattern of inheritance in TH mice closely resembles the genetic inheritance in humans, making these mice ideal models for the identification of underlying molecular defects in diabetes and obesity related abnormalities (Grarup et al., 2014; Kim and Saxton, 2012).
TH mice encompass many aspects of the human T2D condition and are characterized by obesity, glucose intolerance, insulin resistance, hyperinsulinemia, hyperlipidemia, and hyperglycemia (in male mice) (Kim et al., 2006, 2005). Additionally, these mice are also accompanied by lower energy expenditure and locomotor activity (Mao et al., 2014). Previous studies have suggested that the diet is an important modulator of susceptibility to obesity and T2D when TH mice are fed a high fat diet (Parkman et al., 2016). Interestingly, the diabetic condition was ameliorated, and metabolic flexibility was significantly improved in TH mice treated with Bezafibrate (BEZ), a pan PPAR (peroxisome proliferator-activated receptor) activator (Franko et al., 2017). Several mapping studies were performed to identify significant quantitative trait loci (QTLs) that are linked to the obesity, diabetes, and hyperlipidemia phenotypes present in TH mice (Kim et al., 2005; Stewart et al., 2010; Parkman et al., 2017). Additionally, whole genome sequencing was also performed to identify causal variants of underlying metabolic diseases found in this animal model (Denvir et al., 2016).
Mitochondrial dysfunction, including impaired mitochondrial biogenesis, was established as a contributing factor to insulin resistance in obesity and T2D (Kelley et al., 2002; Patti et al., 2003; Petersen et al., 2003). Mitochondrial biogenesis relies on the coordinated regulation of both nuclear and mitochondrial protein expression for energy metabolism via oxidative phosphorylation (OXPHOS). In mammals, mitochondrial biogenesis is regulated by PPAR coactivator-1 alpha (PGC-1α), a transcriptional coactivator that interacts with nuclear respiratory factor 1 (NRF-1) and stimulates the transcription of nuclear-encoded mitochondrial genes (Patti et al., 2003; Mootha et al., 2003; Heilbronn et al., 2007). A coordinated reduction of PGC-1α and its responsive gene, NRF-1, were correlated with obesity, insulin resistance, and T2D (Patti et al., 2003; Mootha et al., 2003; Heilbronn et al., 2007; Skov et al., 2007). Lower expression of each of the five mitochondrial OXPHOS complexes, including the mitochondrial-encoded subunit of complex IV, cytochrome c oxidase I (COI), was shown in subjects with acquired obesity and insulin resistance (Heinonen et al., 2015; Morino et al., 2005; Perks et al., 2017). Interestingly, one of the most common pathogenic mutations in the mitochondrial genome that is linked to T2D was found in the mitochondrial-encoded tRNA (Leu, UUR), which led to a defect in oxidative phosphorylation (Esterhuizen et al., 2019) in patients with impaired insulin secretion (Maassen et al., 2004; van den Ouweland et al., 1992).
The mitochondrial genome codes for 13 polypeptides that are essential subunits of OXPHOS complexes, two ribosomal RNAs (rRNAs), and 22 transfer RNAs (tRNAs). These essential subunits are synthesized by the mitochondrial transcription and translation machinery, which also contribute to the impaired mitochondrial biogenesis identified in obesity and T2D. Studies have demonstrated that the haploinsufficiency of pentatricopeptide repeat domain 1 (PTCD1) and the altered expression and/or mutation of mitochondrial ribosomal proteins (MRPs) led to reduced mitochondrial energy metabolism via decreased RNA processing, impaired mitochondrial protein synthesis, and the diminished expression of OXPHOS complexes in obesity, insulin resistance, and T2D (Heinonen et al., 2015; Perks et al., 2017; Bains et al., 2004; Rong et al., 2007). Additionally, the mitochondrial elongation factor Tu (EF-Tu) was also identified as a possible factor responsible for impaired mitochondrial biogenesis following exercise in an obese state (Greene et al., 2014) and has been recognized as one of the mitochondrial genes most connected to the insulin signaling cascade (Mercader et al., 2012). Taken together, these studies suggest that impaired mitochondrial biogenesis, including diminished mitochondrial protein synthesis, may lead to the metabolic disturbances that are characteristic of obesity, insulin resistance, and T2D. However, we still lack a thorough understanding of mitochondrial biogenesis and the contribution of mitochondrial protein synthesis and oxidative phosphorylation in obesity and T2D.
In this study, we investigated mitochondrial biogenesis, including the expression of nuclear- and mitochondrial-encoded subunits of OXPHOS complexes and mitochondrial translation machinery, in mitochondrial rich liver and kidney tissues of TH and C57BL/6 J (B6) mice. We discovered reduced expression of nuclear-encoded subunits of OXPHOS complex I, NADH:ubiquinone oxidoreductase subunit B8 (NDUFB8) and NADH:ubiquinone oxidoreductase core subunit S2 (NDUFS2), and mitochondrial-encoded subunits of OXPHOS complex IV, COI and cytochrome c oxidase II (COII), along with diminished activities of the corresponding complexes. Furthermore, we identified sequence variants in NDUFS2, mitochondrial aspartyl-tRNA synthetase 2 (DARS2), and several MRPs in the whole genome sequence database of TH mice previously published (Denvir et al., 2016). The potential contribution of these sequence variants on mitochondrial biogenesis and oxidative phosphorylation is also discussed. Our study strongly indicates that impaired mitochondrial biogenesis could be one of the reasons for the lower mitochondrial oxidative energy metabolism in TH mice.
2. Materials and methods
2.1. TALLYHO/Jng and C57BL/6J tissue samples
Liver (18–20 weeks old) and kidney (25–27 weeks old) tissues were collected from male TH and B6 mice fed standard rodent chow (Purina 5001, PMI Nutrition, Brentwood, MO, USA). Breeding of TALLYHO/Jng mice was established as previously described (Kim and Saxton, 2012; Mao et al., 2014) and all animal studies were carried out with the approval of Marshall University Animal Care and Use Committee.
2.2. Western blot analyses
Tissue lysates from the liver of TH and B6 mice (n = 5 in each group) and the kidney of TH (n = 3) and B6 (n = 5) mice were obtained by sonication of samples in RIPA buffer containing 50 mM Tris-HCl (pH 7.6), 150 mM NaCl, 1mM EDTA, 1mM EGTA, 1% NP40, 0.1% SDS, 0.5% DOC, 1 mM PMSF, and protease and phosphatase inhibitor cocktails (Abeam, Cambridge, MA). Protein concentration of tissue lysates was determined using the bicinchoninic (BCA) protein assay (Pierce, Rockford, USA). Protein lysates were separated by 12% SDS-PAGE, and the gels were stained with Coomassie brilliant blue to ensure equal protein loading. The lysates (5–40 μg) were then separated by 12% SDS-PAGE, transferred to nitrocellulose membranes (Bio-Rad, Richmond, VA), stained with Ponceau S to check for equal protein loading, and blocked with Tris-buffered saline (TBS) containing 0.05% Tween-20 (TBST), 5% (w/v) dry skim milk powder, and 1% BSA. Membranes were incubated with primary antibodies overnight against the following proteins: OXPHOS cocktail from Mitosciences (Eugene, OR); ATP6 and COII from Abeam (Cambridge, MA); COI, NDUFS2, NRF-1, TFAM, and citrate synthase from Santa Cruz (Dallas, TX); SDHA from Novus Biologicals (Littleton, CO); GAPDH from Fitzgerald Industries International Inc. (Acton, MA); PDH, PEPCK, and PDHK1 from Cell Signaling Technology (Danvers, MA); MRPS29 and HSP60 from BD Biosciences (San Jose, CA); MRPL11 and MRPS18-B from Sigma Aldrich (St. Louis, MO); DARS2 from Proteintech (Rosemont, IL); and MRPL15 and EF-Tu were a kind gift from Dr. Linda Spremulli. The protein immunoreactivity was detected using the ECL chemiluminescent kit from Amersham (GE Healthcare Life Sciences, Marlborough, MA), and the membranes were developed per the manufacturer’s protocol. UN-Scan-It (Silk Scientific, Inc, Orem, UT) and ImageJ (Schneider et al., 2012) were used to quantify the protein band intensities detected by Western blot analyses. The quantified values were normalized to the protein loading determined by Ponceau S staining and GAPDH probing of each membrane. The expression of each protein was quantified from each mouse sample from at least three independent experiments. The data are the mean ± SD for each mouse strain, and the results are expressed as a percentage of B6 mice.
2.3. Mitochondrial complex activity assays
Protein lysates used in the activity assays for mitochondrial OXPHOS complexes were prepared in a buffer containing 10 mM Tris-HCl (pH 7.0), 250 mM sucrose, and phosphatase and protease inhibitor cocktails. For complex I and III enzymatic activity assays, liver and kidney protein lysates were further diluted in a 50 mM potassium phosphate (pH 7.5) buffer containing 1 mg/mL BSA, 1 mM potassium cyanide, and 100 μM cytochrome c. The protein concentration was determined by using the BCA protein assay and protein amounts were normalized with Coomassie brilliant blue stained gels. The reactions were started by adding 200 μM NADH and the combined complex I and III assay was determined spectrometrically by measuring the reduction of cytochrome c at 550 nm for 6 min. Each sample was run in triplicate (technical replicates) and each assay was run at least three times (biological replicates). The average absorbance values were calculated for both technical and biological replicates and were graphed against the time points to determine the linear range of the assay. The rate of cytochrome c reduction was then calculated by a time-dependent change in the absorbance at the selected time point for each TH and B6 sample using the formula: Rate = (Abs 1 - Abs 2) / (Time 1 - Time 2). The data are the mean ± SD for each mouse strain and the results are presented as a percentage of B6 mice.
Briefly, liver and kidney lysates for the complex IV enzymatic activity assay were further diluted in a 50 mM phosphate buffer (pH 7.4) containing 1 mM EDTA and 100 μM reduced cytochrome c. The complex IV activity was also measured spectrometrically by monitoring the oxidation of cytochrome c at 550 nm, as previously described (Birch-Machin and Turnbull, 2001). The rate of cytochrome c oxidation was calculated as described above for the complex I and III assay.
2.4. Quantitative real-time polymerase chain reaction (qRT-PCR)
Total RNA was extracted from liver and kidney tissues in the presence of TRIzol (Invitrogen, Carlsbad, CA) and converted to cDNA with the high capacity cDNA reverse transcription kit using random primers (Applied Biosystems, Inc., Foster City, CA). Quantitative real-time PCR (qRT-PCR) was carried out using the PowerUp SYBR green master mix (Applied Biosystems, Inc.), and samples were run on an Applied Biosystems Step One Plus instrument. The relative expression values were calculated using the ΔΔCt method for both biological and technical replicates (Schmittgen and Livak, 2008). The transcript expression values were normalized to GAPDH as the control. Results were presented as a percentage of B6 mice. The following sequences were used as primers: 16S rRNA forward 5′-TGAACGGCTAAACGAGGGTC-3′ and reverse 5′-TATTCTCCGAGGTCACCCCAA-3′; ND6 forward 5′-TATATT GCCGCTACCCCAATCC-3′ and reverse 5′-ATCCAGAGACTTGGGGA TCT-3′; Cyt b forward 5′-TGCATACGCCATTCTACGCT-3′ and reverse 5′-TGGGTGTTCTACTGGTTGGC-3′; COI forward 5′-TCGGAGCCCCAGA TATAGCA-3′ and reverse 5′-TTTCCGGCTAGAGGTGGGTA-3′; ATP6 forward 5′-ATCCACACACCAAAAGGACGA-3′ and reverse 5′-GGAAGTGGGCAAGTGAGCTT-3′; and GAPDH forward 5′-GGTGAAGGTCGGTG TGAACG-3′and reverse 5′-CTCGCTCCTGGAAGATGGTG-3′.
2.5. Statistical analysis
Statistical analyses were performed using GraphPad Prism 6.07. Statistically significant differences between TH and B6 mice were detected using unpaired Student’s t-tests (2-tailed). All data are expressed as the mean ± SD, unless otherwise stated.
3. Results
3.1. Mitochondrial oxidative phosphorylation is impaired in TH mice
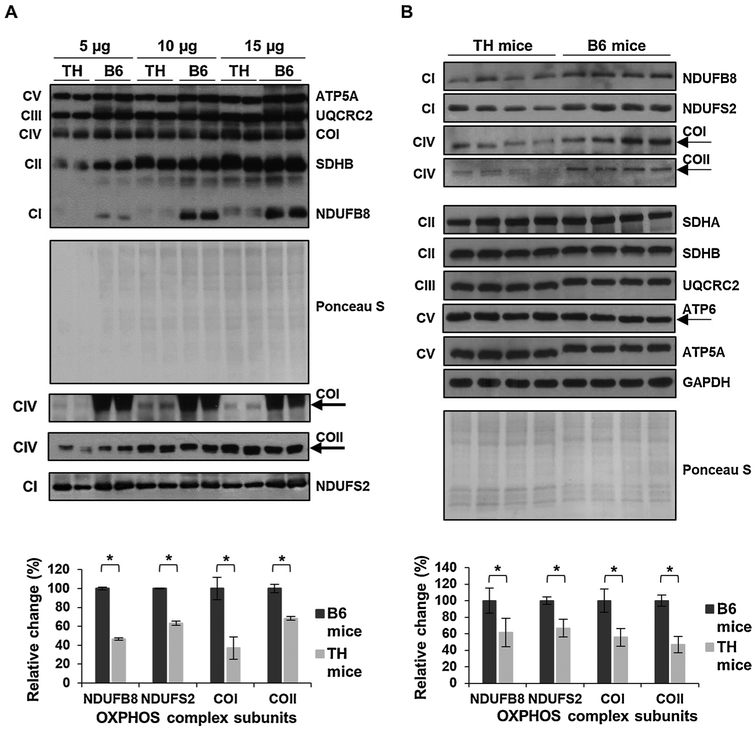
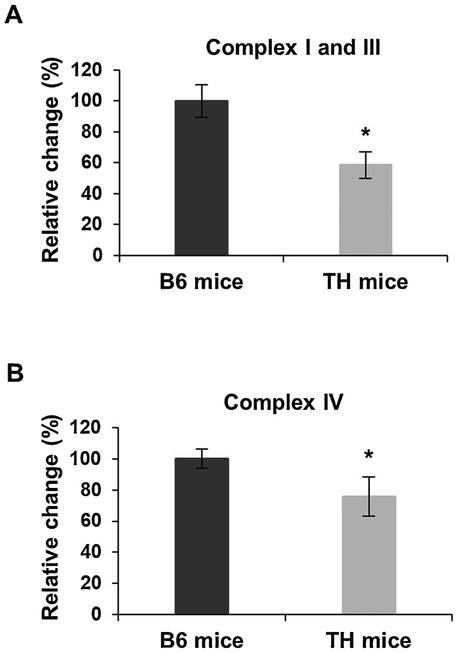
Mitochondrial dysfunction was recognized as one of the key underlying factors in the development of T2D and identified as a contributing factor to T2D-dependent liver and renal failure (de Boer et al., 2011; El-Serag et al., 2004). In the initial characterization studies of TH mice, altered energy balance was reported (Mao et al., 2014). Furthermore, data mining of the whole genome sequencing analysis revealed the presence of several missense variants in the genes of nuclear-encoded OXPHOS complexes I and II, Ndufs2 and Sdhc, respectively (Parkman et al., 2017). To determine changes in mitochondrial energy metabolism in this mouse model, we compared the expression and activity of mitochondrial OXPHOS complexes in the liver (Figs. 1 and 2) and kidney tissues (Figs. 3 and 4) of TH and B6 mice due to the high energy demands in these organs. We first evaluated the steadystate expression of OXPHOS complexes by Western blot analyses using antibodies raised against several subunits at varying protein amounts to determine the optimal amount for the consistent detection of OXPHOS subunits in the liver (Fig. 1A) and kidney (Fig. 3A) of several tissues in both mouse strains. In the liver samples initially analyzed, the expression of nuclear-encoded subunits of complex I, NDUFB8 and NDUFS2, and the mitochondrial-encoded subunits of complex IV, COI and COII, was significantly lower at varying protein amounts in TH mice (Figs. 1A and SI). The consistent detection of diminished OXPHOS subunit expression was observed at 15 μg (Fig. 1A) with significantly decreased expressions of NDUFB8, NDUFS2, COI, and COII by approximately 55%, 40%, 60%, and 30%, respectively (Fig. 1A, bottom panel). Therefore, the remainder of the liver samples were run at this optimal protein amount. Similar to Fig. 1A, significant reductions were observed in the expression of NDUFB8 and NDUFS2 by roughly 40% and 35%, respectively, in the liver of TH mice (Fig. 1B, p = 0.0002 and P = 0.0001). The mitochondrial-encoded subunits of complex IV, COI and COII, were also decreased by 45% and 55%, respectively (Fig. 1B, p = 0.001). On the other hand, the expression of complex II subunits, SDHA and SDHB (P = 0.4303 and P = 0.3027), complex III subunit, UQCRC2 (P = 0.1881), and complex V subunits, ATP5A and ATP6 (P = 0.1790 and P = 0.2233), was comparable between the two mouse strains (Figs. 1B and S2A). The changes in expression of OXPHOS complex subunits were normalized to the Ponceau S staining and GAPDH probing of the membranes (Figs. 1 and S2B). To determine the effect of the impaired NDUFB8, NDUFS2, COI, and COII expressions on oxidative phosphorylation activity and energy metabolism, we performed complex I and III and complex IV enzymatic activity assays. As shown in Fig. 2A, the complex I and III enzymatic activity was significantly decreased by about 42% (P = 0.0001) in TH mice. Furthermore, a reduction of 25% (P = 0.0003) was clearly observed in the activity of complex IV (Fig. 2B). An example of the calculation used to determine the difference in enzymatic activities of OXPHOS complexes is described in the Materials and Methods and demonstrated in Fig. S3. The diminished activity of OXPHOS complexes I, III, and IV coincided with the significantly lower expression of the NDUFB8, NDUFS2, COI, and COII subunits in the TH mice liver.
Fig. 1.
Mitochondrial OXPHOS is impaired in TH mice liver. A) To determine the linear response range of the antibodies, the expression of OXPHOS subunits NDUFB8 and NDUFS2 (complex I), SDHA and SDHB (complex II), UQCRC2 (complex III), COI and COII (complex IV), and ATP5A and ATP6 (complex V) was detected at varying protein amounts by Western blot analyses of TH and B6 mice liver lysates (n = 2 in each group). The average quantitative analyses of the protein bands (15 μg) by densitometry are shown in the bottom panel. B) The expression of OXPHOS complexes in TH and B6 mice liver (n = 4 in each group). The graph (bottom panel) represents the average quantitative analyses of the OXPHOS complex subunits with significant changes from each mouse strain at the optimal protein amount determined in A. The mitochondrial-encoded subunits COI, COII, and ATP6 are marked by arrows. Approximately 5–30 μg of protein lysate was separated by 12% SDS-PAGE and equal protein loading was evaluated by Ponceau S staining and GAPDH probing of the membranes. Results represent the mean ± SD of at least three experiments for each mouse strain and are presented as a percentage of B6 mice. Significant difference was observed between B6 and TH mice using an unpaired Student’s t-test (2-tailed), *P < 0.05.
Fig. 2.
Mitochondrial complex I and III and IV activities are lower in TH mice liver. A) Combined complex I and III activity was determined by measuring cytochrome c reduction spectrometrically at 550 nm using equal amounts (~10 μg) of TH and B6 mice liver lysates. B) The rate of cytochrome c oxidation at 550 nm was determined as the complex IV activity using equal amounts (~20 μg) of liver lysates for both mouse strains. The data are the mean ± SD of at least three experiments for both mouse strains. Results are represented as a percentage of B6 mice. Significant difference was observed between B6 and TH mice using unpaired Student’s t-tests (2-tailed), *P < 0.05.
Fig. 3.
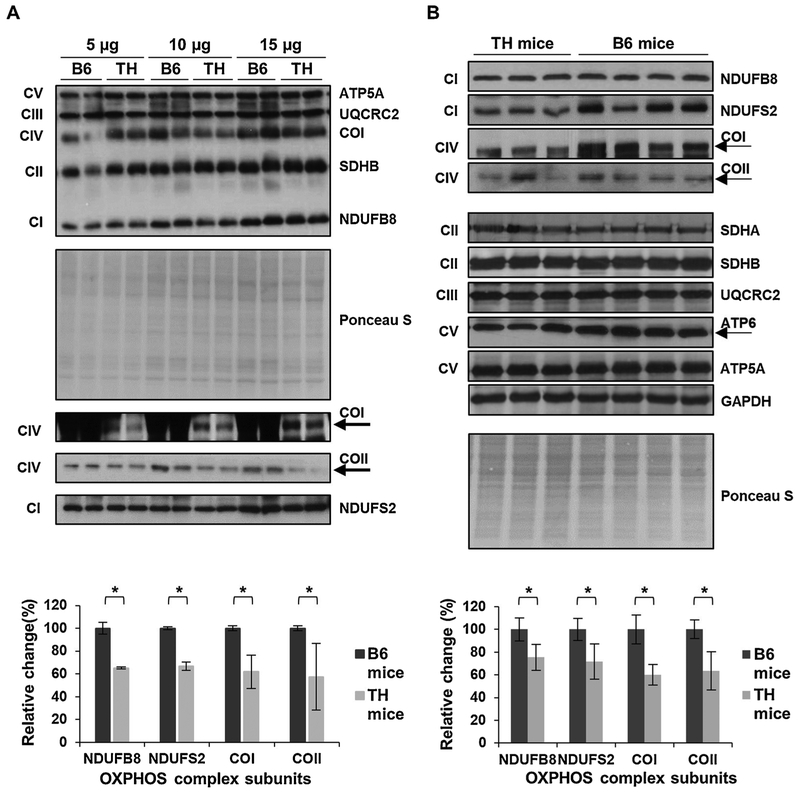
Mitochondrial OXPHOS is reduced in TH mice kidney. A) The expression of OXPHOS subunits in TH and B6 kidney tissue lysates (n = 2 in each group) was evaluated at various protein amounts by Western blot analyses and Ponceau S staining. The average quantitative analyses by densitometry of OXPHOS subunits using 15 μg total protein lysate is shown in the bottom panel. B) Western blots of the OXPHOS subunit expression in TH (n = 3) and B6 (n = 4) mice kidney lysates. The graph in the bottom panel represents the average quantitative analysis of OXPHOS subunits with significant changes at the optimal protein amount determined in A. The expression of mitochondrial-encoded subunits COI, COII, and ATP6 are marked by arrows. Results represent the mean ± SD of at least three experiments for each mouse strain and are presented as a percentage of B6 mice. Significant difference was observed between the mouse strains using unpaired Student’s t-tests 12-tailed), *P < 0.05. See Fig. 1 legend for details.
Fig. 4.
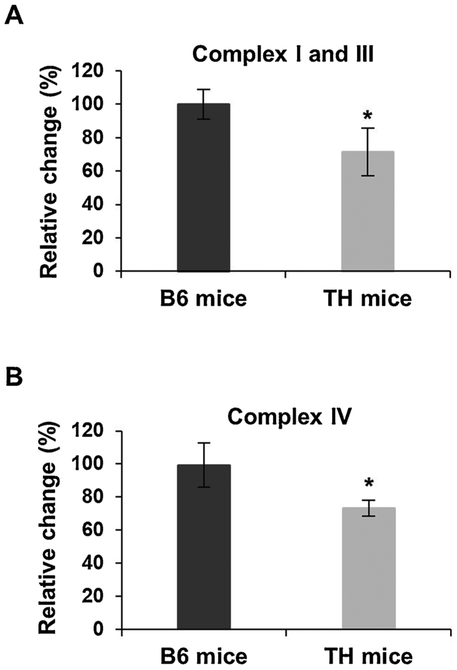
Mitochondrial complex I and III and IV activities are diminished in the kidney of TH mice. A) Combined complex I and III activity was determined by spectrometrically measuring the rate of cytochrome c reduction at 550 nm in TH and B6 mice kidney lysates. B) Complex IV activity was measured by the oxidation of cytochrome c at 550 nm in the kidney lysates. Results represent the mean ± SD of at least three experiments for each mouse strain and are expressed as a percentage of B6 mice. P-values were calculated using unpaired Student’s t-tests (2-tailed), *P < 0.05. See Fig. 2 legend for details.
Similar to the results obtained with liver tissues, the biggest difference between TH and B6 mice kidney samples was observed in the expression of OXPHOS complexes I and IV (Fig. 3A and B). As shown in Figs. 3A and S4, the expression of NDUFB8, NDUFS2, COI, and COII were significantly lower at varying protein amounts in the TH kidney, with the optimal and consistent detection at 15 μg, similar to the liver lysates. Reductions of approximately 25% and 30% were detected in the expression of nuclear-encoded NDUFB8 and NDUFS2 subunits, respectively (P = 0.0014 and P = 0.0009), followed by a 40% decrease in the expression of mitochondrial-encoded complex IV subunits, COI and COII (P = 0.001 and P = 0.0008), in TH mice kidney (Fig. 3B). The expression of complex II and III subunits was comparable in the kidney of TH and B6 mice (Fig. 3B, P = 0.2609 and P = 0.9736 and Fig. S5A). The nuclear-encoded subunit of complex V, ATP5A, also had a similar expression between the two mouse strains (P = 0.5741); however, the expression of the mitochondrial-encoded subunit of complex V, ATP6, was slightly lower in the TH mice kidney samples although not significant (Fig. 3B, p = 0.2464 and Fig. S5A). The changes observed in the expression of OXPHOS complex subunits were normalized to both the Ponceau S membrane staining and the expression of GAPDH (Figs. 3 and S5B). We also performed OXPHOS complex activity assays to determine the effect of the lower expression of OXPHOS complexes I and IV on oxidative phosphorylation function in the kidney of these mice. Significant decreases of roughly 30% (P = 0.0113) and 27% (P = 0.0005) were observed in the activities of complexes I and III (Fig. 4A) and complex IV (Fig. 4B), respectively, in the TH mice compared to the B6 mice. These diminished activities of OXPHOS complexes were associated with the reduced expression of their subunits. Together, our findings show significant decreases in oxidative phosphorylation complex expression and activity which implies mitochondrial energy metabolism is impaired in both the liver and the kidney of TH mice.
3.2. Citrate synthase expression is elevated in TH mice
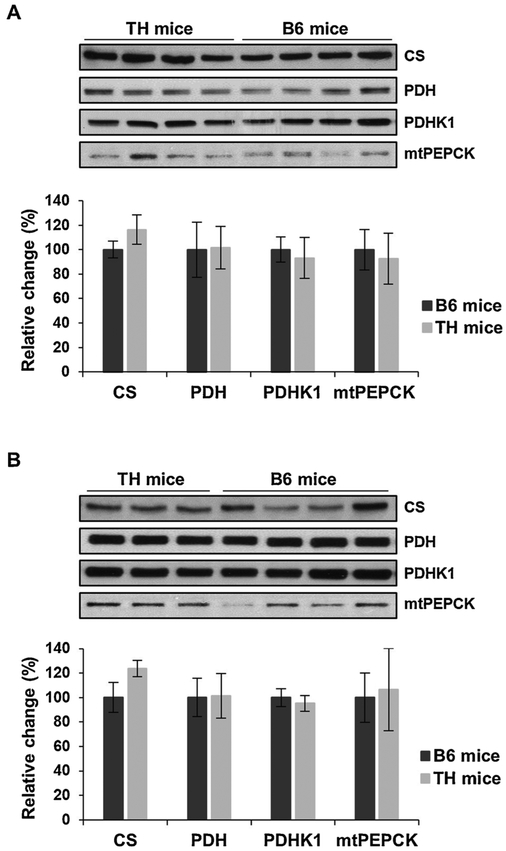
Above, we demonstrated that oxidative phosphorylation is significantly impaired in TH mice (Figs. 1–4). To further evaluate this decrease, we assessed the expression of several crucial metabolic enzymes that control OXPHOS by regulating the citric acid cycle (CAC) and gluconeogenesis, including citrate synthase (CS), pyruvate dehydrogenase (PDH), pyruvate dehydrogenase kinase 1 (PDHK1), and mitochondrial phosphoenolpyruvate carboxykinase (mtPEPCK). Interestingly, the expression of CS was increased by approximately 20–25% in the liver (Fig. 5A) and kidney (Fig. 5B) of TH mice. CS is one of the major checkpoints for the CAC and the increase in its expression suggests that the CAC activity is elevated in TH mice. Since CS expression is higher, we further analyzed other metabolic pathways that converge onto the CAC cycle. The expression of mtPEPCK, an enzyme that regulates the rate-controlling step of gluconeogenesis is comparable between the TH and B6 mice in the liver (Fig. 5A) but has a slight increase in expression in the kidney (Fig. 5B) of TH mice indicating that gluconeogenesis may be slightly higher. Little difference was observed in the expression of PDH and PDHK1, two critical enzymes involved in the regulation of pyruvate metabolism, in TH mice liver (Fig. 5A) and kidney (Fig. 5B) mitochondria. These findings imply that pyruvate metabolism and gluconeogenesis functions are comparable in both tissues of the two mouse strains and are not largely responsible for the increase in CS expression. Our results suggest that the lower oxidative metabolism in TH mice is not caused by diminished activities of other metabolic pathways that regulate OXPHOS complexes. Rather, the decrease is due to the reduced expression of OXPHOS complexes I and IV, possibly by a defect in nuclear and mitochondrial protein synthesis.
Fig. 5.
Citrate synthase is increased in TH mice liver and kidney. A) The expression of various crucial metabolic enzymes involved in the citric acid cycle and gluconeogenesis, including citrate synthase (CS), pyruvate dehydrogenase (PDH), pyruvate dehydrogenase kinase 1 (PDHK1), and mitochondrial phosphoenolpyruvate carboxykinase (mtPEPCK), was assessed in TH and B6 mice liver and kidney (B) by Western blot analyses. The quantitative analyses of metabolic enzymes by densitometry were normalized to the expression of GAPDH and Ponceau S stained membranes (bottom panels) as equal loading controls. Results are expressed as the mean ± SD of at least three experiments for each mouse strain and presented as a percentage of B6 mice. Unpaired Student’s t-tests (2-tailed) were performed to for statistical analyses and no significant difference was observed between TH and B6 mice.
3.3. Mitochondrial transcription machinery and translation components remain unaltered in TH mice
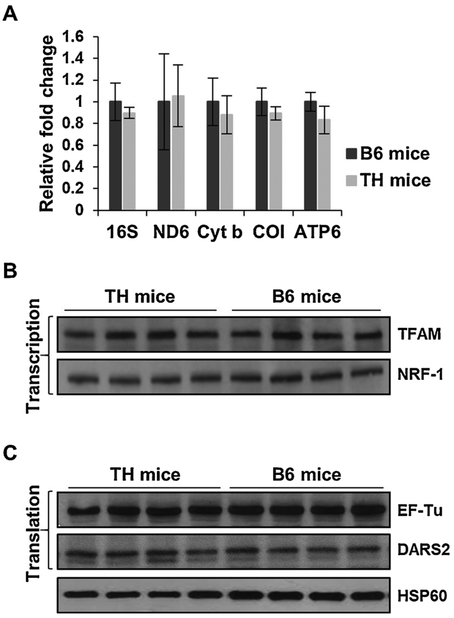
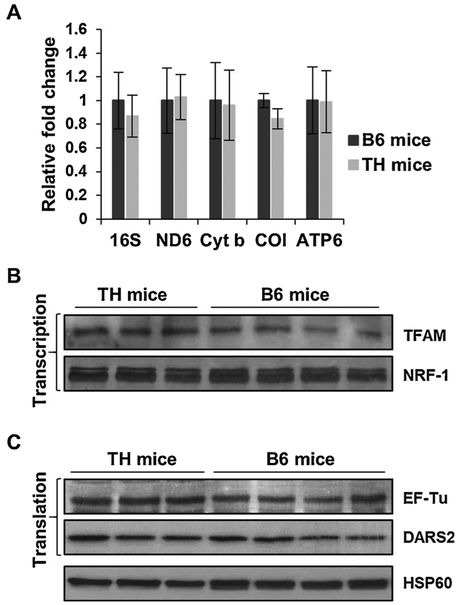
In mammals, OXPHOS complexes are encoded by approximately 85 nuclear and 13 mitochondrial genes. Mitochondrial biogenesis, mainly via transcription and translation of these genes, is essential for energy generation by oxidative phosphorylation. We observed a diminished protein expression of OXPHOS subunits NDUFB8, NDUFS2, COI, and COII in the liver and kidney of TH mice (Figs. 1 and 3). Since COI and COII are two of the 13 crucial mitochondrial-encoded subunits, we performed quantitative RT-PCR analyses on several mitochondrial-encoded transcripts to determine if a defect is present in the expression of mitochondrial genes in TH mice. Despite a lower protein expression of COI in the liver (Fig. 1) and kidney (Fig. 3) of TH mice, the mRNA expression of COI was comparable in both tissues between the two mouse strains (Figs. 6A and 7 A). Furthermore, minor reductions were observed in the mRNA expression of mitochondrial-encoded 16S rRNA and OXPHOS subunits ND6 (complex I), cyt b (complex III), and ATP6 (complex V) between the TH and B6 mice liver (Fig. 6A) and kidney (Fig. 7A). To further evaluate this slight reduction, we performed Western blot analyses to assess the protein expression of two major transcription factors responsible for the synthesis of both mitochondrial- and nuclear-encoded proteins. The expression of mitochondrial transcription factor A (TFAM) and NRF-1 was comparable between TH and B6 mice in both the liver (Fig. 6B) and kidney (Fig. 7B). These results suggest that changes in the expression of mitochondrial transcription factors is not responsible for the slight reduction observed in the mitochondrial-encoded transcripts and further implies that there is no defect in the mitochondrial transcription of TH mice.
Fig. 6.
Mitochondrial transcription and translation are comparable between TH and B6 mice liver. A) Relative changes in mitochondrial transcripts, including 16S rRNA (39S subunit), ND6 (complex I), cyt b (complex III), COI (complex IV), and ATP6 (complex V) were determined by quantitative RT-PCR and reported as fold changes with respect to GAPDH mRNA expression in the liver of TH and B6 mice. Results represent the mean ± SD of at least three experiments for each mouse strain. Unpaired Student’s t-tests (2-tailed) were performed for statistical analyses and no significant difference was shown between TH and B6 mice. B) Expression of mitochondrial transcription factors, TFAM and NRF-1, and translation factors, EF-Tu and DARS2 (C), were evaluated in the liver of both mouse strains by Western blot analyses. Equal protein loading was determined by Ponceau S staining and probing membranes with mitochondrial matrix marker, HSP60.
Fig. 7.
Mitochondrial transcription and translation are unaltered in TH mice kidney. A) Relative changes in 16S rRNA and mitochondrial-encoded mRNA expression were determined by quantitative RT-PCR in the kidney of TH and B6 mice and reported as fold changes with respect to GAPDH mRNA expression as a control. Results represent the mean ± SD of at least three experiments for each mouse strain. B) The expression of mitochondrial transcription and translation (C) factors were evaluated in TH and B6 mice kidney by Western blot analyses. See Fig. 6 legend for details.
The minor differences found in the expression of mitochondrial-encoded rRNA/mRNA transcripts without changes in the expression of transcription factors, prompted us to analyze two essential mitochondrial translation factors, EF-Tu and DARS2, and ribosomal proteins that are responsible for the synthesis of the 13 mitochondrial-encoded proteins of the OXPHOS complexes in TH and B6 mice. Although EF-Tu has been associated with insulin signaling and the obesity phenotype (Greene et al., 2014; Mercader et al., 2012), the expression of EF-Tu in the obesity and insulin resistant TH mouse model is comparable to the B6 mice in both the liver (Fig. 6C) and kidney (Fig. 7C) tissues. In the whole genome sequencing analysis of TH mice, mitochondrial aspartyltRNA synthetase, DARS2, was shown to have a C370R mutation. Although this variant introduces a positively charged residue into the protein sequence in a highly conserved region, the difference in the expression of the mitochondrial DARS2, was negligible between the two mouse strains in both the liver and kidney (Figs. 6C and 7 C, respectively). Interestingly, this C370R variant is also found in Myotis licifugus (little brown bat) and Equus caballus (horse) sequences. Thus, the defect we observed in mitochondrial translation, indicated by the significantly diminished expression of mitochondrial-encoded COI and COII without changes in transcription, could not be exclusively dependent on the DARS2 variant.
3.4. Expression of mitochondrial ribosomal proteins are comparable
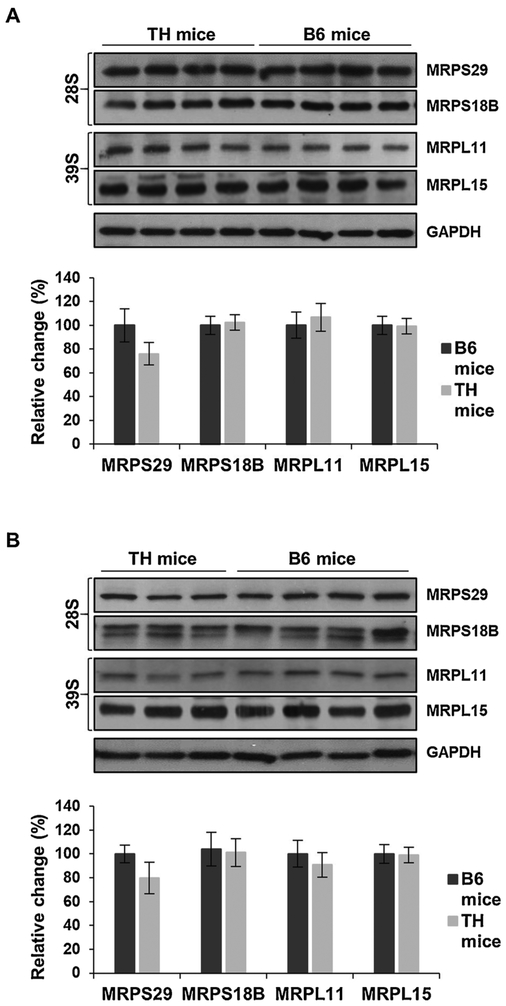
Mitochondrial ribosomes, 55S, are composed of small (28S) and large (39S) subunits with two mitochondrial encoded rRNAs, 12S and 16S, respectively, and approximately 80 nuclear-encoded ribosomal proteins (Koc et al., 2013). These MRPs are essential to the synthesis of the 13 mitochondrial-encoded subunits of OXPHOS complexes in mammals. To identify changes in MRPs that could contribute to the impaired protein synthesis in TH mice, we analyzed several MRPs in both the 28S (MRPS18B and MRPS29) and 39S (MRPL11 and MRPL15) ribosomal subunits by Western blot analyses (Fig. 8). The expression of the majority of the MRPs analyzed, MRPS18B, MRPL11, and MRPL15, were comparable between the TH and B6 mice in both tissues (Fig. 8A and B) relative to GAPDH as a loading control. Surprisingly, the expression of MRPS29 was approximately 20% lower in the TH mice in both the liver (Fig. 8A) and kidney (Fig. 8B); however, the decrease was not statistically significant (P = 0.0628 and P = 0.0558).
Fig. 8.
Mitochondrial ribosomal protein expression remains unchanged in TH and B6 mice. A) Relative expression of mitochondrial ribosomal proteins (MRPs) of the small (28S) and large (39S) subunits were detected in TH and B6 mice liver and kidney lysates (B) by Western blot analyses. The average quantitative analyses of MRPs in TH and B6 mice by densitometry were normalized to GAPDH and Ponceau S staining is shown in the bottom panels. Results represent the mean ± SD of at least three experiments from each mouse strain and are presented as a percentage of B6 mice. No statistical difference was shown between TH and B6 mice using unpaired Student’s t-tests (2-tailed). See Fig. 1 legend for details.
The slight reduction observed in the expression of MRPS29 encouraged us to search for MRP variants in the whole genome sequence database previously published (Denvir et al., 2016), which is archived at the Sequence Read Archive (SRA) at the National Center for Biotechnology Information (NCBI) via accession number SRP067703. Our data mining revealed the presence of 16 sequence variants in 11 MRPs in TH mice (Table 1). To predict the amino acid substitution on MRP function, the ‘Sorting Intolerant From Tolerant’ (SIFT) scores were calculated (Table 1). The majority of the SIFT scores for the MRP sequence variants identified were greater than 0.05, indicating that the variants were tolerated (Zerbino et al., 2018). The majority of significant amino acid replacements were found at the N-terminal signal sequences of MRPs (Table 1). One of the most remarkable variants was identified in MRPL20. The missense sequence variant found in MRPL20 caused the loss of a stop codon (Table 1), which introduces an additional nine amino acid residues into the protein sequence. The possible effect of this insertion at the C-terminus of MRPL20 is unknown. Although the sequence variants identified in mitochondrial ribosomal proteins in TH mice were possibly ineffective in altering the protein expression of other MRPs (Fig. 8A and B), the variants may still interfere with the translocation of MRPs into the mitochondria and the function of the ribosome.
Table 1.
Sequence variants of mitochondrial ribosomal proteins (MRPs) in TH mice (Denvir et al., 2016).
| Gene | AA B6/TH | AA position | UniProtKB | SIFT score |
|---|---|---|---|---|
| Mitochondrial ribosomal protein mutations | ||||
| MRPL20 | stop lost | 97 | Q9CQL4 | |
| MRPS11 | R/L | 13 | Q9DCA2 | 0.12 |
| L/R | 70 | 0.06 | ||
| MRPL22 | A/T | 4 | Q8BU88 | 0.26 |
| MRPL49 | L/F | 6 | Q9CQ40 | 1.00 |
| MRPL48 | I/V | 148 | Q8JZS9 | 1.00 |
| MRPS35 | T/S | 11 | Q8BJZ4 | 0.37 |
| C/Y | 216 | 1.00 | ||
| I/V | 293 | 1.00 | ||
| MRPL3 | I/T | 32 | Q99N95 | 0.48 |
| MRPL19 | C/R | 39 | Q9D338 | 0.35 |
| E/Q | 72 | 0.20 | ||
| MRPL39 | K/R | 133 | Q9JKF7 | 0.49 |
| V/A | 280 | 0.52 | ||
| MRPL55 | L/F | 19 | Q9CZ83 | 0.65 |
AA: amino acid. Mitochondrial ribosomal small (MRPS) and (MRPL) subunit proteins. Sorting intolerant from tolerant (SIFT) scores are shown to predict if the amino acid substitution is deleterious (SIFT < 0.05) or tolerated/neutral (Zerbino et al., 2018).
4. Discussion
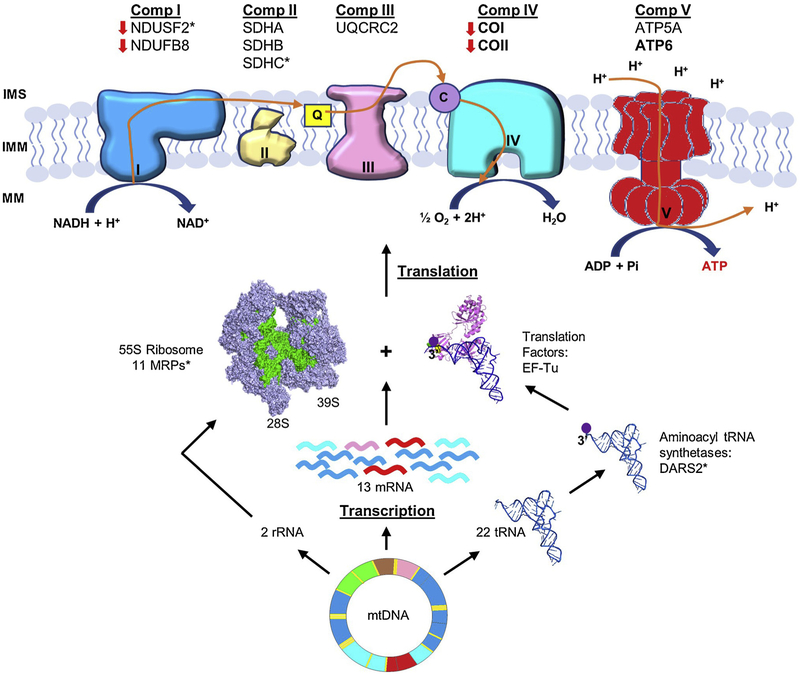
Obesity and T2D are two metabolic diseases that are becoming more prevalent worldwide. Recent evidence implies that mitochondrial dysfunction is an underlying defect in the development of obesity, insulin resistance, and T2D (Kelley et al., 2002; Patti et al., 2003; Petersen et al., 2003). The TH mouse has recently been developed as a polygenic model for obesity, insulin resistance, and T2D (Kim et al., 2001; Kim and Saxton, 2012). Metabolic characterization, gene mapping, and whole genome sequencing analyses of TH mice have revealed an altered energy balance (Mao et al., 2014; Parkman et al., 2016; Franko et al., 2017; Parkman et al., 2017); however, the mechanism is largely unknown. In this study, we evaluated mitochondrial biogenesis including the expression of mitochondrial- and nuclear-encoded OXPHOS complex subunits in mitochondrial rich tissues of TH and B6 mice. Additionally, we analyzed mitochondrial energy metabolism by observing changes in oxidative phosphorylation activity. In conjunction with the whole genome sequencing information, our results allowed us to correlate the biogenesis of OXPHOS complexes with mitochondrial translation, oxidative phosphorylation, and energy metabolism in TH mice (Fig. 9).
Fig. 9.
A schematic synopsis of OXPHOS and mitochondrial translation component variants found in TH mice. Mammalian mitochondria have a ~16.5 kb circular genome (mtDNA) that encodes two rRNAs, 22 tRNAs, and 13 mRNAs (nine monocistronic and two dicistronic). The mammalian mitochondrial 55S ribosome (28S and 39S subunits), are responsible for the synthesis of the 13 mitochondrial-encoded subunits of complexes I, III, IV, and ATP synthase (complex V). The expression of mitochondrial-encoded subunits COI, COII, and ATP6 detected in TH mice are bolded. The expression of nuclear-encoded mitochondrial OXPHOS complex subunits NDUFB8 and NDUFS2 (complex I), SDHA, SDHB, and SDHC (complex II), UQCRC2 (complex III), ATP5A (complex V) were also detected in TH mice. The expression of nuclear-encoded NDUFB8 and NDUFS2 and mitochondrial-encoded COI and COII were lower in TH mice, indicated by red arrows. Missense variants found in OXPHOS complexes, MRPs, and mitochondrial aspartyl-tRNA synthetase 2 (DARS2) in TH mice are shown by asterisks (*). Bovine mtEF-Tu (PDB #1XB2) and E. coil aminoacyl-tRNACys (PDB #IB23) were modeled to demonstrate the interaction of tRNA with mtEF-Tu and shown in violet and blue, respectively. The bovine 55S mammalian ribosome (PDB #3J9M) was also modeled and shown in light purple, with the mitochondrial rRNAs highlighted in green. (For interpretation of the references to colour in this figure legend, the reader is referred to the web version of this article).
One of our most compelling observations was the significant reduction in the expression of nuclear-encoded complex I subunits, NDUFS2 and NDUFB8, and mitochondrial-encoded complex IV subunits, COI and COII, which coincided with diminished enzymatic activities of these OXPHOS complexes in TH mice liver and kidney tissues (Figs. 1–4). Strikingly, NDUFS2 carries an R8G variant which is located within the mitochondrial targeting sequence in TH mice. This variant can interfere with the translocation of NDUFS2 into the mitochondria. In fact, NDUFS2 is one of the largest and highly conserved subunits in complex I and its mutations have resulted in the disruption of the subunit as well as an absence in the formation of the peripheral arm of complex I (Guenebaut et al., 1997). Complex I is the major entry point into the OXPHOS complexes and plays a pivotal role in mitochondrial energy metabolism. Several mutations found in complex I subunits and assembly factors were shown to cause a variety of clinical symptoms (Ugalde et al., 2004). For example, mutations in NDUFA4 caused a reduction in mitochondrial function, impaired insulin release in the pancreas, and led to the development of diabetes (Yagil et al., 2018). The diminished expression of NDUFS2 could disrupt the subunit, inhibit the assembly of the peripheral arm of complex I, impair its function, significantly lower mitochondrial oxidative phosphorylation and energy metabolism, and contribute to the obesity and insulin resistant phenotypes observed in TH mice.
In addition to defects in complex I, the reduced expression of mitochondrial-encoded COI and COII and the diminished activity of complex IV were evident in TH mice. Interestingly, the expression of complex IV is required for the assembly and stability of complex I (Diaz et al., 2006); therefore, the diminished expression of complex IV subunits may contribute to the reduced expression of complex I observed in TH mice. Previous studies have also shown a lower expression of COI in obesity and insulin-resistant subjects (Heinonen et al., 2015; Morino et al., 2005; Perks et al., 2017). These results further implied that metabolic alterations could lead to the development of obesity-related diseases, such as T2D, and may be caused by impaired mitochondrial biogenesis and oxidative phosphorylation, as demonstrated in TH mice. Mitochondrial biogenesis relies on the coordinated expression of both nuclear- and mitochondrial-encoded OXPHOS subunits for energy metabolism. More significantly, complexes I and IV consist of 10 of the 13 mitochondrial-encoded essential subunits synthesized by the mitochondrial translation machinery. Thus, their expression is more susceptible to the changes in mitochondrial protein synthesis. Although we observed minor differences in the expression of mitochondrial transcription and translation factors, the reduction in the expression of COI and COII subunits indicated that mitochondrial protein synthesis is impaired in TH mice. One of the possible candidates for the defect in mitochondrial translation was the DARS2 variant, C370R, identified in TH mice. The variant introduced a positive charge into a highly conserved region of DARS2 near the tRNA binding site, which can alter aminoacylation of mttRNAAsp and impair mitochondrial protein synthesis (Fig. 9). However, the presence of this variant in M. lucifugus and E. caballus DARS2 gene, demonstrated that the diminished mitochondrial protein synthesis observed in TH mice is not exclusively caused by the C370R conversion.
A negligible difference was observed in the expression of the majority of the MRPs analyzed, except a slightly lower expression of MRPS29 in TH mice. MRPS29 provides the only GTPase activity to the 28S subunit, making its expression essential for ribosome function and the regulation of mitochondrial protein synthesis (Cavdar Koc et al., 2001; O’Brien et al., 2005). Although the reduction observed in TH mice is not statistically significant, the decreased expression of MRPS29 can impair the ribosome assembly and function reducing protein synthesis and oxidative phosphorylation activity. The probability of defects in mitochondrial translation machinery compelled us to search for sequence variants in translation factors and MRPs in the whole genome sequence database of TH mice. The sequence variants found in 11 MRPs of TH mice were not predicted to be deleterious based on the SIFT scores (> 0.05) (Table 1). In fact, the majority of the variants were either at the less conserved N-terminus of the MRPs or the amino acid substitutions were conservative replacements with similar amino acid residues (Table 1). The variants at the N-terminus could interfere with the translocation of MRPs into the mitochondria, which may impair the assembly and function of the mitochondrial ribosome and inhibit protein synthesis. Perhaps the most compelling variant found in TH mice was in MRPL20. The loss of the stop codon and the nine-residue extension of MRPL20 may alter the folding, structure, and/or activity of the protein, in addition to its ability to interact with other MRPs in the mitochondrial ribosome. Moreover, these extra residues make MRPL20 a viable candidate for the defect found in mitochondrial protein synthesis contributing to impaired mitochondrial biogenesis and oxidative phosphorylation in TH mice.
5. Conclusions
In summary, our data clearly demonstrated a significant impairment of mitochondrial energy metabolism observed through a significant reduction in oxidative phosphorylation in TH mice. The sequence variants discussed in this study may be contributing factors to the diminished mitochondrial biogenesis by inhibiting protein synthesis in TH mice. Further studies need to be performed to determine the contribution of mitochondrial defects to the development of obesity, insulin resistance, and T2D in this animal model.
Supplementary Material
Acknowledgements
The authors would like to thank Dr. Linda Spremulli, UNC Chapel Hill for the mitochondrial EF-Tu antibody. We would like to acknowledge the Genomics and Bioinformatics Core (GABC) Facility at Joan C. Edwards School of Medicine, Marshall University for help with sequencing data. We also gratefully acknowledge Biomedical Sciences Department at Joan C. Edwards School of Medicine, Marshall University for its support.
Funding
This work was partly supported by National Institutes of Health to ECK [GM071034] and NASA WV Space Grant Consortium issued by NASA Goddard Space Flight Center [NNG05GF80H]. The GABC is supported by the WV-INBRE [P20GM103434], WV-CTSI [2U54GM104942], and the COBRE ACCORD [1P20GM121299] grants. JHK is funded by National Institutes of Health [1 R15 DK113604-01A1] and American Heart Association [18AIREA33960437].
Footnotes
Declaration of Competing Interest
The authors declare they have no conflict of interest.
Appendix A. Supplementary data
Supplementary material related to this article can be found, in the online version, at doi:https://doi.org/10.1016/j.biocel.2019.105616.
References
- Bains RK, Wells SE, Flavell DM, Fairhall KM, Strom M, Le Tissier P, Robinson IC, 2004. Visceral obesity without insulin resistance in late-onset obesity rats. Endocrinology 145, 2666–2679. [DOI] [PubMed] [Google Scholar]
- Birch-Machin MA, Turnbull DM, 2001. Assaying mitochondrial respiratory complex activity in mitochondria isolated from human cells and tissues. Methods Cell Biol. 65, 97–117. [DOI] [PubMed] [Google Scholar]
- Bouret S, Levin BE, Ozanne SE, 2015. Gene-environment interactions controlling energy and glucose homeostasis and the developmental origins of obesity. Physiol. Rev 95, 47–82. [DOI] [PMC free article] [PubMed] [Google Scholar]
- Cavdar Koc E, Ranasinghe A, Burkhart W, Blackburn K, Koc H, Moseley A, Spremulli LL, 2001. A new face on apoptosis: death-associated protein 3 and PDCD9 are mitochondrial ribosomal proteins. FEBS Lett. 492, 166–170. [DOI] [PubMed] [Google Scholar]
- de Boer IH, Rue TC, Hall YN, Heagerty PJ, Weiss NS, Himmelfarb J, 2011. Temporal trends in the prevalence of diabetic kidney disease in the United States. JAMA 305, 2532–2539. [DOI] [PMC free article] [PubMed] [Google Scholar]
- Denvir J, Boskovic G, Fan J, Primerano DA, Parkman JK, Kim JH, 2016. Whole genome sequence analysis of the TALLYHO/Jng mouse. BMC Genomics 17, 907. [DOI] [PMC free article] [PubMed] [Google Scholar]
- Diaz F, Fukui H, Garcia S, Moraes CT, 2006. Cytochrome c oxidase is required for the assembly/stability of respiratory complex I in mouse fibroblasts. Mol. Cell. Biol 26, 4872–4881. [DOI] [PMC free article] [PubMed] [Google Scholar]
- El-Serag HB, Tran T, Everhart JE, 2004. Diabetes increases the risk of chronic liver disease and hepatocellular carcinoma. Gastroenterology 126 460–468. [DOI] [PubMed] [Google Scholar]
- Esterhuizen K, Lindeque JZ, Mason S, van der Westhuizen FH, Suomalainen A, Hakonen AH, Carroll CJ, Rodenburg RJ, de Laat PB, Janssen MCH, Smeitink JAM, Louw R, 2019. A urinary biosignature for mitochondrial myopathy, encephalopathy, lactic acidosis and stroke like episodes (MELAS). Mitochondrion 45, 38–45. [DOI] [PubMed] [Google Scholar]
- Franko A, Neschen S, Rozman J, Rathkolb B, Aichler M, Feuchtinger A, Brachthauser L, Neff F, Kovarova M, Wolf E, Fuchs H, Haring HU, Peter A, Hrabe de Angelis M, 2017. Bezafibrate ameliorates diabetes via reduced steatosis and improved hepatic insulin sensitivity in diabetic TallyHo mice. Mol. Metab 6, 256–266. [DOI] [PMC free article] [PubMed] [Google Scholar]
- Grarup N, Sandholt CH, Hansen T, Pedersen O, 2014. Genetic susceptibility to type 2 diabetes and obesity: from genome-wide association studies to rare variants and beyond. Diabetologia 57, 1528–1541. [DOI] [PubMed] [Google Scholar]
- Greene NP, Nilsson MI, Washington TA, Lee DE, Brown LA, Papineau AM, Shimkus KL, Greene ES, Crouse SF, Fluckey JD, 2014. Impaired exercise-induced mitochondrial biogenesis in the obese Zucker rat, despite PGC-1alpha induction, is due to compromised mitochondrial translation elongation. Am. J. Physiol. Endocrinol. Metab 306, E503–511. [DOI] [PubMed] [Google Scholar]
- Guenebaut V, Vincentelli R, Mills D, Weiss H, Leonard KR, 1997. Three-dimensional structure of NADH-dehydrogenase from Neurospora crassa by electron microscopy and conical tilt reconstruction. J. Mol. Biol 265, 409–418. [DOI] [PubMed] [Google Scholar]
- Heilbronn LK, Gan SK, Turner N, Campbell LV, Chisholm DJ, 2007. Markers of mitochondrial biogenesis and metabolism are lower in overweight and obese insulin- resistant subjects. J. Clin. Endocrinol. Metab 92, 1467–1473. [DOI] [PubMed] [Google Scholar]
- Heinonen S, Buzkova J, Muniandy M, Kaksonen R, Ollikainen M, Ismail K, Hakkarainen A, Lundbom J, Lundbom N, Vuolteenaho K, Moilanen E, Kaprio J, Rissanen A, Suomalainen A, Pietilainen KH, 2015. Impaired mitochondrial biogenesis in adipose tissue in acquired obesity. Diabetes 64, 3135–3145. [DOI] [PubMed] [Google Scholar]
- Kelley DE, He J, Menshikova EV, Ritov VB, 2002. Dysfunction of mitochondria in human skeletal muscle in type 2 diabetes. Diabetes 51, 2944–2950. [DOI] [PubMed] [Google Scholar]
- Kim JH, Saxton AM, 2012. The TALLYHO mouse as a model of human type 2 diabetes. Methods Mol. Biol 933, 75–87. [DOI] [PubMed] [Google Scholar]
- Kim JH, Sen S, Avery CS, Simpson E, Chandler P, Nishina PM, Churchill GA, Naggert JK, 2001. Genetic analysis of a new mouse model for non-insulin-dependent diabetes. Genomics 74, 273–286. [DOI] [PubMed] [Google Scholar]
- Kim JH, Stewart TP, Soltani-Bejnood M, Wang L, Fortuna JM, Mostafa OA, Moustaid-Moussa N, Shoieb AM, McEntee MF, Wang Y, Bechtel L, Naggert JK, 2006. Phenotypic characterization of polygenic type 2 diabetes in TALLYHO/JngJ mice. J. Endocrinol 191, 437–446. [DOI] [PubMed] [Google Scholar]
- Kim JH, Stewart TP, Zhang W, Kim HY, Nishina PM, Naggert JK, 2005. Type 2 diabetes mouse model TallyHo carries an obesity gene on chromosome 6 that exaggerates dietary obesity. Physiol. Genomics 22, 171–181. [DOI] [PubMed] [Google Scholar]
- Koc EC, Cimen H, Kumcuoglu B, Abu N, Akpinar G, Haque ME, Spremulli LL, Koc H, 2013. Identification and characterization of CHCHD1, AURKAIP1, and CRIF1 as new members of the mammalian mitochondrial ribosome. Front. Physiol 4, 183. [DOI] [PMC free article] [PubMed] [Google Scholar]
- Maassen JA, LM TH, Van Essen E, Heine RJ, Nijpels G, Jahangir Tafrechi RS, Raap AK, Janssen GM, Lemkes HH, 2004. Mitochondrial diabetes: molecular mechanisms and clinical presentation. Diabetes 53 (Suppl. 1), S103–109. [DOI] [PubMed] [Google Scholar]
- Mao X, Dillon KD, McEntee MF, Saxton AM, Kim JH, 2014. Islet insulin secretion, β-cell mass, and energy balance in a polygenic mouse model of type 2 diabetes with obesity. JIEMS 2, 1–6. [Google Scholar]
- Mercader JM, Puiggros M, Segre AV, Planet E, Sorianello E, Sebastian D, Rodriguez-Cuenca S, Ribas V, Bonas-Guarch S, Draghici S, Yang C, Mora S, Vidal-Puig A, Dupuis J, Consortium D., Florez JC, Consortium M., Zorzano A, Torrents D, 2012. Identification of novel type 2 diabetes candidate genes involved in the crosstalk between the mitochondrial and the insulin signaling systems. PLoS Genet. 8, el003046. [DOI] [PMC free article] [PubMed] [Google Scholar]
- Mootha VK, Lindgren CM, Eriksson KF, Subramanian A, Sihag S, Lehar J, Puigserver P, Carlsson E, Ridderstrale M, Laurila E, Houstis N, Daly MJ, Patterson N, Mesirov JP, Golub TR, Tamayo P, Spiegelman B, Lander ES, Hirschhorn JN, Altshuler D, Groop LC, 2003. PGC-1alpha-responsive genes involved in oxidative phosphorylation are coordinately downregulated in human diabetes. Nat. Genet 34, 267–273. [DOI] [PubMed] [Google Scholar]
- Morino K, Petersen KF, Dufour S, Befroy D, Frattini J, Shatzkes N, Neschen S, White MF, Bilz S, Sono S, Pypaert M, Shulman GI, 2005. Reduced mitochondrial density and increased IRS-1 serine phosphorylation in muscle of insulin-resistant offspring of type 2 diabetic parents. J. Clin. Invest 115, 3587–3593. [DOI] [PMC free article] [PubMed] [Google Scholar]
- O’Brien TW, O’Brien BJ, Norman RA, 2005. Nuclear MRP genes and mitochondrial disease. Gene 354, 147–151. [DOI] [PubMed] [Google Scholar]
- Parkman JK, Mao X, Dillon K, Gudivada A, Moustaid-Moussa N, Saxton AM, Kim JH, 2016. Genotype-dependent metabolic responses to semi-purified high-sucrose high-fat diets in the TALLYHO/Jng vs. C57BL/6 mouse during the development of obesity and type 2 diabetes. Exp. Clin. Endocrinol. Diabetes 124, 622–629. [DOI] [PMC free article] [PubMed] [Google Scholar]
- Parkman JK, Denvir J, Mao X, Dillon KD, Romero S, Saxton AM, Kim JH, 2017. Congenic mice demonstrate the presence of QTLs conferring obesity and hypercholesterolemia on chromosome 1 in the TALLYHO mouse. Mamm. Genome 28, 487–497. [DOI] [PMC free article] [PubMed] [Google Scholar]
- Patti ME, Butte AJ, Crunkhorn S, Cusi K, Berria R, Kashyap S, Miyazaki Y, Kohane I, Costello M, Saccone R, Landaker EJ, Goldfine AB, Mun E, DeFronzo R, Finlayson J, Kahn CR, Mandarino LJ, 2003. Coordinated reduction of genes of oxidative metabolism in humans with insulin resistance and diabetes: potential role of PGC1 and NRF1. Proc. Natl. Acad. Sci. U. S. A 100, 8466–8471. [DOI] [PMC free article] [PubMed] [Google Scholar]
- Perks KL, Ferreira N, Richman TR, Ermer JA, Kuznetsova I, Shearwood AJ, Lee RG, Viola HM, Johnstone VPA, Matthews V, Hool LC, Rackham O, Filipovska A, 2017. Adult-onset obesity is triggered by impaired mitochondrial gene expression. Sci. Adv 3, el700677. [DOI] [PMC free article] [PubMed] [Google Scholar]
- Petersen KF, Befroy D, Dufour S, Dziura J, Ariyan C, Rothman DL, DiPietro L, Cline GW, Shulman GI, 2003. Mitochondrial dysfunction in the elderly: possible role in insulin resistance. Science 300, 1140–1142. [DOI] [PMC free article] [PubMed] [Google Scholar]
- Rees DA, Alcolado JC, 2005. Animal models of diabetes mellitus. Diabet. Med 22, 359–370. [DOI] [PubMed] [Google Scholar]
- Romao I, Roth J, 2008. Genetic and environmental interactions in obesity and type 2 diabetes. J. Am. Diet. Assoc 108, S24–28. [DOI] [PubMed] [Google Scholar]
- Rong JX, Qiu Y, Hansen MK, Zhu L, Zhang V, Xie M, Okamoto Y, Mattie MD, Higashiyama H, Asano S, Strum JC, Ryan TE, 2007. Adipose mitochondrial biogenesis is suppressed in db/db and high-fat diet-fed mice and improved by rosiglitazone. Diabetes 56, 1751–1760. [DOI] [PubMed] [Google Scholar]
- Schmittgen TD, Livak KJ, 2008. Analyzing real-time PCR data by the comparative C(T) method. Nat. Protoc 3, 1101–1108. [DOI] [PubMed] [Google Scholar]
- Schneider CA, Rasband WS, Eliceiri KW, 2012. NIH Image to ImageJ: 25 years of image analysis. Nat. Methods 9, 671–675. [DOI] [PMC free article] [PubMed] [Google Scholar]
- Skov V, Glintborg D, Knudsen S, Jensen T, Kruse TA, Tan Q, Brusgaard K, Beck-Nielsen H, Hojlund K, 2007. Reduced expression of nuclear-encoded genes involved in mitochondrial oxidative metabolism in skeletal muscle of insulin-resistant women with polycystic ovary syndrome. Diabetes 56, 2349–2355. [DOI] [PubMed] [Google Scholar]
- Stewart TP, Kim HY, Saxton AM, Kim JH, 2010. Genetic and genomic analysis of hyperlipidemia, obesity and diabetes using (C57BL/6J x TALLYHO/JngJ) F2 mice. BMC Genomics 11, 713. [DOI] [PMC free article] [PubMed] [Google Scholar]
- Ugalde C, Janssen RJ, van den Heuvel LP, Smeitink JA, Nijtmans LG, 2004. Differences in assembly or stability of complex I and other mitochondrial OXPHOS complexes in inherited complex I deficiency. Hum. Mol. Genet 13, 659–667. [DOI] [PubMed] [Google Scholar]
- van den Ouweland JM, Lemkes HH, Ruitenbeek W, Sandkuijl LA, de Vijlder MF, Struyvenberg PA, van de Kamp JJ, Maassen JA, 1992. Mutation in mitochondrial tRNA(Leu)(UUR) gene in a large pedigree with maternally transmitted type II diabetes mellitus and deafness. Nat. Genet 1, 368–371. [DOI] [PubMed] [Google Scholar]
- Yagil C, Varadi-Levi R, Yagil Y, 2018. A novel mutation in the NADH dehydrogenase (ubiquinone) 1 alpha subcomplex 4 (Ndufa4) gene links mitochondrial dysfunction to the development of diabetes in a rodent model. Dis. Model. Mech 11. [DOI] [PMC free article] [PubMed] [Google Scholar]
- Zerbino DR, Achuthan P, Akanni W, Amode MR, Barrell D, Bhai J, Billis K,Cummins C, Gall A, Giron CG, Gil L, Gordon L, Haggerty L, Haskell E, Hourlier T, Izuogu OG, Janacek SH, Juettemann T, To JK, Laird MR, Lavidas I, Liu Z, Loveland JE, Maurel T, McLaren W, Moore B, Mudge J, Murphy DN, Newman V, Nuhn M, Ogeh D, Ong CK, Parker A, Patricio M, Riat HS, Schuilenburg H, Sheppard D, Sparrow H, Taylor K, Thormann A, Vullo A, Walts B, Zadissa A, Frankish A, Hunt SE, Kostadima M, Langridge N, Martin FJ, Muffato M, Perry E, Ruffier M, Staines DM, Trevanion SJ, Aken BL, Cunningham F, Yates A, Flicek P, Ensembl, 2018. Nucleic Acids Res. 46 (2018), D754–D761. [DOI] [PMC free article] [PubMed] [Google Scholar]
Associated Data
This section collects any data citations, data availability statements, or supplementary materials included in this article.


