Abstract
Background
Pattern of emphysema at chest CT, scored visually by using the Fleischner Society system, is associated with physiologic impairment and mortality risk.
Purpose
To determine whether participant-level emphysema pattern could predict impairment and mortality when classified by using a deep learning method.
Materials and Methods
This retrospective analysis of Genetic Epidemiology of COPD (COPDGene) study participants enrolled between 2007 and 2011 included those with baseline CT, visual emphysema scores, and survival data through 2018. Participants were partitioned into nonoverlapping sets of 2407 for algorithm training, 100 for validation and parameter tuning, and 7143 for testing. A deep learning algorithm using convolutional neural network and long short-term memory architectures was trained to classify pattern of emphysema according to Fleischner criteria. Deep learning scores were compared with visual scores and clinical parameters including pulmonary function tests. Cox proportional hazard models were used to evaluate relationships between emphysema scores and survival. The algorithm was also tested by using CT and clinical data in 1962 participants enrolled in the Evaluation of COPD Longitudinally to Identify Predictive Surrogate End-points (ECLIPSE) study.
Results
A total of 7143 COPDGene participants (mean age ± standard deviation, 59.8 years ± 8.9; 3734 men and 3409 women) were evaluated. Deep learning emphysema classifications were associated with impaired pulmonary function tests, 6-minute walk distance, and St George’s Respiratory Questionnaire at univariate analysis (P < .001 for each). Testing in the ECLIPSE cohort showed similar associations (P < .001). In the COPDGene test cohort, deep learning emphysema classification improved the fit of linear mixed models in the prediction of these clinical parameters compared with visual scoring (P < .001). Compared with participants without emphysema, mortality was greater in participants classified by the deep learning algorithm as having any grade of emphysema (adjusted hazard ratios were 1.5, 1.7, 2.9, 5.3, and 9.7, respectively, for trace, mild, moderate, confluent, and advanced destructive emphysema; P < .05).
Conclusion
Deep learning automation of the Fleischner grade of emphysema at chest CT is associated with clinical measures of pulmonary insufficiency and the risk of mortality.
© RSNA, 2019
Summary
Presence and severity of emphysema, scored automatically according to the Fleischner system by using a deep learning algorithm, is associated with greater impairment and risk of mortality.
Key Results
■ In the Genetic Epidemiology of COPD (COPDGene) cohort, weighted κ statistic comparing visual and deep learning Fleischner emphysema scores was 0.60 (n = 7143; P < .001).
■ Deep learning emphysema classification improved the fit of linear mixed models in the prediction of clinical parameters of chronic obstructive pulmonary disease (pulmonary function tests, 6-minute walk distance, and St George’s Respiratory Questionnaire) compared with visual scoring (P < .001).
■ Deep learning classification of emphysema grade according to the Fleischner system showed Cox adjusted proportional hazard ratios of 1.5, 1.6, 2.9, 5.3, and 9.7, respectively, for trace, mild, moderate, confluent, and advanced destructive emphysema (P < .01).
Introduction
An estimated 12 million adults in the United States are diagnosed with chronic obstructive pulmonary disease (COPD) and an additional 12 million are thought to have undiagnosed COPD (1,2). CT captures the presence, pattern, and extent of phenotypic abnormalities associated with COPD. Both visual and quantitative CT assessments have been extensively validated and are considered complementary methods for assessment of COPD (3,4).
The Fleischner Society proposed a structured system for visual classification of parenchymal emphysema, the prototypical pattern of emphysema seen in cigarette smokers (3). The system uses a six-point ordinal scale to grade parenchymal emphysema as absent, trace, mild, moderate, confluent, or advanced destructive. Visual assessment of emphysema by using the Fleischner system provides a valid and reproducible index of severity that is associated with impaired function and higher risk of mortality, genetic loci associated with COPD, and lung cancer (5–7). However, visual analysis by using a structured scoring system is time consuming, subjective, and requires substantial training, making it difficult to perform in routine practice (5,8,9). A validated automatic technique to classify emphysema patterns could be useful for risk stratification in clinical practice and lung cancer screening programs. In addition, such a technique could permit selection of participants with specific grades of emphysema (or with no emphysema) for future COPD clinical trials.
Deep learning has provided dramatic advances in a wide range of challenging image analysis tasks including automatic grading of diabetic retinopathy, assessment of skin lesions, and detection of tuberculosis on chest radiographs (10–12). In this study, we developed and trained a deep learning algorithm to classify emphysema according to the Fleischner system for analysis of chest CT by using visual scores from the Genetic Epidemiology of COPD (COPDGene) cohort. We hypothesized that deep learning could successfully automate this classification. Our aim was to determine whether participant-level emphysema pattern could predict impairment and mortality when classified by using a deep learning method.
Materials and Methods
Study Cohorts
This study is a retrospective analysis of data from COPDGene (ClinicalTrials.gov registration number NCT00608764), a prospective multicenter investigation on the genetic epidemiology of COPD. Between 2007 and 2011, 10 192 individuals aged 45–80 years with a smoking history of at least 10 pack-years were enrolled in this Health Insurance Portability and Accountability Act–compliant study (13). Individuals with respiratory conditions other than asthma and COPD were excluded. Institutional review board approval of the research protocol was obtained at all clinical centers, a total of 21 sites in the United States. Written informed consent was obtained from all study participants (1). In addition to CT, clinical evaluation included baseline spirometry, 6-minute walk test, and standardized questionnaires including St George’s Respiratory Questionnaire and modified Medical Research Council dyspnea score (14,15). Airflow obstruction was classified according to Global Initiative for Lung Disease stages, including the Preserved Ratio Impaired Spirometry group where reductions in forced expiratory volume in 1 second (FEV1) and forced vital capacity (FVC) are proportionate, with normal values for FEV1/FVC ratio (16). Deaths were reported to the central study from clinical centers, and the Social Security Death Index was used to determine survival or censoring time for each participant (5). This report is based on 9652 COPDGene participants with available baseline inspiratory CT, visual emphysema scores, and mortality data. Visual assessment of CT in 4000 of these participants was reported previously (5). The prior article dealt with visual scoring of images, whereas in this article we report results of automatic scoring of emphysema by using a deep learning algorithm.
The Evaluation of COPD Longitudinally to Identify Predictive Surrogate End-points (ECLIPSE) study was a 3-year multicenter observational study designed to discover and validate novel and robust metrics of COPD (17,18). It included 2164 participants with Global Initiative for Lung Disease stages 2–4 COPD and 582 control participants (nonsmokers and smokers). It was completed in 2011 (17). Our present study included 1962 ECLIPSE participants with available baseline CT, spirometry, and mortality data. Additional information on study cohorts is available in Appendix E1 (online). Other researchers have reported on CT in the ECLIPSE cohort using different analysis methods (4,17).
Visual Scoring
Visual assessment of 9652 baseline COPDGene CT scans was performed by four trained research analysts between 2013 and 2017 using the Fleischner system, which is described elsewhere (3,5). The analysts had no previous experience with radiologic interpretation. Visual scoring using the Fleischner system was not performed in the ECLIPSE study.
Deep Learning Algorithm Development and Training
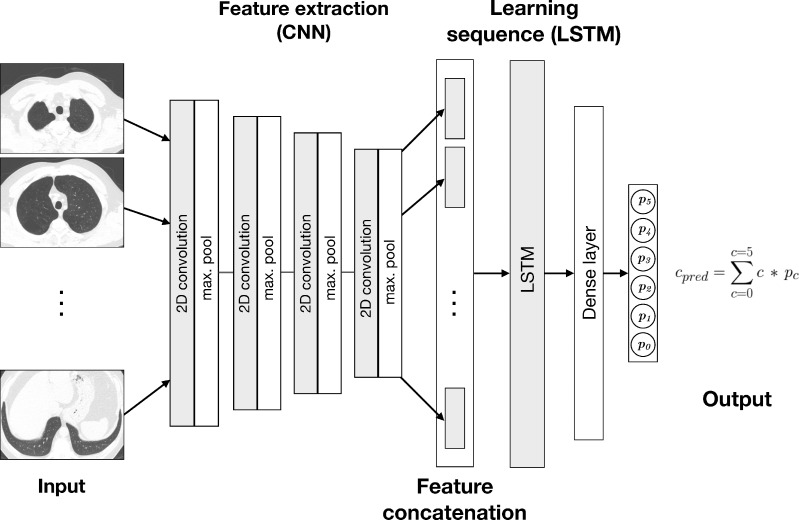
The deep learning algorithm combines a convolutional neural network architecture with a long short-term memory layer (Fig 1). Long short-term memory networks are recurrent neural networks capable of learning dependencies in sequences of images (19). The algorithm takes as input 25 axial slices, sampled evenly over the height of the lungs as determined in an initial segmentation process. The convolutional neural network includes four blocks of convolutional and pooling operations, which extract complex features from each input image. These features are concatenated into a sequence, which is transformed by the long short-term memory into a composite feature vector for the participant. The output of the model is a set of six continuous variables representing the prediction probability (on the scale of 0.0–1.0) for each category and is treated as a discrete probability distribution. The final classification is calculated as the probability-weighted average of the categories rounded to the nearest integer. The algorithm was developed in-house by using Python (version 3.6; Python Software Foundation, Wilmington, Del; https://www.python.org/) and PyTorch (version 0.4.1; https://pytorch.org).
Figure 1:
Diagram shows deep learning algorithm. Algorithm combines convolutional neural network (CNN) and long short term-memory (LSTM) architectures. Output, cpred, is weighted average of predicted probabilities (pi) for each classification category (ci) produced at output layer. Classification categories for parenchymal emphysema are as follows: 0 = absent, 1 = trace, 2 = mild, 3 = moderate, 4 = confluent, or 5 = advanced destructive. 2D = two-dimensional.
CT scans in 2407 COPDGene participants were used for training the deep learning algorithm, and a separate group of 100 were held out for validation and parameter tuning. Participants used for training were selected because they had CT and visual emphysema scores available and not been included in an earlier analysis (5). See Appendix E1 (online) for additional details.
Algorithm Testing
The testing cohort consisted of 7143 COPDGene participants that did not overlap with the training or validation sets and for whom mortality data, pulmonary function tests, and visual scores were available. The external testing cohort consisted of 1962 ECLIPSE participants with available CT, pulmonary function tests, and mortality data.
Statistical Analysis
Accuracy of deep learning classifications compared with visual scores was evaluated by using weighted κ statistics, with all levels of disagreement weighted equally. Calibration of the deep learning algorithm outputs with respect to visual scores was evaluated by using a resampling-based test (20). Calibration generally refers to the agreement between probabilities predicted by a classification algorithm and the true class membership probabilities. Accuracy and calibration are two different aspects of performance evaluation. Good accuracy does not ensure good calibration and vice versa (21). In this application, true class membership probabilities are unknown, so calibration testing compared the predicted probability with observed probabilities based on visual scores. The resampling test is similar to a Hosmer-Lemeshow test, which is typically used to test calibration of binary models, in that a significant P value suggests evidence that prediction probabilities diverge from observed probabilities. See Appendix E1 (online) for details.
Descriptive statistics between emphysema scores and demographic and functional parameters were computed. One-way analysis of variance was used to test for significant differences in FEV1 percentage predicted or FEV1%, FEV1/FVC ratio, St George’s Respiratory Questionnaire, quantitative CT emphysema value, and smoking history stratified by emphysema scores. Quantitative emphysema value was computed as the percentage of lung voxels with CT attenuation less than -950 HU (LAA-950). χ2 tests of independence were used to compare Global Initiative for Lung Disease stage and other categoric characteristics between emphysema severity scores.
In the COPDGene test cohort, linear mixed models adjusted for age, race, sex, weight, height, smoking pack-years, current smoking status at enrollment, education level, and a random term for study site were used to test relationships between emphysema grades (determined by the deep learning algorithm and/or visually) and FEV1%, FEV1/FVC ratio, 6-minute walk distance, modified Medical Research Council dyspnea score, and St George’s Respiratory Questionnaire. Nested models were compared by using asymptotic χ2 tests to determine whether inclusion of deep learning emphysema score significantly improved prediction of baseline clinical measures compared with a model using only visual emphysema score. Additional models including adjustment for LAA-950 were also fit to test whether emphysema grade was significantly associated with baseline clinical parameters independent of LAA-950.
Median length of follow-up in the COPDGene testing cohort was 7.95 years (range, 30 days to 10.56 years). In the ECLIPSE cohort, it was 2.90 years (range, 69 days to 2.90 years). Kaplan-Meier plots were used to visualize mortality by emphysema scores in both cohorts. In the COPDGene testing cohort, multivariable analysis of risk of death by emphysema grades was performed by using shared frailty models, an extension of Cox proportional hazard models that account for variability between study sites (5). A normally distributed random effect was included as linear predictor to account for correlation in the data due to clustering of the participants by study site.
Statistical calculations were performed by using R (version 3.4.4; R Foundation for Statistical Computing, Vienna, Austria). A P value of < .05 was considered to indicate statistical significance.
Results
Participant Characteristics
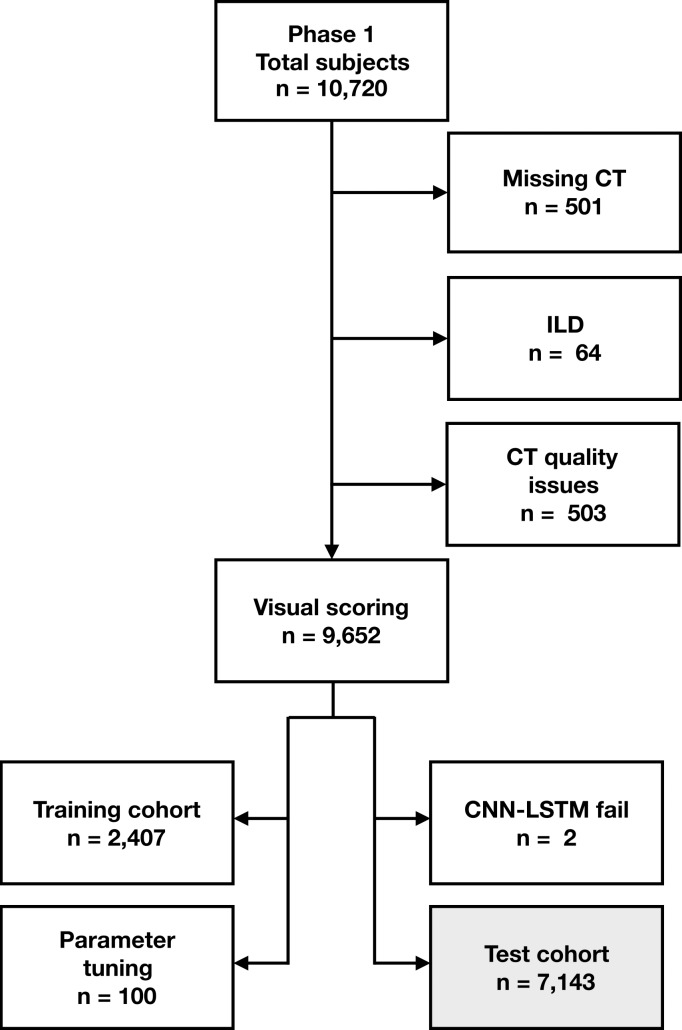
Figure 2 shows participant selection in the COPDGene and ECLIPSE cohorts. The COPDGene testing cohort consisted of 7143 participants (3734 men and 3409 women). The mean age ± standard deviation at enrollment was 59.8 years ± 8.9, with a mean of 59.9 years ± 8.9 for men and 59.7 years ± 9.0 for women. Characteristics of COPDGene participants included in the training and validation cohort are described in Table E1 (online). The external testing cohort consisted of 1962 ECLIPSE participants (1188 men and 774 women). Mean age at enrollment was 62.4 years ± 8.4, with means of 62.3 years ± 8.4 for men and 60.1 years ± 8.4 for women. Table E2 (online) compares COPDGene and ECLIPSE testing cohorts.
Figure 2a:
Flowchart shows participant selection. (a) Among 10 192 participants enrolled in Genetic Epidemiology of COPD (COPDGene) phase 1, CT was missing in 501 participants. Sixty-four participants were excluded due to presence of interstitial lung disease (ILD) and 503 CT scans were excluded due to quality issues (eg, significant artifact or scanning protocol deviation). Total of 9652 had baseline CT with visual emphysema scores and mortality data. CT scans with visual scores were partitioned into subsets of 2407, 100, and 7143 scans for training, validation, and parameter tuning and testing, respectively. Training scans were selected because they had not been included in previous analysis. Source.—Reference 5. Deep learning algorithm failed to produce results on two CT scans. (b) Among 2746 participants enrolled in Evaluation of COPD Longitudinally to Identify Predictive Surrogate End-points (ECLIPSE), 456 were missing CT and/or pulmonary function testing (PFT). Total of 318 CT scans were identified as unreadable on quality checks (primarily due to missing data or motion artifact) during original study. Source.—Reference 4. Deep learning algorithm failed to produce results on 10 CT scans. Total of 1962 participants with analyzable CT were included in testing cohort. CNN-LSTM = convolutional neural network and long short-term memory.
Figure 2b:
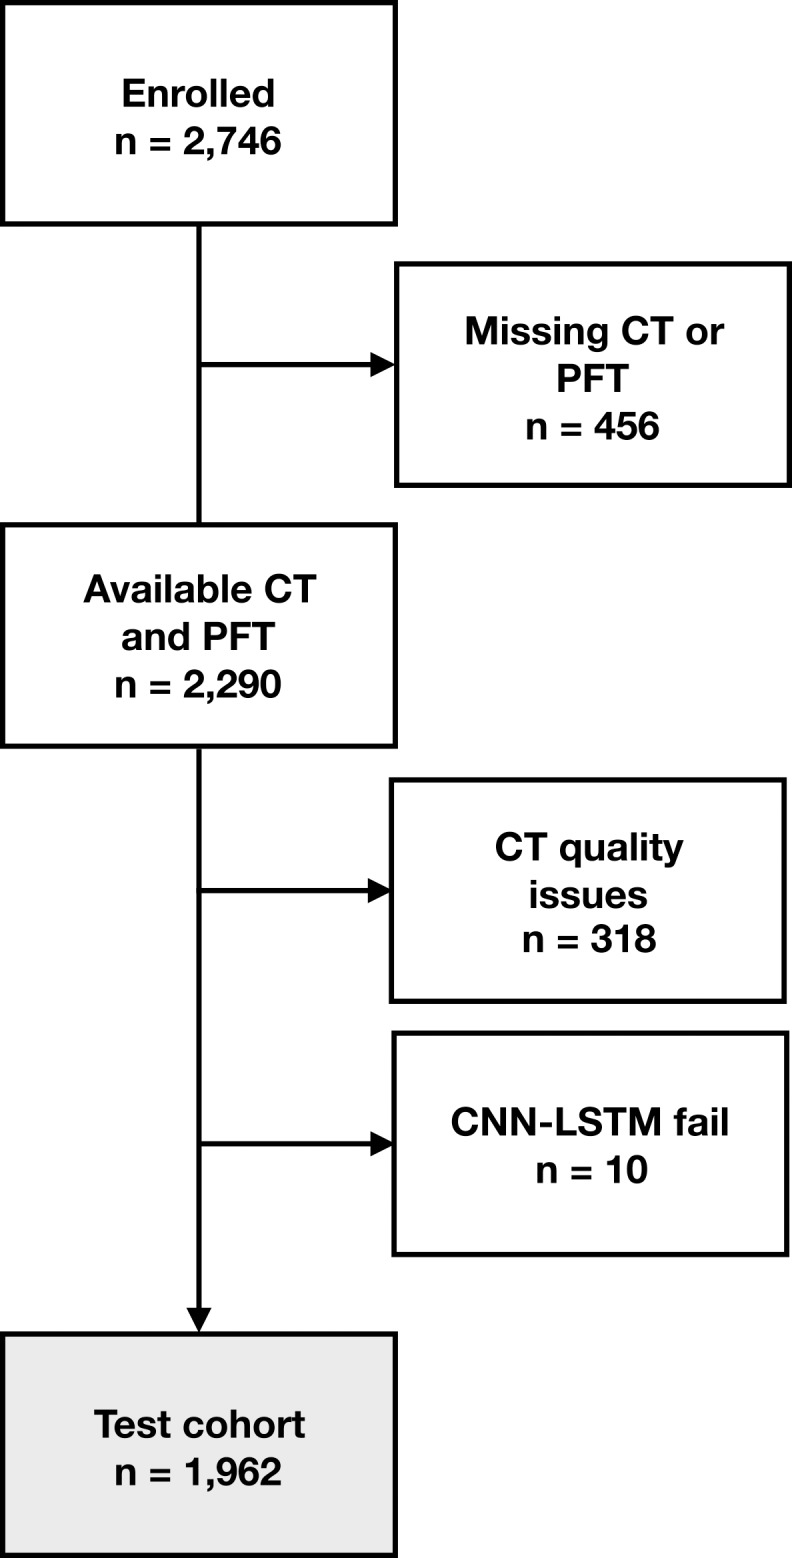
Flowchart shows participant selection. (a) Among 10 192 participants enrolled in Genetic Epidemiology of COPD (COPDGene) phase 1, CT was missing in 501 participants. Sixty-four participants were excluded due to presence of interstitial lung disease (ILD) and 503 CT scans were excluded due to quality issues (eg, significant artifact or scanning protocol deviation). Total of 9652 had baseline CT with visual emphysema scores and mortality data. CT scans with visual scores were partitioned into subsets of 2407, 100, and 7143 scans for training, validation, and parameter tuning and testing, respectively. Training scans were selected because they had not been included in previous analysis. Source.—Reference 5. Deep learning algorithm failed to produce results on two CT scans. (b) Among 2746 participants enrolled in Evaluation of COPD Longitudinally to Identify Predictive Surrogate End-points (ECLIPSE), 456 were missing CT and/or pulmonary function testing (PFT). Total of 318 CT scans were identified as unreadable on quality checks (primarily due to missing data or motion artifact) during original study. Source.—Reference 4. Deep learning algorithm failed to produce results on 10 CT scans. Total of 1962 participants with analyzable CT were included in testing cohort. CNN-LSTM = convolutional neural network and long short-term memory.
Algorithm Testing
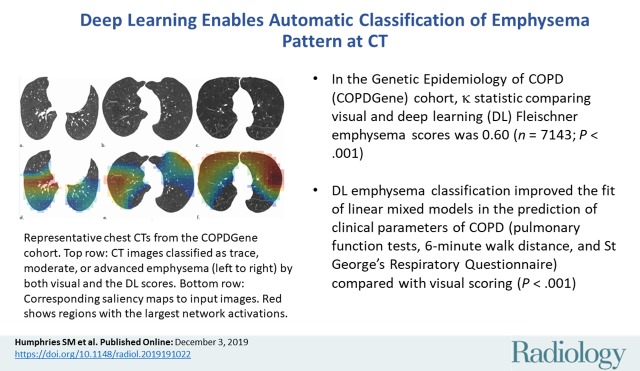
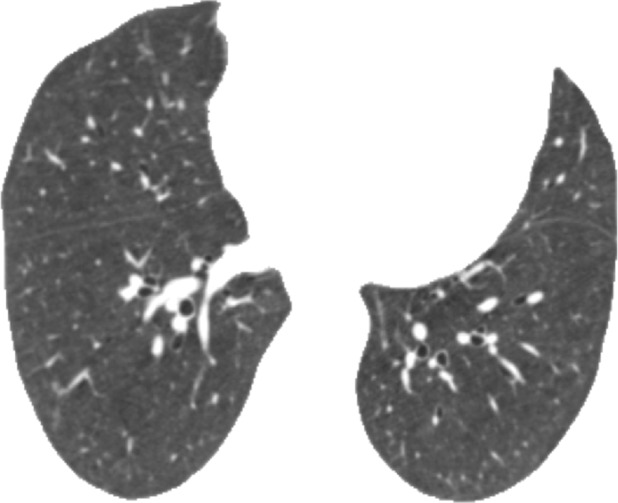
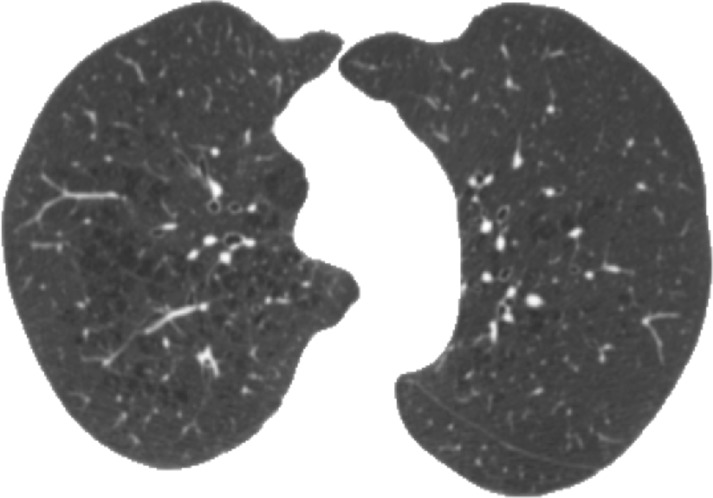
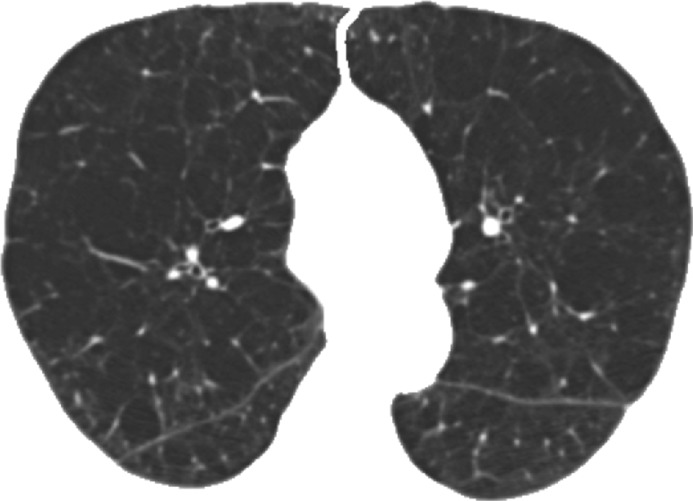
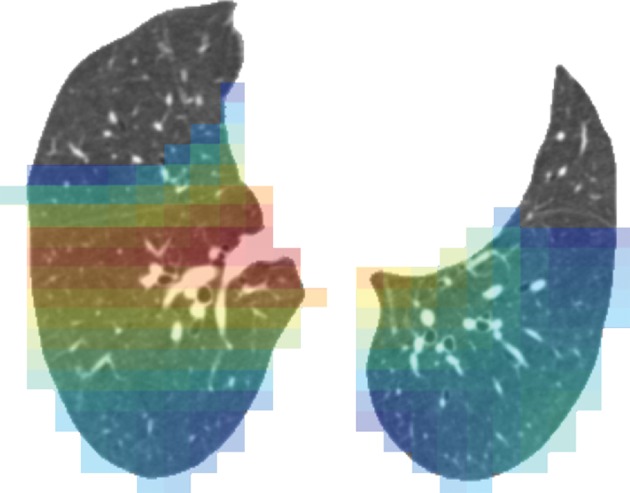
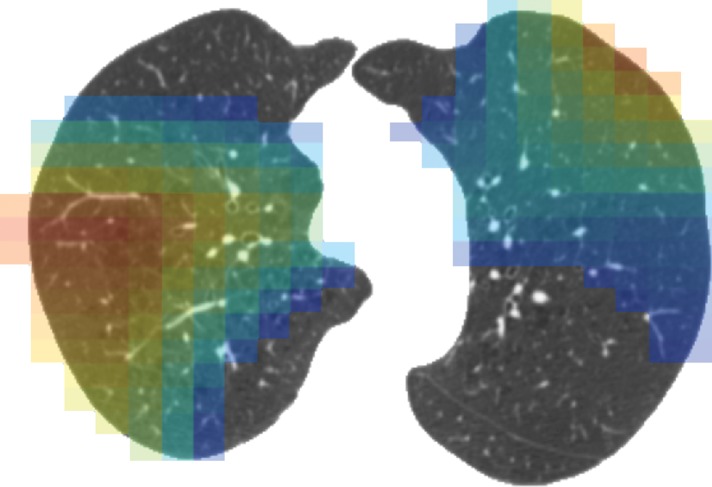
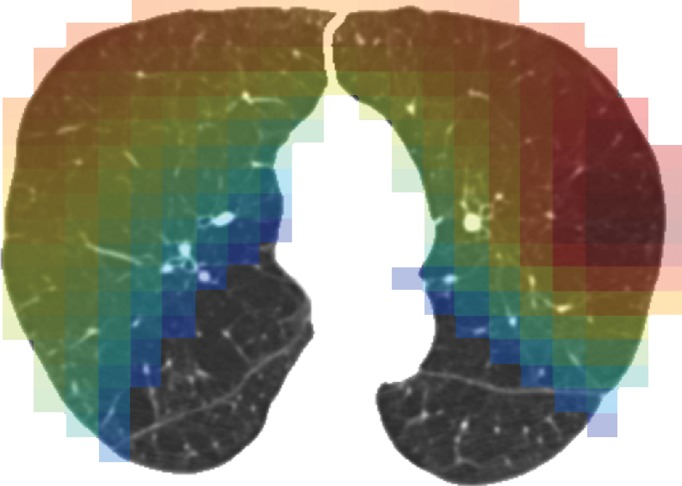
Computation time for automatic classification was about 1 minute per participant scan. Figure 3 shows representative CT images and gradient-weighted class activation maps, or Grad-CAM, calculated by using the last convolutional layer of the deep learning model. Grad-CAM heat maps indicate how intensely a given input image activates different portions of the convolutional neural network. Table 1 compares visual and deep learning emphysema classification scores in COPDGene test participants. Weighted κ statistic comparing visual and deep learning scores was moderate (κ = 0.60; P < .001).The deep learning algorithm classified 34% of scans as one category more severe and 13% of scans as one category less severe than visual scores (percentage calculated as number of deep learning classifications within one category of visual score divided by total number of test cases). The greatest discordance was in individuals without visual evidence of emphysema that were classified by the deep learning algorithm as having trace emphysema (ie, the two leftmost cells along the first row of Table 1). Compared with participants classified by both visual assessment and deep learning as having no emphysema (n = 637), those classified as having trace emphysema by deep learning but no emphysema at visual assessment (n = 1495) had lower FEV1% predicted (90.7 [95% confidence interval {CI}: 89.9, 91.6] vs 93.9 [95% CI: 92.8, 94.9]; P < .001), lower FEV1/FVC ratio (0.77 [95% CI: 0.76, 0.77] vs 0.79 [95% CI: 0.79, 0.80]; P < .001), more severe dyspnea by using modified Medical Research Council score (0.85 [95% CI: 0.79, 0.92] vs 0.71 [95% CI: 0.63, 0.80]; P = .0114), and greater LAA-950 (2.31 [95% CI: 2.17, 2.45] vs 2.01 [95% CI: 1.82, 2.20]; P = .0125). See also Table E3 (online).
Figure 3a:
Representative CT scans from Genetic Epidemiology of COPD (COPDGene) testing cohort. Top row: Axial noncontrast CT sections classified as (a) trace, (b) moderate, or (c) advanced destructive emphysema by using both visual scoring and deep learning algorithm. Bottom row: (d–f) Heat maps show gradient-weighted class activation maps corresponding to input images a–c. Red shows image regions that result in largest network activations for each input image. Color maps are scaled to show regions with at least 50% of maximum activation for each input image. Source.—Reference 32.
Table 1:
Comparison of Visual and Deep Learning Emphysema Scores in the COPDGene Test Cohort (n = 7143)
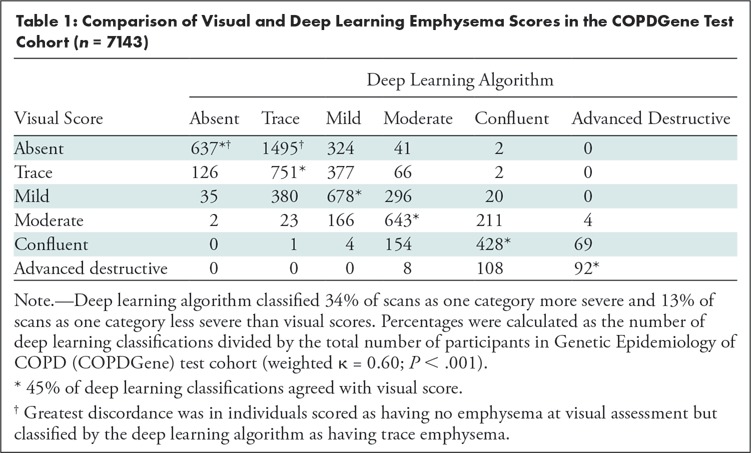
Figure 3b:
Representative CT scans from Genetic Epidemiology of COPD (COPDGene) testing cohort. Top row: Axial noncontrast CT sections classified as (a) trace, (b) moderate, or (c) advanced destructive emphysema by using both visual scoring and deep learning algorithm. Bottom row: (d–f) Heat maps show gradient-weighted class activation maps corresponding to input images a–c. Red shows image regions that result in largest network activations for each input image. Color maps are scaled to show regions with at least 50% of maximum activation for each input image. Source.—Reference 32.
Figure 3c:
Representative CT scans from Genetic Epidemiology of COPD (COPDGene) testing cohort. Top row: Axial noncontrast CT sections classified as (a) trace, (b) moderate, or (c) advanced destructive emphysema by using both visual scoring and deep learning algorithm. Bottom row: (d–f) Heat maps show gradient-weighted class activation maps corresponding to input images a–c. Red shows image regions that result in largest network activations for each input image. Color maps are scaled to show regions with at least 50% of maximum activation for each input image. Source.—Reference 32.
Figure 3d:
Representative CT scans from Genetic Epidemiology of COPD (COPDGene) testing cohort. Top row: Axial noncontrast CT sections classified as (a) trace, (b) moderate, or (c) advanced destructive emphysema by using both visual scoring and deep learning algorithm. Bottom row: (d–f) Heat maps show gradient-weighted class activation maps corresponding to input images a–c. Red shows image regions that result in largest network activations for each input image. Color maps are scaled to show regions with at least 50% of maximum activation for each input image. Source.—Reference 32.
Figure 3e:
Representative CT scans from Genetic Epidemiology of COPD (COPDGene) testing cohort. Top row: Axial noncontrast CT sections classified as (a) trace, (b) moderate, or (c) advanced destructive emphysema by using both visual scoring and deep learning algorithm. Bottom row: (d–f) Heat maps show gradient-weighted class activation maps corresponding to input images a–c. Red shows image regions that result in largest network activations for each input image. Color maps are scaled to show regions with at least 50% of maximum activation for each input image. Source.—Reference 32.
Figure 3f:
Representative CT scans from Genetic Epidemiology of COPD (COPDGene) testing cohort. Top row: Axial noncontrast CT sections classified as (a) trace, (b) moderate, or (c) advanced destructive emphysema by using both visual scoring and deep learning algorithm. Bottom row: (d–f) Heat maps show gradient-weighted class activation maps corresponding to input images a–c. Red shows image regions that result in largest network activations for each input image. Color maps are scaled to show regions with at least 50% of maximum activation for each input image. Source.—Reference 32.
Calibration testing of the deep learning probability predictions compared with visual scores resulted in a P value that was less than .001. This indicates that it is unlikely that the probabilities predicted by the deep learning algorithm could generate the distribution of visual scores such as was observed. In other words, the prediction probabilities produced by the last layer of the deep learning model diverge from the observed probabilities based on visual scores.
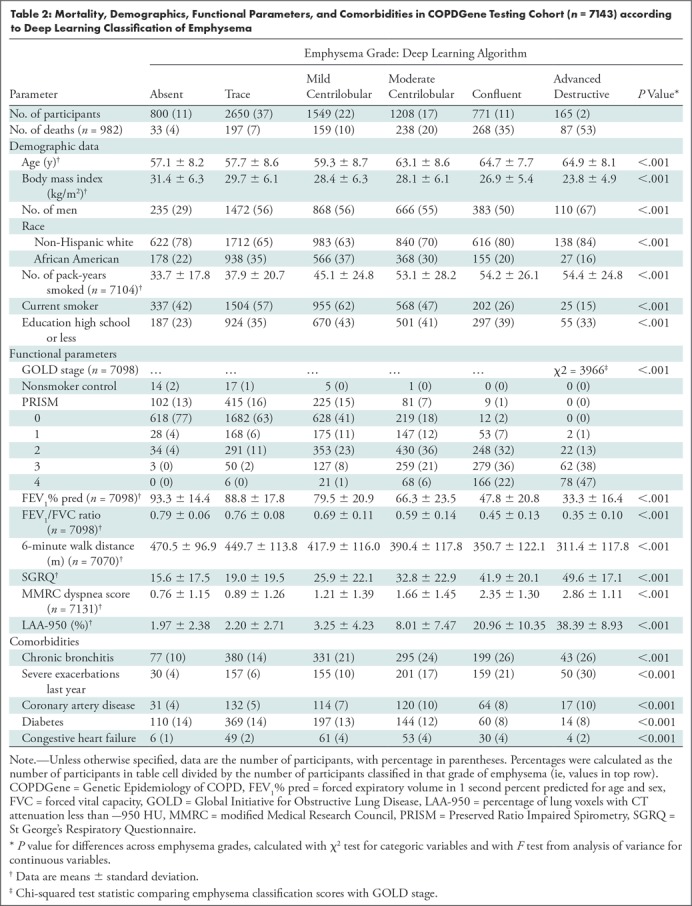
Table 2 shows mortality, demographics, functional parameters, and comorbidities according to deep learning classifications in the COPDGene test cohort. As seen in a prior study, participants with moderate or more advanced emphysema were relatively older, more likely to be non-Hispanic white than African American, had a lower body mass index, and had a relatively higher smoking exposure (but were less likely to be current smokers) (5). Emphysema severity classified by the deep learning algorithm was associated with progressively greater airflow obstruction, reduced 6-minute walk distance, and higher severity of dyspnea assessed by using modified Medical Research Council score. The presence and severity of emphysema was positively correlated with Global Initiative for Lung Disease stage (χ2 = 3966; P < .001). See also Table E4 (online), which shows these clinical parameters by visual emphysema score.
Table 2:
Mortality, Demographics, Functional Parameters, and Comorbidities in COPDGene Testing Cohort (n = 7143) according to Deep Learning Classification of Emphysema
In the COPDGene test cohort, linear mixed models were calculated with FEV1%, FEV1/FVC ratio, 6-minute walk distance, or St George’s Respiratory Questionnaire as the dependent variable; visual emphysema score as the independent variable; and adjustments made for age, race, sex, weight, height, smoking pack-years, current smoking status at enrollment, education level, and a random term for study site. Inclusion of the deep learning emphysema score as an additional predictor improved χ2 goodness of fit measures in models with FEV1%, FEV1/FVC ratio, 6-minute walk distance, or St George’s Respiratory Questionnaire as the dependent variable (P < .001). This remained true in comparisons of similar models that included adjustment for LAA-950 (P < .001 for each dependent variable), suggesting that deep learning emphysema scores provide information beyond visual assessment and LAA-950.
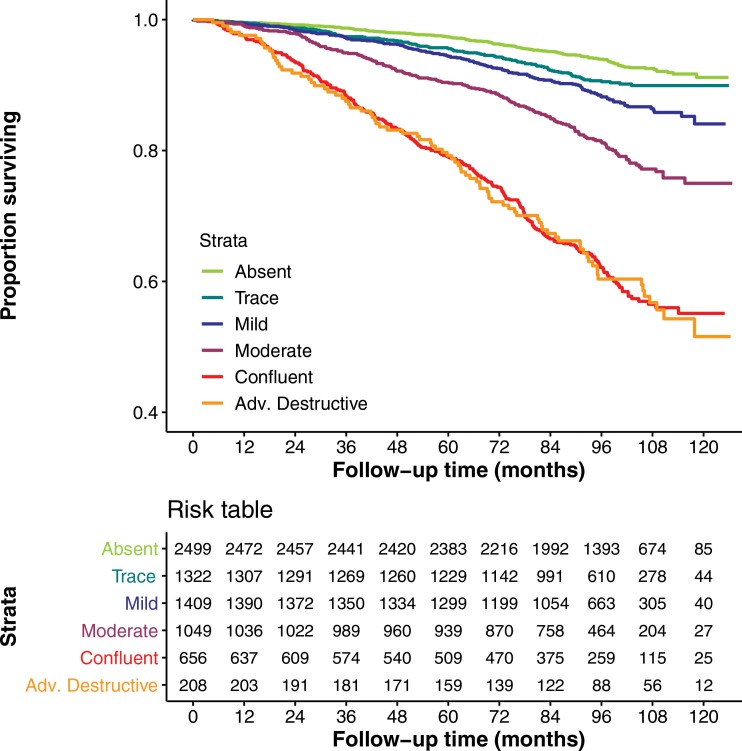
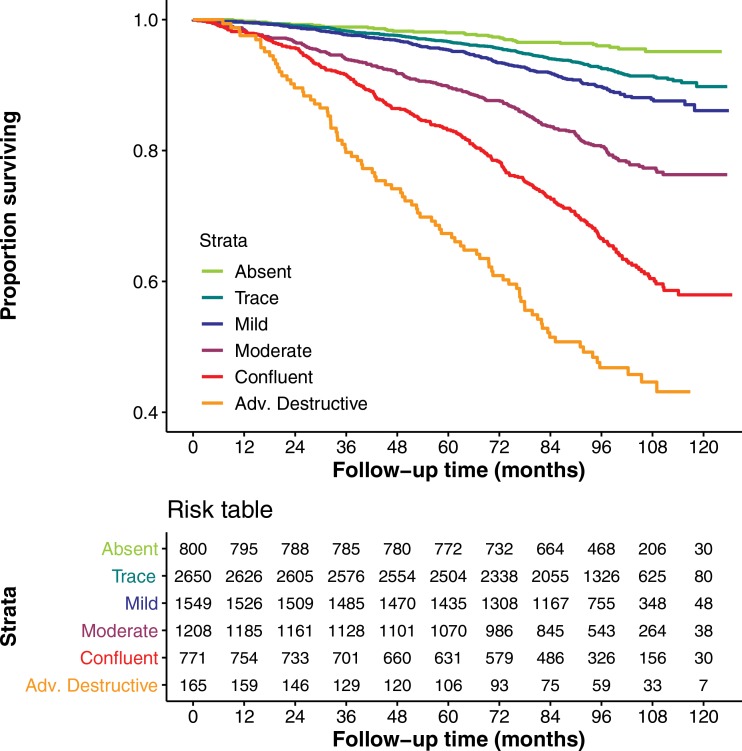
There were 982 deaths in the COPDGene testing cohort. Figures 4a and 4b show Kaplan-Meier plots of survival stratified by visual or deep learning emphysema score. Table 3 shows results of Cox multivariable analysis by using deep learning emphysema classifications. The base model, adjusted for race, sex, age, weight, height, smoking pack-years, current smoking status, and education level shows that worsening of the emphysema grades classified by deep learning were associated with a higher mortality rate. Estimated hazard ratios were 1.5 (95% CI: 1.0, 2.2), 1.7 (95% CI: 1.1, 2.5), 2.9 (95% CI: 2.0, 4.3), 5.3 (95% CI: 3.6, 7.7), or 9.7 (95% CI: 6.3, 14.8) for trace, mild, moderate, confluent, or advanced destructive emphysema, respectively. Deep learning emphysema grade remained a predictor of mortality after adjustment for LAA-950, with estimated hazard ratios of 1.5 (95% CI: 1.0, 2.2), 1.6 (95% CI: 1.1, 2.4), 2.4 (95% CI: 1.6, 3.5), 2.7 (95% CI: 1.8, 4.2), and 2.9 (95% CI: 1.7, 4.9) for trace, mild, moderate, confluent, or advanced destructive emphysema, respectively. See Table E5 (online) for results of Cox multivariable analysis using visual emphysema scores in COPDGene. Table E6 (online) compares cause of death and emphysema severity scores in COPDGene.
Figure 4a:
(a) Graph shows relationship between visual parenchymal emphysema pattern and survival in Genetic Epidemiology of COPD (COPDGene) test cohort. Kaplan-Meier curves show lower survival associated with higher grade of emphysema severity in 7143 participants included in mortality analysis. (b) Graph shows relationship between deep learning parenchymal emphysema pattern and survival in COPDGene test cohort. Kaplan-Meier curves show lower survival associated with higher grade of emphysema severity in 7143 participants included in mortality analysis. Deep learning separates confluent and advanced destructive emphysema better than does human scoring in terms of mortality discrimination.
Figure 4b:
(a) Graph shows relationship between visual parenchymal emphysema pattern and survival in Genetic Epidemiology of COPD (COPDGene) test cohort. Kaplan-Meier curves show lower survival associated with higher grade of emphysema severity in 7143 participants included in mortality analysis. (b) Graph shows relationship between deep learning parenchymal emphysema pattern and survival in COPDGene test cohort. Kaplan-Meier curves show lower survival associated with higher grade of emphysema severity in 7143 participants included in mortality analysis. Deep learning separates confluent and advanced destructive emphysema better than does human scoring in terms of mortality discrimination.
Table 3:
Cox Multivariable Models for Predicting Mortality in COPDGene Test Cohort (n = 7143)

Testing in the ECLIPSE Cohort
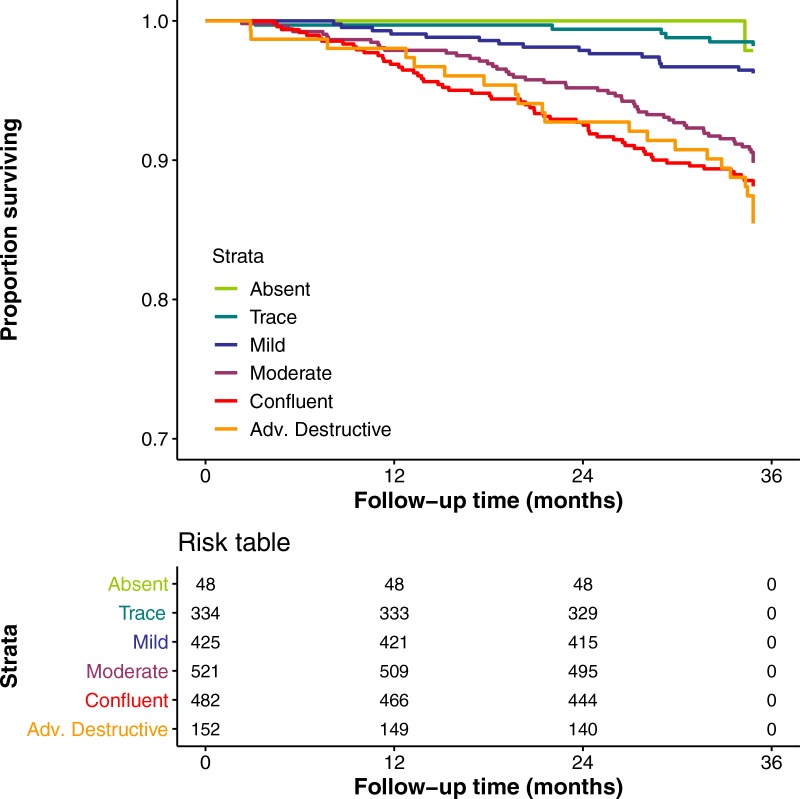
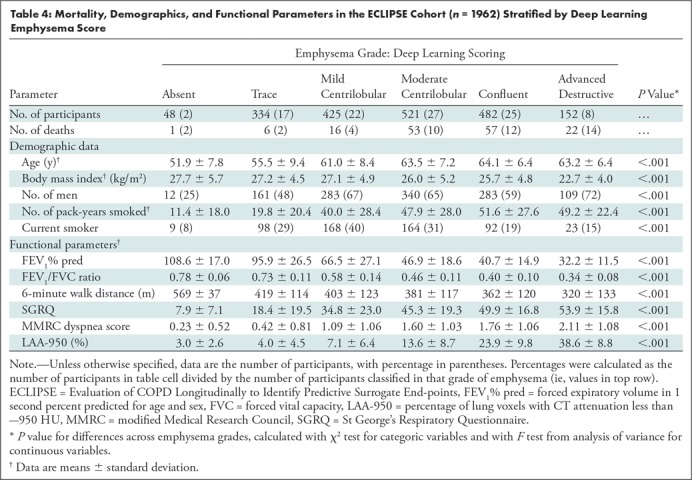
Figure 5 shows Kaplan-Meier plots of survival in the external testing cohort from the ECLIPSE study. There were 155 deaths during the 3-year follow-up period (see Fig E1 [online] for plot of COPDGene data with comparable axes). Overall, more severe emphysema classified by using the deep learning algorithm was associated with greater mortality risk (log-rank P < .001), although there was no distinction in risk considering only the confluent and advanced destructive emphysema groups (log-rank P = .43). Table 4 shows mortality, demographics, and functional parameters by deep learning emphysema score. As was seen in the COPDGene cohort, more severe grades of emphysema were associated with greater airflow obstruction, reduced 6-minute walk distance, and more severe dyspnea in the ECLIPSE cohort (P < .001).
Figure 5:
Graph shows relationship between deep learning parenchymal emphysema pattern and survival in Evaluation of COPD Longitudinally to Identify Predictive Surrogate End-points cohort (n = 1962). Follow-up period was 1060 days. Kaplan-Meier curves show lower survival associated with higher grade of emphysema severity.
Table 4:
Mortality, Demographics, and Functional Parameters in the ECLIPSE Cohort (n = 1962) Stratified by Deep Learning Emphysema Score
Discussion
We developed a deep learning algorithm that classifies emphysema pattern at CT according to the Fleischner Society criteria and used an outcomes-based approach to test it in separate cohorts (Genetic Epidemiology of COPD [COPDGene] and Evaluation of COPD Longitudinally to Identify Predictive Surrogate End-points [ECLIPSE]). We show that emphysema classification using this method was associated with impaired pulmonary function tests, 6-minute walk distance, and St George’s Respiratory Questionnaire in both cohorts (P < .001 for each). When compared with visual classification of emphysema pattern by using the Fleischner criteria in the COPDGene cohort, this automated method improved the fit of linear mixed models in the prediction of these clinical parameters (P < .001). Compared with participants without emphysema, mortality was greater in participants classified by the deep learning algorithm as having emphysema (adjusted hazard ratios were 1.5, 1.6, 2.9, 5.3, and 9.7, respectively, for trace, mild, moderate, confluent, and advanced destructive emphysema; P < .01).
Quantitative CT assessment based on lung densitometry has been extensively validated as an objective index of emphysema extent (22,23). Other and more complex quantitative assessments have shown promise in characterizing emphysema patterns. Regional analysis by using local histograms have classified emphysema subtypes, which are associated with functional impairment and with genetic abnormality (24). Unsupervised learning methods have identified prototypical CT textural patterns that predict traditional radiologic subtypes of emphysema (25,26). However, these techniques are not widely available, and we are unaware of previous studies demonstrating that such algorithms can predict mortality. Visual assessment has remained necessary to fully characterize the morphologic patterns present in CT images and is considered complementary to traditional quantitative metrics (3,27,28). Similarly, we believe that the deep learning system presented in this article may complement quantitative densitometric assessment of emphysema severity. Other structured scoring systems have been used for visual classification of emphysema patterns (4,29), but to our knowledge, only the Fleischner system has been validated against mortality (5).
Other researchers have demonstrated impressive performance leveraging deep learning for analysis of chest CT. Walsh and colleagues (30) developed an algorithm that can classify fibrotic lung disease at CT with human-level performance. González and colleagues (18) developed a convolutional neural network capable of distinguishing participants with COPD and predicting risk of adverse events. To manage memory constraints of current consumer-grade graphics processing units, both efforts used montages of four images sampled from volumetric CT. The use of a combined convolutional neural network and long short-term memory architecture in our present study enables processing of 25 full-resolution axial images from each participant during training and at inference.
Our algorithm achieved moderate agreement with visual emphysema scores in the COPDGene test cohort. However, the predictions of the algorithm were more strongly associated with clinical parameters, including mortality, than were visual emphysema scores. This is an interesting observation, especially considering that the algorithm was specifically trained to predict visual scores. Calibration testing showed evidence that deep learning predictions diverged from visual scores, particularly at the extremes of the grading scale. One interpretation is that detection of trace emphysema and discrimination of confluent and advanced destructive severity grades are difficult visual tasks. This resulted in more variation in visual scores at these levels in both the training and testing cohorts. A strength of deep learning is that convolutional neural networks learn essential features associated with desired outputs and can tolerate label noise (31). The training process tends to regress toward the mean of features associated with output categories despite random variations in training data. We speculate that this characteristic of deep learning enables the algorithm to make predictions more consistently than a human observer. After an algorithm is trained and its parameters locked, it will produce the same output when presented with a given input image on different occasions. The same cannot be said for human observers. It is also likely that the deep learning algorithm detects features that are not appreciated visually but which form part of the underlying CT phenotype. This probably explains the identification of a large study sample of functionally impaired smokers without visual emphysema but classified as having trace emphysema by the deep learning algorithm. If further follow-up studies can confirm that these individuals have preclinical COPD, then they may represent an important target population for early intervention to prevent progression.
The observation that deep learning emphysema scores improve the ability to predict diminished function and mortality suggest that the automatic method consistently captures different information than does visual assessment. These findings reinforce the validity of the Fleischner scoring system, suggesting that the criteria describe complex and clinically important patterns that can be learned by example, but the inherent subjectivity in visual assessment leads to variation that can be reduced by using automation.
Additional testing in the ECLIPSE cohort demonstrates the ability of our algorithm to generalize to data outside the COPDGene study. Although visual scoring using the Fleischner criteria was not performed in the ECLIPSE study, we saw associations between deep learning emphysema classifications and clinical parameters similar to those seen in the COPDGene testing cohort. The ECLIPSE data are a much smaller study sample, with a higher proportion of participants with COPD and a shorter follow-up interval. These differences may explain the similar mortality risks in the two most severe emphysema grades classified by the deep learning algorithm.
Our study had some limitations. The CT protocol in COPDGene is well defined and scans are carefully curated. Because it is trained using only COPDGene data, our model could be influenced by the specific CT protocol and selection biases present in this cohort. Furthermore, while the Fleischner system has been validated in COPDGene, other research studies have not used this system, and the Fleischner system is not used widely in clinical practice. Furthermore, there is criticism of deep learning methods that relate to the fact that these neural network models are “black boxes” that lack interpretability. An advantage of anchoring an algorithm to an established scoring system, such as the Fleischner criteria, is that classification outputs are clearly defined and can be intuitively understood by clinicians. Although deep learning makes it feasible to train algorithms for direct prediction of risk from input CT, such approaches are more difficult to interpret clinically, validate, and test on an ongoing basis.
In conclusion, we developed a deep learning algorithm that can perform automatic objective classification of emphysema pattern at CT according to Fleischner Society criteria. The system provides an interpretable output that can help identify individuals with greater mortality risk and may be more sensitive than visual assessment for detection of trace levels of emphysema. Future work will further evaluate the generalizability of this model in additional data sets.
APPENDIX
SUPPLEMENTAL FIGURES
Acknowledgments
Acknowledgments
We gratefully acknowledge the support of NVIDIA Corporation with the donation of the Titan XP GPU used for this research.
Supported by the National Heart, Lung, and Blood Institute (U01HL089897, U01HL089856). The content is solely the responsibility of the authors and does not necessarily represent the official views of the National Heart, Lung, and Blood Institute or the National Institutes of Health. The COPDGene project is also supported by the COPD Foundation through contributions made to an industry advisory board representing AstraZeneca, Boehringer Ingelheim, Novartis, Pfizer, Siemens, Sunovion, and GlaxoSmithKline. The ECLIPSE project was funded by GlaxoSmithKline.
Disclosures of Conflicts of Interest: S.M.H. Activities related to the present article: disclosed no relevant relationships. Activities not related to the present article: is a consultant for Boehringer Ingelheim; has grants/grants pending with National Institutes of Health and U.S. Department of Defense; received payment for lectures including service on speakers bureaus from Colorado Radiological Society; institution received payment for image analysis services from Parexel. Other relationships: author has pending patent applications. A.M.N. Activities related to the present article: disclosed no relevant relationships. Activities not related to the present article: disclosed no relevant relationships. Other relationships: author has provisional patent application assigned to National Jewish Health. J.P.C. disclosed no relevant relationships. M.J.S. disclosed no relevant relationships. J.D.C. disclosed no relevant relationships. E.K.S. Activities related to the present article: disclosed no relevant relationships. Activities not related to the present article: has grants/grants pending with GlaxoSmithKline. Other relationships: disclosed no relevant relationships. D.A.L. Activities related to the present article: disclosed no relevant relationships. Activities not related to the present article: received research support from Parexel and Veracyte; received payment from Acceleron, Boehringer Ingelheim, and Genentech/Roche. Other relationships: author has pending patent application.
Abbreviations:
- CI
- confidence interval
- COPD
- chronic obstructive pulmonary disease
- COPDGene
- Genetic Epidemiology of COPD
- ECLIPSE
- Evaluation of COPD Longitudinally to Identify Predictive Surrogate End-points
- FEV1
- forced expiratory volume in 1 second
- FVC
- forced vital capacity
- LAA-950
- percentage of lung voxels with CT attenuation less than -950 HU
References
- 1.Chronic Obstructive Pulmonary Disease (COPD). National Institutes of Health. https://report.nih.gov/nihfactsheets/ViewFactSheet.aspx?csid = 77. Published 2010. Accessed July 20, 2018. [Google Scholar]
- 2.Labaki WW, Han MK. Improving Detection of Early Chronic Obstructive Pulmonary Disease. Ann Am Thorac Soc 2018;15(Suppl 4):S243–S248. [DOI] [PMC free article] [PubMed] [Google Scholar]
- 3.Lynch DA, Austin JH, Hogg JC, et al. CT-definable subtypes of chronic obstructive pulmonary disease: a statement of the Fleischner Society. Radiology 2015;277(1):192–205. [DOI] [PMC free article] [PubMed] [Google Scholar]
- 4.Gietema HA, Müller NL, Fauerbach PV, et al. Quantifying the extent of emphysema: factors associated with radiologists’ estimations and quantitative indices of emphysema severity using the ECLIPSE cohort. Acad Radiol 2011;18(6):661–671. [DOI] [PubMed] [Google Scholar]
- 5.Lynch DA, Moore CM, Wilson C, et al. CT-based Visual Classification of Emphysema: Association with Mortality in the COPDGene Study. Radiology 2018;288(3):859–866. [DOI] [PMC free article] [PubMed] [Google Scholar]
- 6.Halper-Stromberg E, Cho MH, Wilson C, et al. Visual assessment of chest computed tomographic images is independently useful for genetic association analysis in studies of chronic obstructive pulmonary disease. Ann Am Thorac Soc 2017;14(1):33–40. [DOI] [PMC free article] [PubMed] [Google Scholar]
- 7.Carr LL, Jacobson S, Lynch DA, et al. Features of COPD as predictors of lung cancer. Chest 2018;153(6):1326–1335. [DOI] [PMC free article] [PubMed] [Google Scholar]
- 8.COPDGene CT Workshop Group , Barr RG, Berkowitz EA, et al. A combined pulmonary-radiology workshop for visual evaluation of COPD: study design, chest CT findings and concordance with quantitative evaluation. COPD 2012;9(2):151–159. [DOI] [PMC free article] [PubMed] [Google Scholar]
- 9.Labaki WW, Martinez CH, Martinez FJ, et al. The role of chest computed tomography in the evaluation and management of the patient with chronic obstructive pulmonary disease. Am J Respir Crit Care Med 2017;196(11):1372–1379. [DOI] [PMC free article] [PubMed] [Google Scholar]
- 10.Gulshan V, Peng L, Coram M, et al. Development and validation of a deep learning algorithm for detection of diabetic retinopathy in retinal fundus photographs. JAMA 2016;316(22):2402–2410. [DOI] [PubMed] [Google Scholar]
- 11.Esteva A, Kuprel B, Novoa RA, et al. Dermatologist-level classification of skin cancer with deep neural networks. Nature 2017;542(7639):115–118 [Published correction appears in Nature 2017;546(7660):686.]. [DOI] [PMC free article] [PubMed] [Google Scholar]
- 12.Lakhani P, Sundaram B. Deep learning at chest radiography: automated classification of pulmonary tuberculosis by using convolutional neural networks. Radiology 2017;284(2):574–582. [DOI] [PubMed] [Google Scholar]
- 13.Regan EA, Hokanson JE, Murphy JR, et al. Genetic epidemiology of COPD (COPDGene) study design. COPD 2010;7(1):32–43. [DOI] [PMC free article] [PubMed] [Google Scholar]
- 14.Jones PW, Quirk FH, Baveystock CM, Littlejohns P. A self-complete measure of health status for chronic airflow limitation. The St. George’s Respiratory Questionnaire. Am Rev Respir Dis 1992;145(6):1321–1327. [DOI] [PubMed] [Google Scholar]
- 15.Mahler DA, Wells CK. Evaluation of clinical methods for rating dyspnea. Chest 1988;93(3):580–586. [DOI] [PubMed] [Google Scholar]
- 16.Rabe KF, Hurd S, Anzueto A, et al. Global strategy for the diagnosis, management, and prevention of chronic obstructive pulmonary disease: GOLD executive summary. Am J Respir Crit Care Med 2007;176(6):532–555. 10.1164/rccm.200703-456SO [DOI] [PubMed] [Google Scholar]
- 17.Vestbo J, Anderson W, Coxson HO, et al. Evaluation of COPD longitudinally to identify predictive surrogate end-points (ECLIPSE). Eur Respir J 2008;31(4):869–873. [DOI] [PubMed] [Google Scholar]
- 18.González G, Ash SY, Vegas-Sánchez-Ferrero G, et al. Disease staging and prognosis in smokers using deep learning in chest computed tomography. Am J Respir Crit Care Med 2018;197(2):193–203. [DOI] [PMC free article] [PubMed] [Google Scholar]
- 19.Donahue J, Anne Hendricks L, Guadarrama S, et al. Long-term recurrent convolutional networks for visual recognition and description. In: Proceedings of the IEEE Conference on Computer Vision and Pattern Recognition. Piscataway, NJ: IEEE, 2015; 2625–2634. [DOI] [PubMed] [Google Scholar]
- 20.Good PI. Resampling methods: a practical guide to data analysis. 3rd ed. Boston, Mass: Birkhäuser, 2006. [Google Scholar]
- 21.Park SH, Han K. Methodologic guide for evaluating clinical performance and effect of artificial intelligence technology for medical diagnosis and prediction. Radiology 2018;286(3):800–809. [DOI] [PubMed] [Google Scholar]
- 22.Müller NL, Staples CA, Miller RR, Abboud RT. “Density mask”. An objective method to quantitate emphysema using computed tomography. Chest 1988;94(4):782–787. [DOI] [PubMed] [Google Scholar]
- 23.Madani A, Zanen J, de Maertelaer V, Gevenois PA. Pulmonary emphysema: objective quantification at multi-detector row CT--comparison with macroscopic and microscopic morphometry. Radiology 2006;238(3):1036–1043. [DOI] [PubMed] [Google Scholar]
- 24.Castaldi PJ, San José Estépar R, Mendoza CS, et al. Distinct quantitative computed tomography emphysema patterns are associated with physiology and function in smokers. Am J Respir Crit Care Med 2013;188(9):1083–1090. [DOI] [PMC free article] [PubMed] [Google Scholar]
- 25.Yang J, Angelini ED, Smith BM, et al. Explaining radiological emphysema subtypes with unsupervised texture prototypes: MESA COPD study. In: Müller H, Kelm BM, Arbel T, et al., eds. Medical Computer Vision and Bayesian and Graphical Models for Biomedical Imaging. BAMBI 2016, MCV 2016. Lecture Notes in Computer Science, vol 10081. Cham, Switzerland: Springer, 2016; 69–80. [DOI] [PMC free article] [PubMed] [Google Scholar]
- 26.Song J, Yang J, Smith B, et al. Generative method to discover emphysema subtypes with unsupervised learning using lung macroscopic patterns (LMPS): The MESA COPD study. In: 2017 IEEE 14th International Symposium on Biomedical Imaging (ISBI 2017). Piscataway, NJ: IEEE, 2017; 375–378. [DOI] [PMC free article] [PubMed] [Google Scholar]
- 27.Dirksen A, Wille MM. Computed Tomography-based Subclassification of Chronic Obstructive Pulmonary Disease. Ann Am Thorac Soc 2016;13(Suppl 2):S114–S117. [DOI] [PubMed] [Google Scholar]
- 28.Dirksen A, MacNee W. The search for distinct and clinically useful phenotypes in chronic obstructive pulmonary disease. Am J Respir Crit Care Med 2013;188(9):1045–1046. [DOI] [PubMed] [Google Scholar]
- 29.Smith BM, Austin JH, Newell JD, Jr, et al. Pulmonary emphysema subtypes on computed tomography: the MESA COPD study. Am J Med 2014;127(1):94.e7–94.e23. [DOI] [PMC free article] [PubMed] [Google Scholar]
- 30.Walsh SLF, Calandriello L, Silva M, Sverzellati N. Deep learning for classifying fibrotic lung disease on high-resolution computed tomography: a case-cohort study. Lancet Respir Med 2018;6(11):837–845. [DOI] [PubMed] [Google Scholar]
- 31.Rolnick D, Veit A, Belongie S, Shavit N. Deep learning is robust to massive label noise. ArXiv170510694 [preprint]. https://arxiv.org/abs/1705.10694. Posted May 30, 2017. Accessed August 15, 2019. [Google Scholar]
- 32.Selvaraju RR, Cogswell M, Das A, Vedantam R, Parikh D, Batra D. Grad-cam: Visual explanations from deep networks via gradient-based localization. In: Proceedings of the IEEE International Conference on Computer Vision. Piscataway, NJ: IEEE, 2017; 618–626. [Google Scholar]
Associated Data
This section collects any data citations, data availability statements, or supplementary materials included in this article.


