

Abstract
Background
Reliable estimates for risk of cardiovascular‐specific mortality and progression to end‐stage renal disease (ESRD) among elderly patients undergoing major surgery are not available. This study aimed to develop simple risk scores to predict these events.
Methods
In a single‐centre cohort of elderly patients undergoing major surgery requiring hospital stay longer than 24 h, progression to ESRD and long‐term cardiovascular‐specific mortality were modelled using multivariable subdistribution hazard models, adjusting for co‐morbidity, frailty and type of surgery.
Results
Before surgery, 2·9 and 11·9 per cent of 16 655 patients had ESRD and chronic kidney disease (CKD) respectively. During the hospital stay, 46·9 per cent of patients developed acute kidney injury (AKI). Patients with kidney disease had a significantly higher risk of cardiovascular‐specific (CV) mortality compared with patients without kidney disease (adjusted hazard ratio (HR) for CKD without AKI 1·60, 95 per cent c.i. 1·25 to 2·01; AKI without CKD 1·70, 1·52 to 1·87; AKI with CKD 2·80, 2·50 to 3·20; ESRD 5·21, 4·32 to 6·27), as well as increased progression to ESRD (AKI without CKD 5·40, 3·44 to 8·35; CKD without AKI 8·80, 4·60 to 17·00; AKI with CKD 31·60, 19·90 to 49·90). CV Death and ESRD Risk scores were developed to predict CV mortality and progression to ESRD. Calculated CV Death and ESRD Risk scores performed well with c‐statistics: 0·77 (95 per cent c.i. 0·76 to 0·78) and 0·82 (0·78 to 0·86) respectively at 1 year.
Conclusion
Kidney disease in elderly patients undergoing major surgery is associated with a high risk of CV mortality and progression to ESRD. Risk scores can augment the shared decision‐making process of informed consent and identify patients requiring postoperative renal‐protective strategies.
This study demonstrated a higher rate of progression to end‐stage renal disease (ESRD) and cardiovascular‐specific mortality in elderly patients with kidney disease undergoing major surgery. Two clinical risk scores, CV Death Risk and ESRD Risk, can be calculated easily at hospital discharge from available clinical data to identify patients who require additional perioperative management.
Better follow‐up after AKI required
Antecedentes
No se dispone de estimaciones fiables acerca del riesgo de mortalidad cardiovascular y de progresión a insuficiencia renal terminal (end‐stage renal disease, ESRD) en pacientes longevos a los que se realiza cirugía mayor. Este estudio tiene como objetivo desarrollar un sistema de puntuación simple de riesgos para predecir estos eventos.
Métodos
En una cohorte de un solo centro de 16.655 pacientes longevos a los que se realizó cirugía mayor con hospitalización de más de 24 horas, se estimó la progresión a ESRD y la mortalidad cardiovascular a largo plazo utilizando modelos multivariables de subdistribucion de riesgos ajustados por comorbilidades, fragilidad y tipo de cirugía.
Resultados
Antes de la cirugía, presentaron ESRD y enfermedad renal crónica (chronic kidney Disease, CKD) un 2,9% y un 12,3% de los pacientes, respectivamente. Durante la hospitalización, el 46,9% de los pacientes desarrollaron insuficiencia renal aguda (acute kidney injury, AKI). Los pacientes con enfermedad renal tenían un riesgo significativamente mayor de mortalidad cardiovascular (CV) en comparación con los pacientes sin enfermedad renal para presentar AKI (cociente de riesgos instantáneos, hazard ratio, HR ajustado) 1,6 (i.c. del 95% 1,3‐2,0), AKI sin CKD 1,7 (1,5‐1,9), AKI en presencia de CKD 2,8 (2,5‐3,2) y ESRD 5,2 (4,3‐6,3), así como una mayor progresión a ESRD (AKI sin CKD 5,4 (3,4‐8,4), CKD sin AKI 8,8 (4,6‐17), y AKI en presencia de CKD 31,6 (19,9‐49,9)). Se desarrollaron las escalas CV Death y ESRD Risk para predecir la mortalidad cardiovascular y la progresión a ESRD. Ambas escalas funcionaron bien a 1 año con un coeficiente de concordancia de 0,77 (i.c. del 95% 0,76‐0,78) y 0,82 (0,78‐0,86) respectivamente.
Conclusión
La enfermedad renal en pacientes longevos tras cirugía mayor se asocia con un elevado riesgo de mortalidad cardiovascular y de progresión a ESRD. Las escalas de riesgo pueden facilitar la toma de decisiones en el momento del consentimiento informado e identificar los pacientes que requieren estrategias de protección renal postoperatorias.
Introduction
As the World's population ages, the proportion of elderly patients undergoing major surgery is increasing1. Both acute and chronic kidney disease are prevalent among the elderly2, 3, attributable to an age‐related decreased renal mass in the elderly4 and increased prevalence of other renal risk factors such as diabetes, hypertension and cardiac disease. Kidney disease is associated with poor short‐ and long‐term outcomes among the general population5. Chronic kidney disease (CKD) is an independent risk factor for cardiovascular risk and mortality6, 7. Acute kidney injury (AKI) also increases the risk of cardiovascular disease, either independently or through impact on CKD progression8, 9. Both acute and chronic kidney disease increase the risk of cardiovascular mortality after major surgery10.
Previous studies2, 11 investigating the long‐term outcomes of kidney disease in elderly patients undergoing major surgery have been limited by small sample sizes. This knowledge gap is significant because elderly patients may be more susceptible to both perioperative AKI and to progression to CKD and end‐stage renal disease (ESRD)1, 12, as well as having a higher prevalence of underlying cardiac disease. Characterizing associations between kidney disease and long‐term outcomes, and predicting the likelihood of adverse events, can provide clinical benefit by augmenting the shared decision‐making process of informed consent for surgery, identifying patients who require perioperative renal‐protective strategies, providing patients with postoperative preventive plans and education, and reducing healthcare costs. Simple accurate risk scores that utilize accessible routine data to predict outcomes would improve these clinical benefits.
For the purposes of this study, it was hypothesized that elderly patients with kidney disease would be at increased risk of cardiovascular‐specific (CV) mortality and progression to ESRD following major surgery, and that these events could be predicted accurately using data available before and during surgery. The aim was to analyse a large cohort of elderly patients undergoing major surgery, to characterize associations between kidney disease and long‐term CV mortality and progression to ESRD, adjusting for co‐morbidity, frailty and perioperative risk factors, and to develop risk scores to predict CV mortality and progression to ESRD.
Methods
A single‐centre cohort analysis was performed, consisting of the elderly patients (aged 65 years or more) from a previously assembled cohort of 51 457 adults who underwent inpatient major surgery (defined as surgery requiring more than 24 h of hospital stay) over a 10‐year period ending on 30 November 201012.
The study received approval from the Institutional Review Board and Privacy Office of the University of Florida. For all patients, CV mortality and progression to ESRD was assessed for up to 10 years after discharge, and associations with perioperative AKI and CKD were assessed by competing risk analysis.
Outcomes
Hospital records and the Social Security Death Index were used to determine date of death. The primary cause of death was obtained based on death certificates from the Florida Bureau of Vital Statistics using a matching algorithm that used full name, date of birth and date of death in the ICD‐10 format. Cause of death was missing from 10·0 per cent (779 of 7768) of all death certificates, probably representing death records from other states. ICD‐10 codes were used to classify deaths into CV causes (codes E10–E14, I00–I99, N00–N08, N10–N16, N17–N19, Q20–Q28), cancer‐specific (codes C00–C97) and all other causes. ICD‐10 codes for kidney disease and diabetes were classified in the expanded CV group to include deaths associated with CKD6. Sensitivity analyses were performed by: censoring all patients known to be alive or who had died after 31 October 2011; excluding records without cause of death; and using an alternative approach to classify CV deaths13, 14.
Progression to ESRD after discharge and the timing of this progression were determined by linking records of discharged patients with the US Renal Data System database15 and calculating the time from discharge date to first ESRD service date.
Definition of kidney disease and co‐variables
A reference value for creatinine was established using the minimum serum creatinine level available within 6 months before the index admission, including the value on the day of admission16, 17. For patients with no previous creatinine value within 6 months before admission and no history of CKD, an estimated reference serum creatinine level was used. This estimated reference value was calculated based on the Modification of Diet in Renal Disease Study equation for creatinine18, assuming a glomerular filtration rate of 75 ml per min per 1·73 m2. All available creatinine values during the index hospital admission were then evaluated for the presence of AKI using Kidney Disease: Improving Global Outcomes (KDIGO) criteria19, defined as an increase of at least 0·3 mg/dl in serum creatinine concentration within 48 h or a 50 per cent increase from the reference creatinine level. Renal replacement therapy was determined using daily billing charges. Complete renal recovery after AKI was defined as the serum creatinine concentration returning to within 50 per cent of the baseline creatinine value by the time of hospital discharge and the absence of renal replacement therapy. Preadmission diagnosis of CKD and ESRD was determined using a validated combination of ICD‐9‐CM codes. CKD was determined using a calculated reference estimated glomerular filtration rate (eGFR) based on reference serum creatinine standardized for sex, race and age, according to guidelines16, 20. Race information was missing from 2 per cent of the cohort, which were considered as non‐African American ethnicity. Patients with CKD were stratified into mild to moderate (eGFR 30 ml per min per 1·73 m2 or above) and severe (eGFR less than 30 ml per min per 1·73 m2) CKD groups using reference eGFR without criteria for albuminuria according to consensus guidelines21.
Underlying co‐morbidities were identified using previously described criteria, and the combination of ICD‐9‐CM codes and Charlson–Deyo co‐morbidity index22, 23. Admission haemoglobin values were categorized as missing, less than 10 g/dl, 10–11·9 g/dl and at least 12 g/dl, similar to the values used previously in patients with kidney disease. These values were developed using univariable analysis of the spline function of haemoglobin values and risk of mortality24. Further methodological details are provided in Appendix S1 (supporting information). Frailty is a multidimensional syndrome characterized by increased vulnerability to illness, loss of individual reserve, and decreased resistance to stressors. The intention was to capture physical and cognitive frailty, as both are critical; however, definitions of physical and cognitive frailty make it challenging to operationalize, because no clearcut diagnosis codes are available. Instead, a set of ICD‐9 codes that correspond to conditions linked to physical and cognitive impairment in older adults was used to classify patients as having high, moderate or no frailty (Table S1 , supporting information).
Statistical analysis
The TRIPOD (Transparent Reporting of a multivariable prediction model for Individual Prognosis Or Diagnosis) recommendations were followed. Pairwise comparisons of kidney disease groups with respect to no known kidney disease were performed with Fisher's exact test for categorical variables and Wilcoxon's rank sum test or t test for continuous variables, as appropriate, using Bonferroni adjustment. Cumulative survival probabilities for all‐cause mortality were calculated using Kaplan–Meier estimates. Fine–Gray proportional subdistribution hazard regression analyses were used to model CV mortality, and any other cause of death was treated as a competing risk25. Progression to ESRD was similarly modelled, and death from any cause before ESRD was treated as a competing risk26. Best estimation of the impact of model co‐variables can be obtained by regression modelling directly on a cumulative incidence function27. In addition to occurrence of kidney disease (ESRD, CKD, AKI, and AKI with CKD), each model was adjusted for age, sex, African American ethnicity, Charlson–Deyo co‐morbidity index score, surgery type, emergency surgery status, admission haemoglobin level and frailty score. Explanatory variables were selected based on their significance in a prior univariable analysis and previously reported association in the literature. Using scaled Schoenfeld residuals, it was confirmed that the proportional hazard assumption was satisfied for all variables in the model26. For each co‐variable in the model, adjusted hazard ratios (HR) with 95 per cent c.i. were reported. Adjusted HRs, running the same models among hospital survivors as a sensitivity analysis, were also obtained. Adjusted model‐based cumulative incidence functions of CV mortality and progression to ESRD were plotted by kidney disease. To produce a more representative incidence curve, directly adjusted cumulative estimates for kidney disease were obtained using the implementation of Fine and Gray's weighted estimating equation, which is part of the R 3.2.0 package cmprsk28, 29. Statistical significance for each group compared to reference group was reported using the Wald χ2 test based on Fine–Gray proportional subdistribution hazard regression models.
For the purpose of internal validation, and assessing the accuracy of the model, a bootstrap cross‐validation method was used to train models on 1000 replicates of 16 655 observations drawn from the full data set with replacement. For each bootstrap replicate, the trained models were validated on the observations from the full data set that were not used for training. The discriminative power of competing risk models was calculated by the C‐index, which is an adaptation of Harrell concordance probability estimate to the competing risk setting, using inverse probability of censoring weights to adjust for right censoring. C‐index values were reported for training and validation data sets, with the 95 per cent c.i. calculated across the bootstrap samples30. The C‐index function from the R 3.2.0 package pec (prediction error curves) was used to perform the bootstrap cross‐validation and calculate the C‐index value.
Two simple scores were developed to calculate the risk of progression to ESRD and CV mortality at the time of discharge, with ranges of 0–81 and 0–48 respectively, using the competing risk regression model31. Age was categorized into 5‐year age groups (65–69, 70–74, 75–79 and 80 years or more), and other variables were kept the same in the competing risk models. For each risk factor, regression coefficients were estimated, multiplied by ten, and rounded to the nearest integer, representing the component of the score attributable to the presence of that risk factor. A score of zero was assigned for reference levels of the categorical variables, and estimated total risk scores were obtained as the sum of the scores for each risk factor31. Subjects were divided into five equal risk strata based on the quintiles of the estimated total risk score. Strata with similar cumulative incidence were combined and further grouped to low, moderate or high risk for simplicity. The incidence of progression to ESRD and CV mortality were then estimated for each of the risk strata using the empirical cumulative incidence function. All significance tests were two‐sided. P < 0·050 was considered statistically significant. R 3.2.0 (R Foundation for Statistical Computing, Vienna, Austria) and SAS® version 9.4 (SAS Institute, Cary, North Carolina, USA) were used to perform statistical analysis. Further details are provided in Appendix S1 (supporting information).
Results
Prevalence of kidney disease
Among 16 655 elderly patients requiring hospital admission for at least 24 h after major surgery, 8791 (52·8 per cent) had evidence of kidney disease during the hospital stay (Table 1; Table S2 , supporting information). Most of this disease burden was incurred in the perioperative and postoperative settings. At the time of admission, 1984 (11·9 per cent) and 481 (2·9 per cent) patients had pre‐existing diagnoses of CKD and ESRD respectively. During hospitalization, 7817 patients (46·9 per cent) developed AKI; 6326 (38·0 per cent) had de novo AKI with no previous history of CKD, and 1491 (9·0 per cent) had AKI superimposed on pre‐existing CKD. Of these 7817 patients with AKI, 4885 (62·5 per cent) had complete renal recovery. Subjects with AKI superimposed on pre‐existing CKD had lower incidence of complete renal recovery than those with de novo AKI (461 of 1491 (30·9 per cent) versus 4424 of 6326 (69·9 per cent); P < 0·001). Patients with any form of kidney disease were more likely to be from older patient groups, of African American ethnicity, and to have multiple co‐morbidities. Most patients with CKD (1492, 9·0 per cent) had mild to moderate kidney disease (eGFR 30 ml per min per 1·73 m2 or above), and only 492 patients (3·0 per cent) had severe disease (eGFR less than 30 ml per min per 1·73 m2) (Table 1).
Table 1.
Clinical characteristics of the 16 655 patients, stratified by kidney disease
| No known kidney disease (n = 7864) | AKI without CKD (n = 6326) | AKI with CKD (n = 1491) | CKD without AKI (n = 493) | ESRD (n = 481) | |
|---|---|---|---|---|---|
| Age (years) * | 73(6) | 74(6)# | 75(7)# | 76(7)# | 72(6)# |
| Sex ratio (F : M) | 4123 : 3741 | 3038 : 3288** | 585 : 906** | 237 : 256 | 183 : 298** |
| African American ethnicity | 445 (5·7) | 400 (6·3) | 190 (12·7)** | 44 (8·9)** | 108 (22·5)** |
| Emergency surgery | 2223 (28·3) | 3001 (47·4)** | 836 (56·1)** | 186 (37·7)** | 298 (62·0)** |
| Rural area residency | 2342 (29·8) | 1984 (31·4)** | 512 (34·3) | 158 (32·0) | 141 (29·3) |
| Distance from residing neighbourhood to hospital (miles) † | 30 (14–71) | 32 (16–74)# | 30 (14–73) | 30 (14–66) | 35 (13–85) |
| Population living in poverty in residing neighbourhood (%) * | 14(8) | 14(8) | 15(8)# | 14(8) | 15(9) |
| Primary insurance | |||||
| Medicare | 128 (1·6) | 144 (2·3)** | 35 (2·3) | 8 (1·6) | 13 (2·7) |
| Medicaid | 7157 (91·0) | 5642 (89·2) | 1348 (90·4) | 466 (94·5) | 420 (87·3) |
| Private | 551 (7·0) | 518 (8·2) | 105 (7·0) | 19 (3·9) | 46 (9·6) |
| Uninsured | 28 (0·4) | 22 (0·3) | 3 (0·2) | 0 (0) | 2 (0·4) |
| Emergency surgery | 2223 (28·3) | 3001 (47·4)** | 836 (56·1)** | 186 (37·7)** | 298 (62·0)** |
| Weekend admission | 684 (8·7) | 961 (15·2)** | 259 (17·4)** | 56 (11·4) | 79 (16·4)** |
| Charlson–Deyo co‐morbidity score | |||||
| 0 | 2445 (31·1) | 1123 (17·8)** | 115 (7·7)** | 70 (14·2)** | 0 (0)** |
| 1 | 1708 (21·7) | 1568 (24·8)** | 205 (13·7)** | 66 (13·4)** | 5 (1·0)** |
| 2 | 1650 (21·0) | 1569 (24·8)** | 303 (20·3) | 101 (20·5) | 99 (20·6) |
| ≥ 3 | 2061 (26·2) | 2066 (32·7)** | 868 (58·2)** | 256 (51·9)** | 377 (78·4)** |
| Co‐morbidity | |||||
| Hypertension | 4686 (59·6) | 3753 (59·3) | 905 (60·7) | 358 (72·6)** | 334 (69·4)** |
| Cancer | 2245 (28·5) | 1656 (26·2)** | 247 (16·6)** | 115 (23·3) | 36 (7·5)** |
| Diabetes | 1546 (19·7) | 1273 (20·1) | 431 (28·9)** | 151 (30·6)** | 214 (44·5)** |
| Chronic pulmonary disease | 1432 (18·2) | 1530 (24·2)** | 422 (28·3)** | 108 (21·9) | 90 (18·7) |
| Peripheral vascular disease | 1085 (13·8) | 1461 (23·1)** | 462 (31·0)** | 120 (24·3)** | 92 (19·1)** |
| Cerebrovascular disease | 632 (8·0) | 843 (13·3)** | 176 (11·8)** | 42 (8·5) | 42 (8·7) |
| Congestive heart failure | 451 (5·7) | 954 (15·1)** | 428 (28·7)** | 81 (16·4)** | 102 (21·2)** |
| Myocardial infarction | 619 (7·9) | 792 (12·5)** | 242 (16·2)** | 78 (15·8)** | 70 (14·6)** |
| Liver disease | 181 (2·3) | 248 (3·9)** | 84 (5·6)** | 9 (1·8) | 13 (2·7) |
| Surgery type | |||||
| Cardiothoracic | 789 (10·0) | 1476 (23·3)** | 429 (28·8)** | 64 (13·0) | 90 (18·7)** |
| Neurological | 1475 (18·8) | 821 (13·0)** | 114 (7·6)** | 74 (15·0) | 23 (4·8)** |
| Non‐cardiac general surgery‡ | 1700 (21·6) | 1578 (24·9)** | 372 (24·9) | 120 (24·3) | 151 (31·4)** |
| Specialty surgery§ | 3368 (42·8) | 1653 (26·1)** | 364 (24·4)** | 202 (41·0) | 43 (8·9)** |
| Other¶ | 532 (6·8) | 798 (12·6)** | 212 (14·2)** | 33 (6·7) | 174 (36·2)** |
| Admission haemoglobin (g/dl) | |||||
| Missing | 2628 (33·4) | 1201 (19·0)** | 274 (18·4)** | 169 (34·3) | 103 (21·4)** |
| < 10 | 1032 (13·1) | 1221 (19·3)** | 382 (25·6)** | 86 (17·4) | 90 (18·7)** |
| 10–11·9 | 1968 (25·0) | 1859 (29·4)** | 456 (30·6)** | 143 (29·0) | 148 (30·8) |
| ≥ 12 | 2236 (28·4) | 2045 (32·3)** | 379 (25·4) | 95 (19·3)** | 140 (29·1) |
| CKD | |||||
| Mild to moderate | n.a. | n.a. | 1031 (69·1)†† | 461 (93·5) | n.a. |
| Severe | n.a. | n.a. | 460 (30·9)†† | 32 (6·5) | n.a. |
| Frailty status | |||||
| None | 3304 (42·0) | 1637 (25·9)** | 149 (10·0)** | 120 (24·3)** | 25 (5·2)** |
| Moderate | 2002 (25·5) | 1561 (24·7) | 390 (26·2) | 150 (30·4) | 241 (50·1)** |
| High | 2558 (32·5) | 3128 (49·4)** | 952 (63·8)** | 223 (45·2)** | 215 (44·7)** |
Values in parentheses are percentages unless indicated otherwise: values are
mean(s.d.) and
median (i.q.r.).
Includes gastrointestinal, oncology and vascular operations;
includes orthopaedic, gynaecological, ear nose and throat, urological and plastic surgery;
includes surgery for trauma, burns and transplants. AKI, acute kidney injury; CKD, chronic kidney disease; ESRD, end‐stage renal disease; n.a., not applicable.
P < 0·050 versus no known kidney disease (Wilcoxon rank sum test or t test as appropriate, using Bonferroni adjustment);
P < 0·050 versus no known kidney disease (Fisher's exact test, using Bonferroni adjustment);
P < 0·050 versus CKD without AKI (Fisher's exact test).
Progression to end‐stage renal disease
Progression to ESRD disproportionately affected patients with pre‐existing CKD who developed AKI during hospital stay. Of 15 211 patients with no previous history of ESRD who were discharged alive, 278 (1·8 per cent) progressed to ESRD after discharge. When death from any cause was treated as a competing risk, the cumulative incidence of progression to ESRD within 5 years was highest in patients with CKD who developed AKI, with an adjusted cumulative incidence estimate of 8·5 per cent, compared with 0·3, 1·5 and 2·5 per cent for patients with no kidney disease, AKI with no CKD, and CKD with no AKI respectively (P < 0·001) (Fig. 1 a and Table 2). Patients with AKI and underlying CKD whose renal function did not return to their baseline value at the time of discharge had significantly higher progression to ESRD than those whose renal function returned to baseline (5‐year cumulative incidence of ESRD 11·9 versus 2·3 per cent respectively; P < 0·001) (Fig. 1 b).
Figure 1.
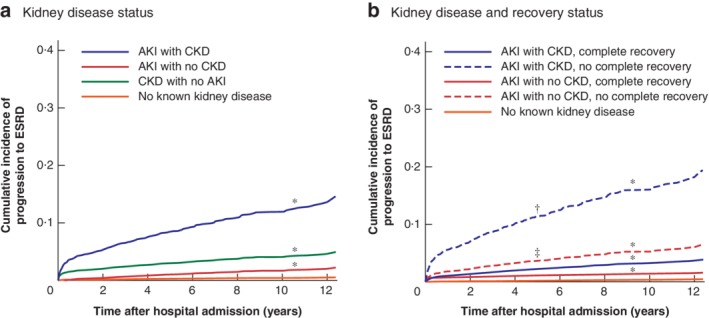
Adjusted cumulative incidence curves for progression to end‐stage renal disease a Kidney disease status and b kidney disease and recovery status (adjusted for age, sex, ethnicity, Charlson co‐morbidity index score, emergency surgery status, frailty score, surgery type and admission‐day haemoglobin level). AKI, acute kidney injury; CKD, chronic kidney disease; ESRD, end‐stage renal disease. *P < 0·001 versus no known kidney disease; †P < 0·001 versus AKI with CKD, complete recovery; ‡P < 0·001 versus AKI with no CKD, complete recovery (Wald χ2 test based on Fine–Gray proportional subdistribution hazard regression model).
Table 2.
Adjusted 5‐year cumulative incidence of cancer and cardiovascular‐specific mortality, and progression to end‐stage renal disease by kidney disease status
| No. of patients | 5‐year cancer‐specific mortality (%) | 5‐year cardiovascular‐specific mortality (%) | 5‐year progression to ESRD (%) | |
|---|---|---|---|---|
| No known kidney disease | 7864 | 14·8 | 8·1 | 0·3 |
| CKD without AKI | 493 | 8·9* | 12·5* | 2·5* |
| AKI without CKD | 6326 | 15·6 | 13·2* | 1·5* |
| AKI with CKD | 1491 | 7·7* | 20·8* | 8·5* |
| ESRD | 481 | 2·3* | 33·8* | n.a. |
ESRD, end‐stage renal disease; CKD, chronic kidney disease; AKI, acute kidney injury; n.a., not applicable.
P < 0·001 versus no known kidney disease (Wald χ2 test based on Fine–Gray proportional subdistribution hazard regression model).
Based on unadjusted and adjusted models, patients who had AKI with CKD had up to a 30‐fold increase in HR for progression to ESRD compared with patients with no kidney disease (adjusted HR: 5·40 (95 per cent c.i. 3·44 to 8·35) for AKI without CKD; 8·80 (4·60 to 17·00) for CKD without AKI) (Table 3; Table S3 , supporting information). Adjusted HRs remained similar when models were run on the cohort excluding the 1022 patients (6·1 per cent) who died in hospital.
Table 3.
Adjusted hazard ratios for progression to end‐stage renal disease and cardiovascular‐specific mortality using multivariable subdistribution hazard models
| Adjusted hazard ratio* | ||
|---|---|---|
| Progression to ESRD | Cardiovascular‐specific mortality | |
| Kidney disease | ||
| No known kidney disease | 1·00 (reference) | 1·00 (reference) |
| AKI without CKD | 5·40 (3·44, 8·35)† | 1·70 (1·52, 1·87)† |
| AKI with CKD | 31·60 (19·90, 49·90)† | 2·80 (2·50, 3·20)† |
| CKD without AKI | 8·80 (4·60, 17·00)† | 1·60 (1·25, 2·01)† |
| ESRD | n.a. | 5·21 (4·32, 6·27)† |
| Age (per 1‐year increase) | 0·95 (0·93, 0·97)† | 1·04 (1·03, 1·04)† |
| Male sex (versus female) | 0·98 (0·79, 1·23) | 1·10 (1·01, 1·19)† |
| African American ethnicity (versus other) | 2·08 (1·58, 2·75)† | 1·12 (0·97, 1·29) |
| Charlson–Deyo co‐morbidity score | ||
| 0 | 1·00 (reference) | 1·00 (reference) |
| 1 | 1·21 (0·88, 1·68) | 1·27 (1·09, 1·47)† |
| 2 | 1·55 (1·00, 2·41) | 1·41 (1·22, 1·63)† |
| ≥ 3 | 2·11 (1·40, 3·19)† | 1·33 (1·16, 1·53)† |
| Emergency surgery (versus elective) | 1·10 (0·90, 1·40) | 1·38 (1·26, 1·50)† |
| Surgery type | ||
| Specialty surgery | 1·00 (reference) | 1·00 (reference) |
| Cardiothoracic | 1·33 (0·96, 1·86) | 2·25 (1·99, 2·53)† |
| Neurological | 0·47 (0·26, 0·85)† | 1·49 (1·30, 1·71)† |
| Non‐cardiac general surgery | 1·58 (1·17, 2·14)† | 1·56 (1·39, 1·75)† |
| Other | 1·38 (0·95, 2·00) | 0·72 (0·60, 0·86)† |
| Admission haemoglobin (g/dl) | ||
| ≥ 12 | 1·00 (reference) | 1·00 (reference) |
| < 10 | 1·36 (0·99, 1·88) | 1·06 (0·94, 1·20) |
| 10–11·9 | 1·21 (0·89, 1·64) | 1·12 (1·01, 1·24)† |
| Missing | 1·21 (0·88, 1·68) | 1·00 (0·89, 1·12) |
| Frailty status | ||
| None | 1·00 (reference) | 1·00 (reference) |
| Moderate | 0·96 (0·71, 1·29) | 1·32 (1·15, 1·51)† |
| High | 0·60 (0·44, 0·83)† | 1·86 (1·64, 2·09)† |
| C‐statistic for model at 5 years in validation data set | 0·83 (0·80, 0·86) | 0·83 (0·80, 0·87) |
Values in parentheses are 95 per cent confidence intervals. ESRD, end‐stage renal disease; AKI, acute kidney injury; CKD, chronic kidney disease; n.a., not applicable.
P < 0·050.
Charlson–Deyo co‐morbidity score of three or more, and surgery type (neurological, non‐cardiac general and vascular) were significantly associated with progression to ESRD. Increasing age and high frailty score had a decreased risk of progression to ESRD. Patients with higher frailty have higher mortality and lesser chance of progression to ESRD than those with no frailty. Multivariable models including the interactions between kidney disease and frailty, and between kidney disease and age, were developed as a sensitivity analysis. HRs for age and frailty in the multivariable models with and without interaction terms were similar at each level of kidney disease. Model performance was excellent in the validation data set, with C‐index values of 0·86 (95 per cent c.i. 0·82 to 0·90), 0·83 (0·80 to 0·86) and 0·83 (0·80 to 0·86) at 1, 5 and 10 years respectively. No significant difference was found between the C‐indices of competing risk models applied to training and validation cohorts (P > 0·050).
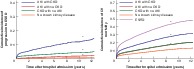
Using a competing risk model, an ESRD Risk score was derived to calculate the risk of progression to ESRD at hospital discharge using nine clinical variables (Table S4 , supporting information; available at https://prismap.medicine.ufl.edu/risk_calculator/esrd_risk_calculator). Patients were categorized into three risk categories: low, moderate and high. Patients in the low‐risk category (ESRD Risk score below 39) had a 5‐year rate of progression to ESRD of 0·4 per cent, whereas those in the high‐risk category (ESRD Risk score above 47) had a 5‐year rate of 6·1 per cent (Fig. 2 a). In the validation data set, the ESRD Risk score model had C‐index values of 0·82 (95 per cent c.i. 0·78 to 0·86), 0·79 (0·76 to 0·82) and 0·79 (0·75 to 0·82) at 1, 5 and 10 years respectively.
Figure 2.
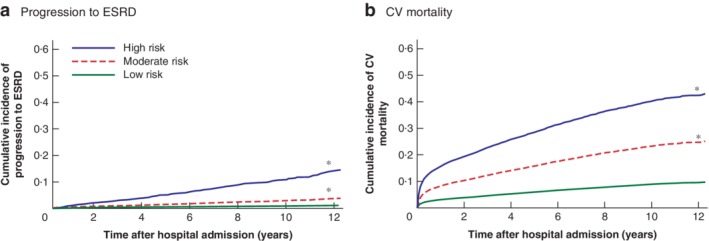
Cumulative incidence curves of simplified score for progression to end‐stage renal disease and cardiovascular‐specific mortality at discharge a Progression to end‐stage renal disease (ESRD) and b cardiovascular‐specific (CV) mortality at discharge. Low risk: ESRD Risk score less than 39, CV Death Risk score less than 20; moderate risk: ESRD Risk score 39–47, CV Death Risk score 20–24; high risk: ESRD Risk score above 47, CV Death Risk score above 24. *P < 0·001 versus low group (Wald χ2 test based on Fine–Gray proportional subdistribution hazard regression model).
Using the ESRD Risk score, 81·4 per cent (12 938 of 15 896) of patients with no progression to ESRD after discharge had a low or moderate ESRD Risk score, whereas 66·2 per cent (184 of 278) of those with progression to ESRD after discharge had a high ESRD Risk score. Some 18·5 per cent (34 of 184) of the patients with a high ESRD Risk score did not have CKD before surgery.
All‐cause mortality and cause of death
Patients with baseline renal dysfunction who developed AKI after surgery without complete renal recovery at the time of discharge had increased long‐term all‐cause mortality. The median duration of follow‐up for the entire cohort was 7 (maximum 13) years.
Patients with any type of kidney disease had a significantly lower long‐term survival rate for all‐cause mortality compared with patients with no kidney disease (P < 0·001), after adjusting for all co‐variables. At 5‐year follow‐up, the cumulative survival rate for those without kidney disease was 70·3 per cent, compared with 37·7–57·8 per cent for patients who had kidney disease (Fig. S1a , supporting information). Patients with AKI without complete renal recovery by the time of hospital discharge had a significant decrease in survival compared with patients who did recover, with a 5‐year cumulative survival rate of 50·1 per cent for AKI superimposed on CKD with renal recovery versus 37·4 per cent in patients who had AKI and CKD with no recovery. In patients with AKI alone (no CKD), the cumulative survival rate was 56·5 per cent after recovery from AKI versus 43·7 per cent in those with no recovery from AKI (P < 0·001) (Fig. S1b , supporting information).
Among all 7768 deaths, the top two causes were cardiovascular disease (2449 patients, 31·5 per cent) and cancer (2432, 31·3 per cent), followed by accidents, injury, poison or homicide (322, 4·1 per cent), chronic lower respiratory disease (313, 4·0 per cent) and cerebrovascular disease (249, 3·2 per cent) (Table S5 , supporting information). More deaths were attributed to cardiovascular disease in patients who had kidney disease of any kind compared with deaths in those without kidney disease (P < 0·001). In contrast, fewer deaths were attributed to cancer in patients with any type of kidney disease than in those with no kidney disease (Fig. S2 , supporting information).
Cardiovascular‐specific mortality
Patients with pre‐existing CKD who developed AKI during hospital stay had increased long‐term CV mortality (Fig. 3). At 5 years after discharge, patients who had AKI with CKD had a greater likelihood of dying from a cardiovascular cause than of progressing to ESRD or dying from cancer (Table 2). When stratified by age group and sex, adjusted CV mortality associated with kidney disease remained increased, with men aged 80 years or above and with the most severe kidney disease faring worse than women (5‐year cumulative incidence 58·4 versus 32·3 per cent respectively for the ESRD group and 31·1 versus 23·3 per cent for the AKI with CKD group) (Fig. S3 , supporting information).
Figure 3.
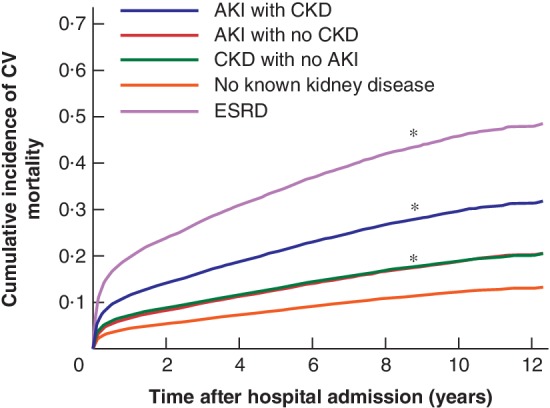
Adjusted cumulative incidence curves for cardiovascular‐specific mortality by kidney disease status Adjusted for age, sex, ethnicity, Charlson co‐morbidity index score, emergency surgery status, frailty score, surgery type and admission‐day haemoglobin level. CV, cardiovascular‐specific; ESRD, end‐stage renal disease; AKI, acute kidney injury; CKD, chronic kidney disease. *P < 0·050 versus no known kidney disease (Wald χ2 test based on Fine–Gray proportional subdistribution hazard regression model).
In the multivariable model, patients with kidney disease had significantly higher adjusted HRs for CV mortality, ranging from 1·60 (95 per cent c.i. 1·25 to 2·01) for patients with CKD and no AKI to 5·21 (4·32 to 6·27) for those who had ESRD before admission. Adjusted HRs for AKI without CKD and AKI superimposed on CKD were 1·70 (1·52 to 1·87) and 2·80 (2·50 to 3·20) respectively (Table 3). Adjusted HRs for kidney disease groups were reduced slightly compared with unadjusted HRs (Table S3 , supporting information). Age, sex, Charlson–Deyo co‐morbidity score, frailty score, haemoglobin level of 10–12 g/dl on admission, emergency surgery status and surgery type were significantly associated with CV mortality. Adjusted HRs remained similar when models were run on the cohort excluding the 1022 patients who died in hospital. Model performance was excellent in the validation data set, with C‐index values of 0·87 (95 per cent c.i. 0·83 to 0·91), 0·83 (0·80 to 0·87) and 0·82 (0·80 to 0·86) at 1, 5 and 10 years, respectively. There were no significant differences between the C‐indices of competing risk models applied to training and validation cohorts (P > 0·050).
Using a competing risk model, a CV Death Risk score was derived to calculate the risk of CV mortality at hospital discharge using nine clinical variables (Table S6 , supporting information; available at https://prismap.medicine.ufl.edu/risk_calculator/cv_risk_calculator). Patients were categorized as having low, moderate or high risk. Patients in the low‐risk category (CV Death Risk score below 20) had the lowest 5‐year rate of CV death at 5·9 per cent, whereas those in the high‐risk category (CV Death Risk score above 24) had a 5‐year rate of 28·9 per cent (Fig. 2 b). In the validation data set, the CV Death Risk score model had C‐indices of 0·77 (95 per cent c.i. 0·76 to 0·78), 0·72 (0·71 to 0·74) and 0·70 (0·68 to 0·71) at 1, 5 and 10 years respectively.
Of 2449 patients with long‐term CV mortality after surgery, 1732 (70·7 per cent) had a high CV Death Risk score. Some 53·9 per cent of these patients (934 of 1732) had no documented cardiovascular disease before surgery.
Discussion
This study of a large single‐centre cohort of elderly patients undergoing surgery found that having both acute and chronic kidney disease in the perioperative period was associated with up to fivefold increased long‐term CV mortality and 30‐fold increased progression to ESRD. This association was independent of the underlying co‐morbidity burden, frailty and type of surgery, and was particularly strong in male octogenarians compared with women. Increasing age and high frailty score had a decreased risk of progression to ESRD, which might be due to the competing risk of all causes of death occurring before progression to ESRD. Despite the fact that most patients did not have CKD before surgery, half of the cohort experienced an episode of perioperative AKI. Among patients with AKI, the absence of renal recovery was associated with an up to fourfold increased progression to ESRD and an approximately 13 per cent decreased probability of survival 5 years after discharge. Elderly patients with AKI superimposed on underlying CKD were the most vulnerable group, with a 5‐year cumulative CV mortality rate of 20·8 per cent, after patients with ESRD who had a CV mortality rate of 33·8 per cent.
Progression to ESRD was significantly more common among patients with any form of kidney disease in the perioperative setting. When superimposed on pre‐existing CKD, AKI may expedite progression to ESRD9, rendering these patients more susceptible to CV death, with mortality rates comparable to those in patients with pre‐existing ESRD. Non‐recovery of renal function after an episode of AKI was an important contributor to ESRD progression. Patients with pre‐existing CKD who developed a perioperative AKI episode without renal recovery had the highest incidence of progression to ESRD, followed by patients with de novo AKI and no renal recovery. Non‐recovery of renal function after AKI probably places the patient at a starting point on the kidney disease spectrum closer to ESRD, with each subsequent insult decreasing renal reserve and increasing the likelihood that the next renal injury will result in ESRD. In these patients, special attention must be directed at optimization of other cardiovascular risk factors, such as management of hypertension, hyperlipidaemia, diabetes, and salt and water balance.
In this study, CV Death Risk and ESRD Risk scores were developed and validated, and performed well to predict risk of CV mortality and progression to ESRD at the time of hospital discharge. This is the first study to validate clinical scores that can easily be calculated using routinely accessible data including pre‐existing kidney disease, AKI development during hospital stay and type of surgery to estimate the risk of CV mortality and progression to ESRD after discharge in elderly patients undergoing surgery. These tools can provide patients and their caregivers with accurate prognostic information and related education, augment shared decision‐making processes regarding resource utilization, and identify patients who will benefit from more structured nephrology referral and secondary cardiovascular prevention after discharge. Currently there is poor adherence with appropriate specialty referral after hospital stay, with as few as 12 per cent of AKI survivors receiving nephrology follow‐up32 and less than 30 per cent of eligible patients with cardiovascular disease referred for cardiac rehabilitation33.
Risk stratification is being used increasingly to estimate patients' risk of adverse events. The Revised Cardiac Risk Index34 estimates postoperative cardiac events in the general population; a more recent cardiovascular risk score for elderly surgical patients had moderate accuracy35. Similarly, risk scores for progression to ESRD in patients with CKD36, and specifically in the elderly37, have performed moderately well with C‐statistic values ranging from 0·82 to 0·84 on validation. Those risk scores were developed only for patients with CKD and do not consider stressor events such as surgery or AKI. The CV Death Risk and ESRD Risk scores outlined in the present study allow for determination of long‐term risk in elderly patients at the time of discharge, including consideration of in‐hospital events such as AKI that significantly impact the likelihood of long‐term mortality.
In the general elderly population, kidney disease is a known risk factor for cardiovascular risk and mortality6, 7, 8, 9, as well as progression to ESRD. Surgery is associated with increased risk for both perioperative AKI development38 and CKD progression39. With increasing life expectancy, more operations are being done in patients with advanced age. Simultaneously, the incidence of kidney disease in the elderly is increasing40, 41, and the association between postoperative kidney disease and death is well established42, 43, 44, 45, 46. The combination of cardiovascular and kidney disease emerges from shared pathophysiological mechanisms and may further increase the risk of mortality. Risk factors for both kidney and cardiovascular disease include hypertension, hyperlipidaemia, diabetes, alterations in mineral and water balance and in the renin–angiotensin–aldosterone axis, inflammation and endothelial dysfunction47, 48, 49, 50, 51. Elderly patients, especially those with existing CKD, are particularly vulnerable to CV mortality and progression of kidney disease after surgery. These patients require attentive perioperative management, including accurate preoperative risk stratification, AKI prevention in the preoperative and perioperative setting, and avoidance of further kidney damage, as well as maximizing renal recovery in those with established AKI.
Limitations of this study include the retrospective design, use of ICD‐9 codes to identify patients, and limited access to cause‐of‐death information for states other than Florida. Efforts to increase the internal validity of the competing risk models included using multivariable adjustments and evaluation of model discrimination on validation data sets. The ability to generalize the findings may be limited owing to using the characteristics of patients from a single centre; however, the study site is a large tertiary care centre receiving referrals from a large geographical area, and therefore has a diverse patient population. KDIGO consensus definitions for AKI severity categories were applied using serum creatinine changes only without urine output criteria due to low accuracy in the recording of urine output in the ward setting. The reference creatinine concentration was established using the minimum serum creatinine value available within 6 months before the index admission, including the value on the day of admission. CKD status was defined using a combination of eGFR on admission and ICD‐9‐CM codes. A recent systematic review52 showed high specificity for coded CKD co‐variables, with all studies reporting values of 0·90 or higher, whereas sensitivity was highly variable. Several traditional Framingham risk factors for cardiovascular disease53, such as smoking history, systolic BP, use of antihypertensive medication, and total and high‐density lipoprotein cholesterol levels, could not be included as co‐variables because these risk factors were not available in the administrative database. However, information on cardiovascular co‐morbidity regarding previous congestive heart failure, myocardial infarction, cerebrovascular disease, peripheral vascular disease, and diabetes mellitus without and with complications was available and included.
This study has demonstrated that elderly patients with kidney disease of any type undergoing major surgery have higher risk of progression to ESRD and CV mortality. This could partly be attributable to the lack of appropriate postoperative preventive strategies and nephrology follow‐up in elderly patients. The two clinical risk scores, CV Death Risk and ESRD Risk, can be calculated at hospital discharge from readily available clinical data to identify patients with kidney disease who have an increased risk of CV mortality and progression to ESRD, with good accuracy. These simplified risk scores can help clinicians to establish a more appropriate postoperative therapeutic and preventive plan to reduce these complications, and patients would benefit from accurate prognostic information and early referral to nephrology after discharge to address both progression of kidney disease as well as treatment of traditional and non‐traditional cardiovascular risk factors54.
These risk prediction models could potentially be improved by enriching the models with more granular clinical variables, such as CKD and AKI severity, potential interaction between the variables, and external model validation before being introduced as a standard clinical tool. To improve outcomes in this population, bench and bedside approaches must further elucidate pathophysiological mechanisms, emphasize appropriate perioperative management of cardiovascular and renal co‐morbidities, and ensure adequate follow‐up for high‐risk patients.
Supporting information
Appendix S1. Supporting Information
Acknowledgements
N.L., H.H. and A.D. contributed equally to this manuscript.
This work was supported in part by a National Institutes of Health (NIH)/National Center for Advancing Translational Sciences Clinical and Translational Sciences award to the University of Florida (UL1 TR000064). The content is solely the responsibility of the authors and does not necessarily represent the official views of the NIH. The funders had no role in study design, data collection and analysis, decision to publish, or preparation of the manuscript. A.B., A.D. and T.O.‐B. had full access to all study data, and take responsibility for the integrity of the data and the accuracy of the data analysis.
A.B., T.O.‐B. and P.R. were supported by the National Institute of General Medical Sciences (R01 GM110240). A.B., T.O.‐B. and P.E. were supported by a Sepsis and Critical Illness Research Centre award (P50 GM‐111152) from the National Institute of General Medical Sciences. P.R. was supported by CAREER award number 1750192 from the National Science Foundation, Division of Information and Intelligent Systems. T.O.‐B. has received a grant from the National Center for Advancing Translational Sciences Clinical and Translational Sciences (UL1TR001427), and a grant from the Gatorade Trust, Department of Medicine, University of Florida (127900). T.J.L. was supported by a postgraduate training grant (T32 GM‐008721) in burns, trauma and perioperative injury from the National Institute of General Medical Sciences.
Disclosure: The authors declare no conflict of interest.
Funding information
National Center for Advancing Translational Sciences of the National Institutes of Health under University of Florida Clinical and Translational Science, UL1TR000064 and UL1TR001427
National Institute of General Medical Sciences, R01 GM110240, P50 GM‐111152, T32 GM‐008721
National Science Foundation, Division of Information and Intelligent Systems, 1750192
Gatorade Trust, Department of Medicine, University of Florida, 127900
Presented in part to the American Society of Nephrology Kidney Week 2016, Chicago, Illinois, USA, November 2016
References
- 1. Huber M, Ozrazgat‐Baslanti T, Thottakkara P, Scali S, Bihorac A, Hobson C. Cardiovascular‐specific mortality and kidney disease in patients undergoing vascular surgery. JAMA Surg 2016; 151: 441–450. [DOI] [PMC free article] [PubMed] [Google Scholar]
- 2. Feest TG, Round A, Hamad S. Incidence of severe acute renal failure in adults: results of a community based study. BMJ 1993; 306: 481–483. [DOI] [PMC free article] [PubMed] [Google Scholar]
- 3. Jerkić M, Vojvodić S, López‐Novoa JM. The mechanism of increased renal susceptibility to toxic substances in the elderly. Part I. The role of increased vasoconstriction. Int Urol Nephrol 2001; 32: 539–547. [DOI] [PubMed] [Google Scholar]
- 4. Gourtsoyiannis N, Prassopoulos P, Cavouras D, Pantelidis N. The thickness of the renal parenchyma decreases with age: a CT study of 360 patients. AJR Am J Roentgenol 1990; 155: 541–544. [DOI] [PubMed] [Google Scholar]
- 5. Ishani A, Xue JL, Himmelfarb J, Eggers PW, Kimmel PL, Molitoris BA et al Acute kidney injury increases risk of ESRD among elderly. J Am Soc Nephrol 2009; 20: 223–228. [DOI] [PMC free article] [PubMed] [Google Scholar]
- 6. Gansevoort RT, Correa‐Rotter R, Hemmelgarn BR, Jafar TH, Heerspink HJ, Mann JF et al Chronic kidney disease and cardiovascular risk: epidemiology, mechanisms, and prevention. Lancet 2013; 382: 339–352. [DOI] [PubMed] [Google Scholar]
- 7. Chronic Kidney Disease Prognosis Consortium , Matsushita K, van der Velde M, Astor BC, Woodward M, Levey AS et al Association of estimated glomerular filtration rate and albuminuria with all‐cause and cardiovascular mortality in general population cohorts: a collaborative meta‐analysis. Lancet 2010; 375: 2073–2081. [DOI] [PMC free article] [PubMed] [Google Scholar]
- 8. Chawla LS, Amdur RL, Shaw AD, Faselis C, Palant CE, Kimmel PL. Association between AKI and long‐term renal and cardiovascular outcomes in United States veterans. Clin J Am Soc Nephrol 2014; 9: 448–456. [DOI] [PMC free article] [PubMed] [Google Scholar]
- 9. Chawla LS, Eggers PW, Star RA, Kimmel PL. Acute kidney injury and chronic kidney disease as interconnected syndromes. N Engl J Med 2014; 371: 58–66. [DOI] [PMC free article] [PubMed] [Google Scholar]
- 10. Bihorac A, Ozrazgat‐Baslanti T, Ebadi A, Motaei A, Madkour M, Pardalos PM et al MySurgeryRisk: development and validation of a machine‐learning risk algorithm for major complications and death after surgery. Ann Surg 2019; 269: 652–662. [DOI] [PMC free article] [PubMed] [Google Scholar]
- 11. Gentric A, Cledes J. Immediate and long‐term prognosis in acute renal failure in the elderly. Nephrol Dial Transplant 1991; 6: 86–90. [DOI] [PubMed] [Google Scholar]
- 12. Ozrazgat‐Baslanti T, Thottakkara P, Huber M, Berg K, Gravenstein N, Tighe P et al Acute and chronic kidney disease and cardiovascular mortality after major surgery. Ann Surg 2016; 264: 987–996. [DOI] [PMC free article] [PubMed] [Google Scholar]
- 13. Murray CJ, Atkinson C, Bhalla K, Birbeck G, Burstein R, Chou D et al; US Burden of Disease Collaborators. The state of US health, 1990–2010: burden of diseases, injuries, and risk factors. JAMA 2013; 310: 591–608. [DOI] [PMC free article] [PubMed] [Google Scholar]
- 14. Hoyert DL, Deaths Xu J.: preliminary data for 2011. Natl Vital Stat Rep 2012; 61: 1–51. [PubMed] [Google Scholar]
- 15. United States Renal Data System . 2014 Researcher's Guide to the USRDS Database. https://www.usrds.org/2014/rg/USRDS_Researchers_Guide-14.pdf [accessed 25 December 2015].
- 16. Levey AS, Stevens LA, Schmid CH, Zhang YL, Castro AF 3rd, Feldman HI et al; CKD‐EPI (Chronic Kidney Disease Epidemiology Collaboration). A new equation to estimate glomerular filtration rate. Ann Intern Med 2009; 150: 604–612. [DOI] [PMC free article] [PubMed] [Google Scholar]
- 17. Siew ED, Ikizler TA, Matheny ME, Shi Y, Schildcrout JS, Danciu I et al Estimating baseline kidney function in hospitalized patients with impaired kidney function. Clin J Am Soc Nephrol 2012; 7: 712–719. [DOI] [PMC free article] [PubMed] [Google Scholar]
- 18. Levey AS, Bosch JP, Lewis JB, Greene T, Rogers N, Roth D. A more accurate method to estimate glomerular filtration rate from serum creatinine: a new prediction equation. Modification of Diet in Renal Disease Study Group. Ann Intern Med 1999; 130: 461–470. [DOI] [PubMed] [Google Scholar]
- 19. Kellum JA, Lameire N, Aspelin P, Barsoum RS, Burdmann EA et al Kidney disease: improving global outcomes (KDIGO) acute kidney injury work group. KDIGO clinical practice guideline for acute kidney injury. Kidney Int Suppl 2012; 2: 1–138. [Google Scholar]
- 20. Stevens PE, Levin A; Kidney Disease: Improving Global Outcomes Chronic Kidney Disease Guideline Development Work Group Members. Evaluation and management of chronic kidney disease: synopsis of the kidney disease: improving global outcomes 2012 clinical practice guideline. Ann Intern Med 2013; 158: 825–830. [DOI] [PubMed] [Google Scholar]
- 21. Kidney Disease : Improving Global Outcomes (KDIGO) CKD Work Group. KDIGO 2012 clinical practice guideline for the evaluation and management of chronic kidney disease. Kidney Int Suppl 2013; 3: 1–150. [Google Scholar]
- 22. Deyo RA, Cherkin DC, Ciol MA. Adapting a clinical comorbidity index for use with ICD‐9‐CM administrative databases. J Clin Epidemiol 1992; 45: 613–619. [DOI] [PubMed] [Google Scholar]
- 23. Hobson C, Ozrazgat‐Baslanti T, Kuxhausen A, Thottakkara P, Efron PA, Moore FA et al Cost and mortality associated with postoperative acute kidney injury. Ann Surg 2015; 261: 1207–1214. [DOI] [PMC free article] [PubMed] [Google Scholar]
- 24. Shavit L, Hitti S, Silberman S, Tauber R, Merin O, Lifschitz M et al Preoperative hemoglobin and outcomes in patients with CKD undergoing cardiac surgery. Clin J Am Soc Nephrol 2014; 9: 1536–1544. [DOI] [PMC free article] [PubMed] [Google Scholar]
- 25. Fine JP, Gray RJ. A proportional hazards model for the subdistribution of a competing risk. J Am Stat Assoc 1999; 94: 496–509. [Google Scholar]
- 26. Scrucca L, Santucci A, Aversa F. Regression modeling of competing risk using R: an in depth guide for clinicians. Bone Marrow Transplant 2010; 45: 1388–1395. [DOI] [PubMed] [Google Scholar]
- 27. Dignam JJ, Zhang Q, Kocherginsky M. The use and interpretation of competing risks regression models. Clin Cancer Res 2012; 18: 2301–2308. [DOI] [PMC free article] [PubMed] [Google Scholar]
- 28. Gray RJ. Cmprsk: Subdistribution Analysis of Competing Risks R package version 2.2‐2; 2011. http://cran.r-project.org/package=cmprsk [accessed 24 March 2015].
- 29. Zhang X, Zhang MJ. SAS macros for estimation of direct adjusted cumulative incidence curves under proportional subdistribution hazards models. Comput Methods Programs Biomed 2011; 101: 87–93. [DOI] [PMC free article] [PubMed] [Google Scholar]
- 30. Wolbers M, Blanche P, Koller MT, Witteman JC, Gerds TA. Concordance for prognostic models with competing risks. Biostatistics 2014; 15: 526–539. [DOI] [PMC free article] [PubMed] [Google Scholar]
- 31. Austin PC, Lee DS, D'Agostino RB, Fine JP. Developing points‐based risk‐scoring systems in the presence of competing risks. Stat Med 2018; 37: 1405. [DOI] [PMC free article] [PubMed] [Google Scholar]
- 32. Siew ED, Peterson JF, Eden SK, Hung AM, Speroff T, Ikizler TA et al Outpatient nephrology referral rates after acute kidney injury. J Am Soc Nephrol 2012; 23: 305–312. [DOI] [PMC free article] [PubMed] [Google Scholar]
- 33. Thomas RJ, King M, Lui K, Oldridge N, Piña IL, Spertus J; American Association of Cardiovascular and Pulmonary Rehabilitation/American College of Cardiology/American Heart Association Cardiac Rehabilitation/Secondary Prevention Performance Measures Writing Committee. AACVPR/ACC/AHA 2007 performance measures on cardiac rehabilitation for referral to and delivery of cardiac rehabilitation/secondary prevention services. Circulation 2007; 116: 1611–1642. [DOI] [PubMed] [Google Scholar]
- 34. Lee TH, Marcantonio ER, Mangione CM, Thomas EJ, Polanczyk CA, Cook EF et al Derivation and prospective validation of a simple index for prediction of cardiac risk of major noncardiac surgery. Circulation 1999; 100: 1043–1049. [DOI] [PubMed] [Google Scholar]
- 35. Alrezk R, Jackson N, Al Rezk M, Elashoff R, Weintraub N, Elashoff D et al Derivation and validation of a geriatric‐sensitive perioperative cardiac risk index. J Am Heart Assoc 2017; 6: e006648. [DOI] [PMC free article] [PubMed] [Google Scholar]
- 36. Tangri N, Stevens LA, Griffith J, Tighiouart H, Djurdjev O, Naimark D et al A predictive model for progression of chronic kidney disease to kidney failure. JAMA 2011; 305: 1553–1559. [DOI] [PubMed] [Google Scholar]
- 37. Drawz PE, Goswami P, Azem R, Babineau DC, Rahman M. A simple tool to predict end‐stage renal disease within 1 year in elderly adults with advanced chronic kidney disease. J Am Geriatr Soc 2013; 61: 762–768. [DOI] [PMC free article] [PubMed] [Google Scholar]
- 38. Thakar CV. Perioperative acute kidney injury. Adv Chronic Kidney Dis 2013; 20: 67–75. [DOI] [PubMed] [Google Scholar]
- 39. Palevsky PM. Perioperative management of patients with chronic kidney disease or ESRD. Best Pract Res Clin Anaesthesiol 2004; 18: 129–144. [DOI] [PubMed] [Google Scholar]
- 40. Rosner M, Abdel‐Rahman E, Williams ME; ASN Advisory Group on Geriatric Nephrology. Geriatric nephrology: responding to a growing challenge. Clin J Am Soc Nephrol 2010; 5: 936–942. [DOI] [PubMed] [Google Scholar]
- 41. Chronopoulos A, Cruz DN, Ronco C. Hospital‐acquired acute kidney injury in the elderly. Nat Rev Nephrol 2010; 6: 141–149. [DOI] [PubMed] [Google Scholar]
- 42. Loef BG, Epema AH, Smilde TD, Henning RH, Ebels T, Navis G et al Immediate postoperative renal function deterioration in cardiac surgical patients predicts in‐hospital mortality and long‐term survival. J Am Soc Nephrol 2005; 16: 195–200. [DOI] [PubMed] [Google Scholar]
- 43. Lok CE, Austin PC, Wang H, Tu JV. Impact of renal insufficiency on short‐ and long‐term outcomes after cardiac surgery. Am Heart J 2004; 148: 430–438. [DOI] [PubMed] [Google Scholar]
- 44. Leacche M, Rawn JD, Mihaljevic T, Lin J, Karavas AN, Paul S et al Outcomes in patients with normal serum creatinine and with artificial renal support for acute renal failure developing after coronary artery bypass grafting. Am J Cardiol 2004; 93: 353–356. [DOI] [PubMed] [Google Scholar]
- 45. Bagur R, Webb JG, Nietlispach F, Dumont E, De Larochellière R, Doyle D et al Acute kidney injury following transcatheter aortic valve implantation: predictive factors, prognostic value, and comparison with surgical aortic valve replacement. Eur Heart J 2010; 31: 865–874. [DOI] [PMC free article] [PubMed] [Google Scholar]
- 46. O'Connor ME, Hewson RW, Kirwan CJ, Ackland GL, Pearse RM, Prowle JR. Acute kidney injury and mortality 1 year after major non‐cardiac surgery. Br J Surg 2017; 104: 868–876. [DOI] [PubMed] [Google Scholar]
- 47. Himmelfarb J, Le P, Klenzak J, Freedman S, McMenamin ME, Ikizler TA; PICARD Group. Impaired monocyte cytokine production in critically ill patients with acute renal failure. Kidney Int 2004; 66: 2354–2360. [DOI] [PubMed] [Google Scholar]
- 48. Leaf DE, Waikar SS, Wolf M, Cremers S, Bhan I, Stern L. Dysregulated mineral metabolism in patients with acute kidney injury and risk of adverse outcomes. Clin Endocrinol (Oxf) 2013; 79: 491–498. [DOI] [PMC free article] [PubMed] [Google Scholar]
- 49. Nogueira J, Weir M. The unique character of cardiovascular disease in chronic kidney disease and its implications for treatment with lipid‐lowering drugs. Clin J Am Soc Nephrol 2007; 2: 766–785. [DOI] [PubMed] [Google Scholar]
- 50. Simmons EM, Himmelfarb J, Sezer MT, Chertow GM, Mehta RL, Paganini EP et al; PICARD Study Group. Plasma cytokine levels predict mortality in patients with acute renal failure. Kidney Int 2004; 65: 1357–1365. [DOI] [PubMed] [Google Scholar]
- 51. Tomey MI, Winston JA. Cardiovascular pathophysiology in chronic kidney disease: opportunities to transition from disease to health. Ann Glob Health 2014; 80: 69–76. [DOI] [PubMed] [Google Scholar]
- 52. Grams ME, Plantinga LC, Hedgeman E, Saran R, Myers GL, Williams DE et al; CDC CKD Surveillance Team. Validation of CKD and related conditions in existing data sets: a systematic review. Am J Kidney Dis 2011; 57: 44–54. [DOI] [PMC free article] [PubMed] [Google Scholar]
- 53. D'Agostino RB Sr, Vasan RS, Pencina MJ, Wolf PA, Cobain M, Massaro JM et al General cardiovascular risk profile for use in primary care: the Framingham Heart Study. Circulation 2008; 117: 743–753. [DOI] [PubMed] [Google Scholar]
- 54. Costa e Silva VT, Liaño F, Muriel A, Díez R, de Castro I, Yu L. Nephrology referral and outcomes in critically ill acute kidney injury patients. PLoS One 2013; 8: e70482. [DOI] [PMC free article] [PubMed] [Google Scholar]
Associated Data
This section collects any data citations, data availability statements, or supplementary materials included in this article.
Supplementary Materials
Appendix S1. Supporting Information