Abstract
Background
Trends in noninvasive diagnostic imaging (NDI) utilization rates have predominantly been reported in Medicare enrollees. To the authors’ knowledge, there has been no prior direct comparison of utilization rates between Medicare and commercially insured patients.
Purpose
To analyze trends in NDI utilization rates by modality, comparing Medicare fee-for-service and commercially insured enrollees.
Materials and Methods
This study was a retrospective trend analysis of NDI performed between 2003 and 2016 as reported in claims databases for all adults enrolled in fee-for-service Medicare and for roughly 9 million commercially insured patients per year. The commercially insured patients were divided into two populations: those aged 18–44 years and those aged 45–64 years. The same procedure code definitions for NDI were applied to both Medicare and commercial claims, rates were calculated per 1000 enrollees, and trends were reported over time in aggregate followed by modality (CT, MRI, nuclear imaging, echocardiography, US, radiography). Join-point regression was used to model annual rates and to identify statistically significant (P < .05) changes in trends.
Results
In almost all instances, Medicare enrollees had the highest utilization rate for each modality, followed by commercially insured patients aged 45–64 years, then aged 18–44 years. All three populations showed utilization growth through the mid to late 2000s (images per 1000 enrollees per year for Medicare: 91 [95% confidence interval {CI}: 34, 148]; commercially insured patients aged 45–64 years: 158 [95% CI: 130, 186]; aged 18–44 years: 83 [95% CI: 69, 97]), followed by significant declining trends from the late 2000s through early 2010s (images per 1000 enrollees per year for Medicare: −301 [95% CI: −510, −92]; commercially insured patients aged 45–64 years: −54 [95% CI: −69, −39]; aged 18–44 years: −26 [95% CI: −31, −21]) coinciding with code-bundling events instituted by Medicare (CT, nuclear imaging, echocardiography). There were significant trend changes in modalities without code bundling (MRI, radiography, US), although flat trends mostly were exhibited. After the early 2010s, there were significant trend changes largely showing flat utilization growth. The notable exception was a significant trend change to renewed growth of CT imaging among commercially insured patients aged 45–64 years and Medicare enrollees after 2012, although at half the prior rate (images per 1000 enrollees per year for Medicare: 17 [95% CI: 6, 28]; commercially insured patients aged 45–64 years: 11 [95% CI: 2, 20]).
Conclusion
Noninvasive diagnostic imaging utilization trends among commercially insured individuals are similar to those in Medicare enrollees, although at lower rates. Earlier rapid growth has ceased and, except for CT, utilization has stabilized since the early 2010s.
© RSNA, 2019
See also the editorial by Hentel and Wolk in this issue.
Summary
With regard to nationwide trends in imaging utilization for Medicare enrollees and commercially insured adults, growth occurred through the late 2000s followed by stabilized or declining trends after 2010, even for modalities without code bundling, with notable exceptions.
Key Results
■ For both Medicare and commercially insured adults, a significant (P < .05) reversal of growth was found in noninvasive diagnostic imaging (NDI) by the late 2000s (CT, nuclear imaging, echocardiography) and stabilization of growth for modalities in which code bundling did not occur (MRI, US, radiography).
■ After 2010, overall flattening of growth was found in NDI utilization (MRI, nuclear imaging, US, echocardiography, radiography).
■ However, significant trends were found in increasing CT imaging for commercially insured patients aged 45–64 years and Medicare enrollees of all ages in recent years (2012–2016).
Introduction
Trends in imaging utilization are of great interest to radiologists (1–12) to assess the stability and growth of their practices. Policy makers have also been interested, particularly since publication of a study by Iglehart (13) that showed between 2000 and 2007, diagnostic imaging was the most rapidly growing of all physician services in the Medicare population.
Because of data availability and reliability, most utilization reporting has relied on Medicare data sets. Although the commercially insured comprise a much larger population than do Medicare recipients, only a few investigators have attempted to ascertain imaging utilization trends in various commercially insured populations (1–3,6,7,10). Furthermore, the methodologies used to categorize imaging in those studies differed considerably. As a result, there is no reliable comparison of diagnostic imaging utilization rates between the Medicare population and the commercially insured.
Our main goal was to report the utilization rates of noninvasive diagnostic imaging (NDI) in a commercially insured population and to compare them with rates in Medicare fee-for-service enrollees by using the same carefully defined aggregation of imaging codes. We hypothesized declining trends after the late 2000s in overall imaging utilization across modalities, with Medicare enrollees having the highest overall rate, followed by commercially insured individuals aged 45–64 years, and commercially insured individuals aged 18–44 years having the lowest utilization rate.
Materials and Methods
Study Design
We designed a retrospective observational study of annual time series and reported annual utilization rates of discretionary NDI. We defined “discretionary” as imaging tests ordered by a referring physician at his or her discretion as part of the work-up of a patient’s clinical condition. In contrast, interventional radiologic procedures are typically not discretionary; they are mandated by the patient’s clinical condition and therefore were excluded from our analysis. We reported rates separately for three distinct groups: Medicare fee-for-service enrollees of all ages, commercially insured adults aged 18–44 years, and commercially insured adults aged 45–64 years. We reported total imaging procedure rates for the three groups, then rates for specific imaging modalities (CT, MRI, nuclear imaging including PET, echocardiography, noncardiac US, and radiography). Medicare-only trends from 2008–2014 were reported previously (6). This article compares a longer length of Medicare data versus commercial claims and also fits trends and identifies statistically significant changes in trends. The Medicare Physician-Supplier Procedure Summary Master Files are aggregated public-use files that contain no patient or physician identifiers and are therefore exempt from institutional review board review. The use of the deidentified data sets (Optum Clinformatics Data Mart Database; Optum, Eden Prairie, Minn) for this study was approved by the University of Texas Southwestern Medical Center institutional review board and the Harvard Pilgrim Health Care Institute institutional review board.
Study Data
Medicare claims were obtained from the nationwide Medicare Part B Physician-Supplier Procedure Summary for 2003–2016. The files cover all Medicare fee-for-service enrollees (35.8 million in 2003; 39.2 million in 2016) and thus represent a population rate. Commercial claims were obtained from the Optum database, an administrative and medical claims data set. The Optum data were available for 2003–2016. Optum data are derived from a large national health insurer (10.5 million enrollees in 2003; 9.3 million in 2016). Although this database is large, it is not specifically considered to be nationally representative.
Imaging Definitions
In both sets of claims, procedures were coded according to Current Procedural Terminology, Fourth Edition. The included codes were for all NDI examinations in the 70000 series of the Current Procedural Terminology, Fourth Edition manual, and those in the 90000 series that covered echocardiography and vascular US. Also included were those Level III codes in the Healthcare Common Procedure Coding System that denoted NDI. We included MR and CT angiography codes. We included patients in all places of service: inpatients, patients in emergency departments, and outpatients seen in private offices and hospital outpatient facilities.
We excluded a number of nuclear medicine examinations that are laboratory tests; they involve use of radionuclide techniques but are not diagnostic imaging examinations (eg, thyroid uptake, red cell survival, urea breath test, vitamin B12 absorption). We excluded adjunctive codes to procedures, such as computer-aided detection for mammography, consultations regarding outside studies, three-dimensional rendering, and image postprocessing. We also excluded “unlisted” fluoroscopic, radiographic, CT, and MRI procedures. Finally, to avoid double counting the same examination when there were two separate partial claims, we tabulated only the global and professional components of claims, excluding the technical component. Codes were grouped according to modality: CT, MRI, echocardiography, noncardiac US, nuclear medicine, bone densitometry, and radiography. The latter included mammography and fluoroscopy. Given the predominant use of bone densitometry in adults older than 65 years, we excluded this category from our analysis.
Code Bundling
In 2009–2011, Medicare (with commercial insurers following suit) instituted three modality-specific code bundles, consolidating multiple codes that often were added to one larger procedure. In 2009, Medicare bundled spectral Doppler and color Doppler flow imaging studies together with the primary echocardiography codes, consolidating three separate claims into one. In 2010, Medicare bundled radionuclide myocardial perfusion imaging together with left ventricular wall motion and left ventricular ejection fraction studies, turning three separate codes into one. In 2011, Medicare bundled the codes for CT of the abdomen and CT of the pelvis into single codes that were based on the use of contrast material (ie, a single code for the combined examination without use of contrast material, another code for the contrast material–enhanced study, and another code for the procedure without contrast material followed by use of contrast material).
Statistical Analysis
We tabulated imaging codes, then generated rates per 1000 enrollees. Although we had large population-level counts, we sought to generate standard errors for analysis. After generating annual enrollment denominator counts, we took 10 random 10% samples from each of the three groups, tabulated a numerator count of images from that sample, and then used the 10 samples to generate mean rates and standard errors. We used these to calculate 95% confidence intervals for the annual rates, but we did not report them because the standard errors were too small to be reportable with our denominator of per 1000 enrollees (eg, standard error of 0.0012 per 1000 enrollees for an annual rate of 868 per 1000 enrollees), reflecting our population-level sample sizes. Differences between rates across the three groups were all statistically significant.
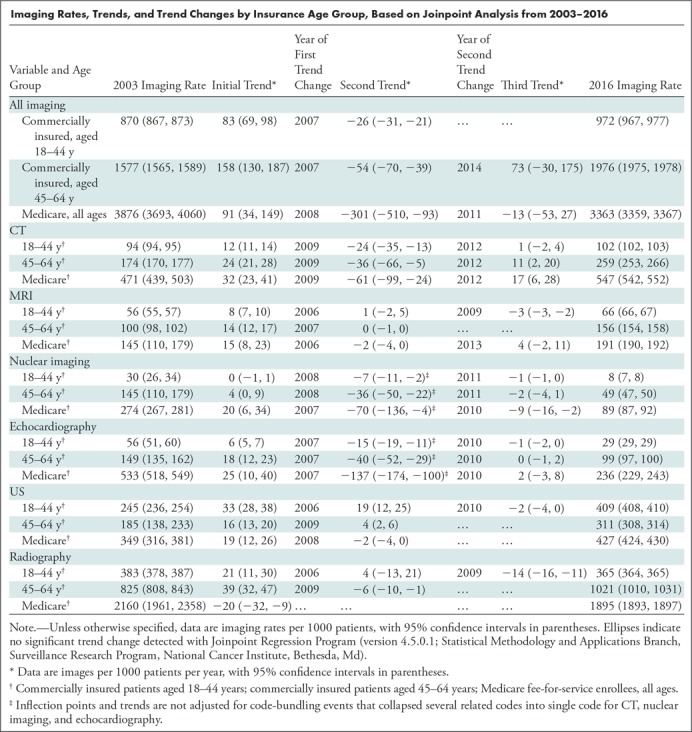
We generated fitted linear regression trends and annual percentage changes (reported here as rates of images per 1000 enrollees per year) to establish trends in growth by using statistical software (Joinpoint Regression Program, version 4.5.0.1; Statistical Methodology and Applications Branch, Surveillance Research Program, National Cancer Institute, Bethesda, Md). Joinpoint generates intercept and annual percent change, then uses the grid-search method (14) to fit a regression with unknown join points. It conducts permutation tests by using Monte Carlo methods (15) to establish statistically significant (P < .05) trends and join points (16), or inflection points or changes in trend. Initial rates, initial growth rates, each significant change in trend and subsequent growth rate, and year of trend change are shown in the Table.
Imaging Rates, Trends, and Trend Changes by Insurance Age Group, Based on Joinpoint Analysis from 2003–2016
Data analysis was performed with software (SAS, version 9.4 for Windows; SAS Institute, Cary, NC; and Joinpoint).
Results
Among the commercially insured adults aged 18–44 years, there were 5.3 million enrollees (51.4% female) in 2003 and 4.9 million enrollees in 2016 (48.8% female). Commercially insured adults aged 45–64 years numbered 3.3 million in 2003 (51.1% female) and 4.0 million in 2016 (50.4% female). Among Medicare Part B enrollees of all ages (35.8 million in 2003, 39.2 million in 2016), 54.0% were female in 2013.
Overall Imaging Trends
For total NDI and each imaging modality, the Medicare group almost always had the highest utilization rates. Commercially insured 45- to 64-year-olds had the next highest utilization rates, and commercially insured 18- to 44-year-olds had the lowest. The only exception was for noncardiac US, for which the 18- to 44-year-olds had consistently higher utilization rates than did the 45- to 64-year-olds.
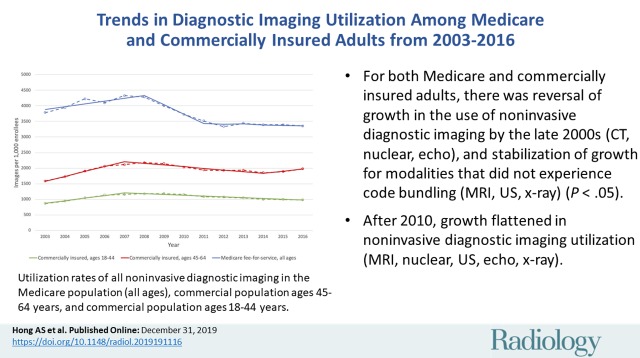
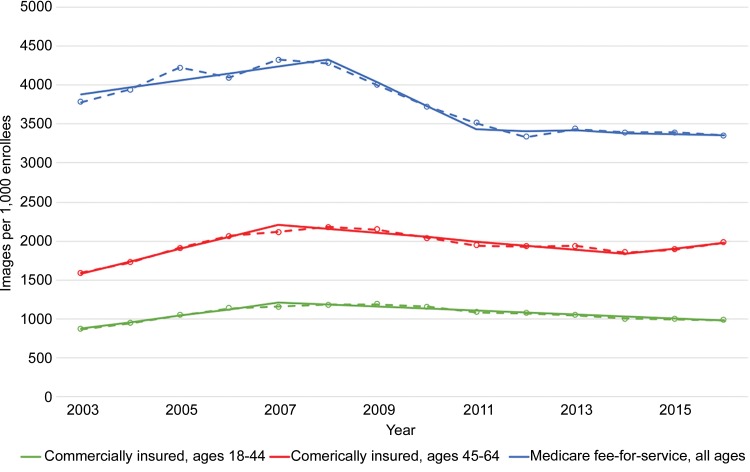
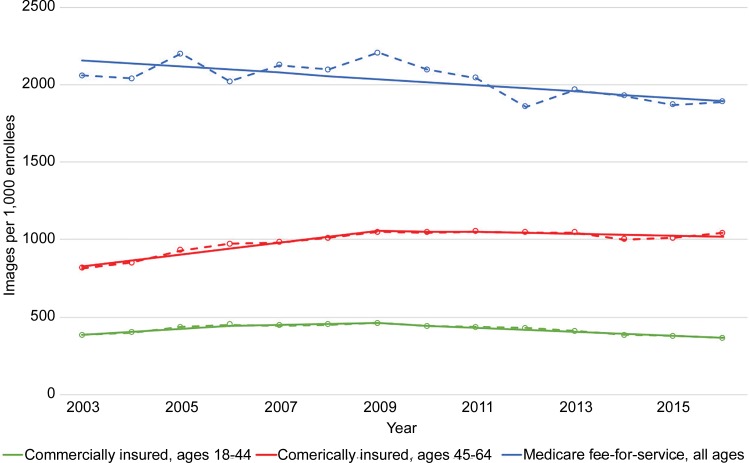
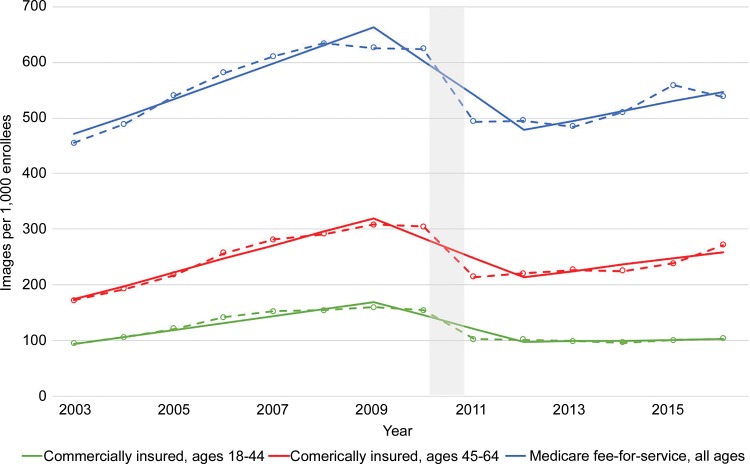
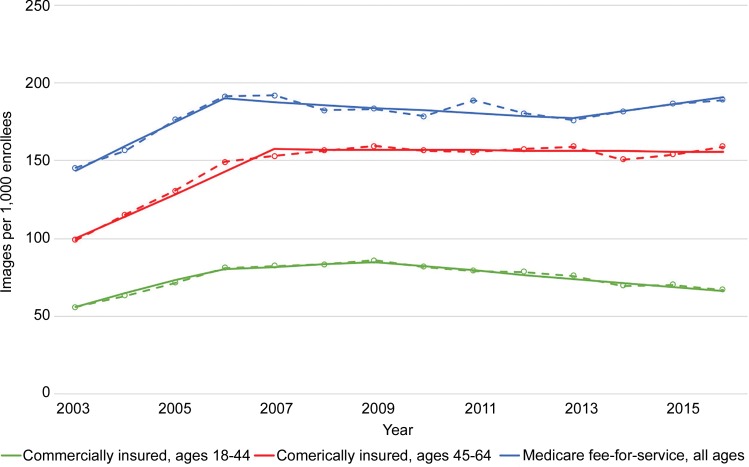
We illustrate all utilization rate trends in Figures 1–7 for each of the three groups; imaging rates, statistically significant trends, and trend changes are summarized in the following sections, with numeric details and join-point analyses shown in the Table. Reported imaging rates are raw rates, not the fitted rates.
Figure 1:
Graph shows utilization rates of all noninvasive diagnostic imaging by insurance age group, based on analysis with Joinpoint Regression Program (version 4.5.0.1; Statistical Methodology and Applications Branch, Surveillance Research Program, National Cancer Institute, Bethesda, Md). Solid lines are modeled trends; dotted lines are observed rates.
Figure 7:
Graph shows utilization rates of all radiographic examinations by insurance age group, based on analysis with Joinpoint Regression Program (version 4.5.0.1; Statistical Methodology and Applications Branch, Surveillance Research Program, National Cancer Institute, Bethesda, Md). Rates include plain radiography, mammography, and diagnostic fluoroscopy. Solid lines are modeled trends; dotted lines are observed rates.
Total NDI utilization rates are shown in Figure 1. The group of commercially insured 18- to 44-year-olds started with an NDI utilization rate of 868 per 1000 enrollees in 2003; the rate peaked in 2009 at 1188, then declined to 982 in 2016. Commercially insured 45- to 64-year-olds started 2003 with an NDI rate of 1586; the rate peaked in 2008 at 2175, declined through 2014 to 1849, then increased through 2016 to 1979. The Medicare NDI rate started at 3873 in 2003, increased to a high of 4422 in 2008, and then declined to 3410 by 2016. We noted increasing trends that significantly reversed to declining trends after year 2007–2008 for the three groups; afterward, there were flat trends in utilization for Medicare enrollees and commercially insured 45- to 64-year-olds.
Trends in Individual Imaging Modalities
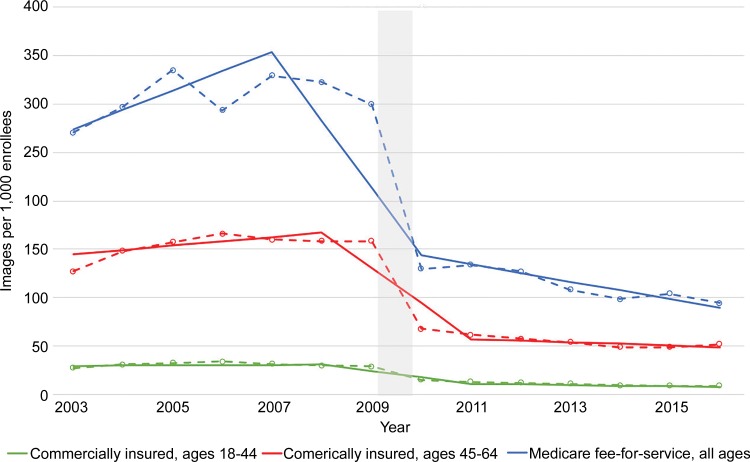
Figure 2 shows CT imaging trends. We noted significant reversals of upward trends after 2009 in all three groups, through CT code bundling in 2011. Thereafter, significant growth trends resumed in the Medicare enrollees and the commercially insured 45- to 64-year-olds, at roughly half the rate of growth trends before 2009, but use stabilized in the commercially insured 18- to 44-year-olds.
Figure 2:
Graph shows utilization rates of CT by insurance age group, based on analysis with Joinpoint Regression Program (version 4.5.0.1; Statistical Methodology and Applications Branch, Surveillance Research Program, National Cancer Institute, Bethesda, Md). Code bundling occurred in 2010–2011, denoted by gray bar. Solid lines are modeled trends; dotted lines are observed rates.
Figure 3 shows MRI trends. Steady growth trends in all three groups were seen until 2006–2007, after which significant trend changes led to flat growth. In the group of patients aged 18–44 years, there was a slightly declining trend (a decrease of three images per 1000 enrollees per year) after 2009.
Figure 3:
Graph shows utilization rates of MRI by insurance age group, based on analysis with Joinpoint Regression Program (version 4.5.0.1; Statistical Methodology and Applications Branch, Surveillance Research Program, National Cancer Institute, Bethesda, Md). Solid lines are modeled trends; dotted lines are observed rates.
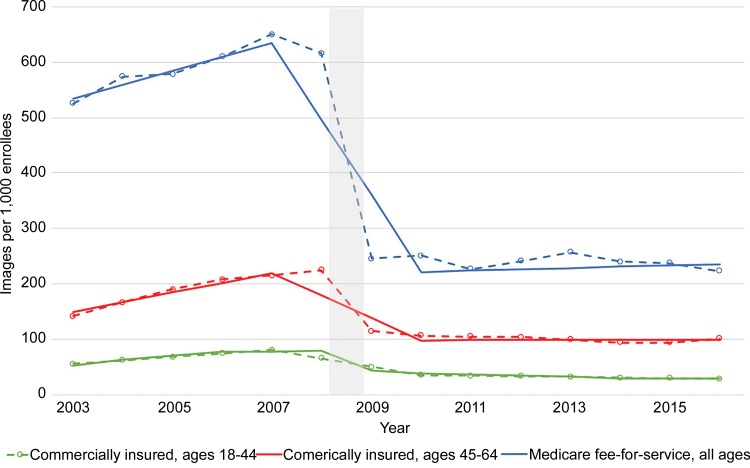
Figure 4 shows nuclear imaging trends including PET and myocardial perfusion imaging. All three groups showed modest to no significant growth through 2006, then gradual decline through 2009. After the large artifactual drop that followed code bundling in 2010, there were nonsignificant declining trends in all three groups.
Figure 4:
Graph shows utilization rates of nuclear imaging (including PET) by insurance age group, based on analysis with Joinpoint Regression Program (version 4.5.0.1; Statistical Methodology and Applications Branch, Surveillance Research Program, National Cancer Institute, Bethesda, Md). Code bundling occurred in 2009–2010, denoted by gray bar. Solid lines are modeled trends; dotted lines are observed rates.
Figure 5 shows echocardiography imaging trends. All three groups exhibited similar trends, with progressive rapid growth through 2008 (Medicare: 25 images per 1000 enrollees per year; patients aged 45–64 years: 18 per 1000 per year; patients aged 18–44 years: six per 1000 per year). Following significant trend reversals and code bundling in 2009, there were modest to no significant declining trends through 2016.
Figure 5:
Graph shows utilization rates of echocardiography by insurance age group, based on analysis with Joinpoint Regression Program (version 4.5.0.1; Statistical Methodology and Applications Branch, Surveillance Research Program, National Cancer Institute, Bethesda, Md). Code bundling occurred in 2008–2009, denoted by gray bar. Solid lines are modeled trends; dotted lines are observed rates.
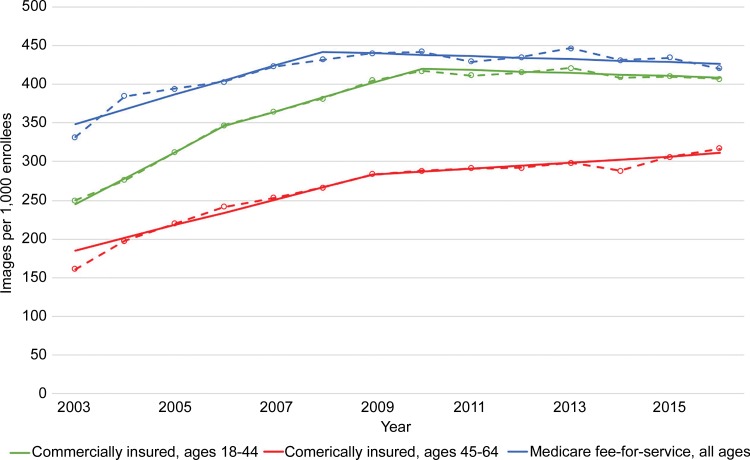
Figure 6 shows noncardiac US imaging trends. The group of 18- to 44-year-olds showed strongest growth through 2010 (initially a significant trend of 33 images per 1000 per year, then 19), with a change to a flat trend thereafter. Both the 45- to 64-year-olds and the Medicare enrollees began with similar growth rate trends through 2008 and 2009 (16 and 19 images per 1000 per year, respectively). During the subsequent years, the two groups had significant changes to flat trends.
Figure 6:
Graph shows utilization rates of noncardiac US by insurance age group, based on analysis with Joinpoint Regression Program (version 4.5.0.1; Statistical Methodology and Applications Branch, Surveillance Research Program, National Cancer Institute, Bethesda, Md). Solid lines are modeled trends; dotted lines are observed rates.
Figure 7 shows radiographic imaging trends. The Medicare group had the highest initial imaging rate (2059 examinations per 1000 enrollees vs 816 and 385 for patients aged 45–64 years and 18–44 years, respectively) in 2003, with a steadily moderately declining trend (decrease of 20 images per 1000 enrollees per year) without any significant trend through 2016. Patients aged 45–64 years had the highest initial growth (39 per 1000 per year), followed by a significant change to a nonsignificant declining trend after 2009. Patients aged 18–44 years had moderate growth (21 per 1000 per year) with a change to nonsignificant growth after 2006, and a final change to a steadily declining trend after 2009.
Discussion
We examined trends in imaging utilization rates during more than a decade (2003–2016), comparing Medicare fee-for-service enrollees and a large commercially insured population of adults by using the same imaging definitions. The most dramatic changes were the sharp significant (P < .05) drops in utilization rates for CT in 2011, nuclear imaging in 2010, and echocardiography in 2009. Each of these drops was subsequent to code bundling of high-volume codes. Broadly speaking, noninvasive diagnostic imaging (NDI) trends were similar across Medicare fee-for-service enrollees and commercially insured adults aged 18–44 years and aged 45–64 years: increasing use from 2003 through the mid to late 2000s, with declining or stabilized use rates after 2010. In CT, following code bundling in 2011, the overall utilization rate remained flat in the youngest age group but significantly increased in both the 45- to 64-year age group and the Medicare group. Although there was no code bundling in MRI, noncardiac US, or radiography, we also found stabilization in trends across all three groups around the same period. The aforementioned trends suggest that slowing growth of NDI after the late 2000s was driven by factors other than code bundling events in 2009–2011.
In contradistinction to the other modalities, utilization rates for noncardiac US among commercially insured patients aged 18–44 years were considerably greater than those among commercially insured patients aged 45–64 years, likely because of higher use during pregnancy. Among Medicare enrollees and patients aged 18–44 years, no further noncardiac US growth occurred after the late 2000s, but a continued slow increase was seen in the 45- to 64-year age group. The reason for this is not apparent.
In 2009–2011, the Centers for Medicare & Medicaid Services enacted code bundling to reduce payments for physician services that it considered misvalued and that were used together at least 75% of the time (17,18). Commercial insurers followed suit.
When the Centers for Medicare & Medicaid Services bundled codes and assigned relative value units (RVUs) to the new code, the new RVUs were lower than the sum of the RVUs for the older codes. For example, the total RVUs for transthoracic echocardiography plus the spectral Doppler and color Doppler flow imaging add-ons amounted to 9.52 before bundling. After bundling in 2009, the single new code (93306) had an RVU of 7.42, a decrease of 22%. The total RVUs for SPECT with exercise and at rest plus the add-on codes for left ventricular wall motion and ejection fraction amounted to 16.48. After the three procedures were bundled together in 2010, the single new code (78452) had an RVU total of 10.53, a decrease of 36%. The total RVUs for CT of the abdomen with contrast material plus CT of the pelvis with contrast material amounted to 18.63 prior to 2011. After bundling, the new code (74177) had an RVU total of 10.04, a decrease of 46%.
Because these were high-volume codes within their respective modalities, the bundling not only affected overall utilization rates, but also reduced Medicare spending on those modalities. Under the Medicare Physician Fee Schedule, total payments to physicians for echocardiography in 2008 were $1.634 billion and dropped 18% to $1.346 billion in 2009. Nuclear imaging payments in 2009 totaled $1.799 billion and were 21% lower, at $1.414 billion, after myocardial perfusion imaging code bundling. After code bundling of CT of the abdomen and pelvis, total payments to physicians decreased by 15%, from $2.038 billion in 2010 to $1.725 billion in 2011.
Our findings extended those reported in the literature: namely, rapid increases in imaging in the early years of the study, then a slowdown in imaging utilization rates among Medicare fee-for-service enrollees. In addition, our study, for the first time to our knowledge, demonstrated that similar trends existed in the two different age groups of commercially insured patients. There have been only a few previous studies of imaging use in commercially insured patients (1–3,6,7,10). Our study avoided a number of pitfalls that characterized these prior studies, including the following: (a) no indication of whether interventional procedures were included; (b) no indication of whether technical-component claims were included, which would have led to double counting; (c) not covering all modalities; (d) counting only outpatients and excluding inpatients and emergency department patients; and (e) possible failure to include the NDI codes in the 90000 series for echocardiography and vascular US. In our study, exactly the same set of coding conventions was used for both Medicare and commercial insurance claims, and we were very careful to include only codes that truly reflected NDI. Thus, our estimates of utilization rates are more reliably comparable across Medicare fee-for-service enrollees and commercially insured adults.
The persistently higher utilization of NDI in the Medicare population can be explained by the higher burden of disease in older patients. The reasons for the slowdown in imaging use in recent years are less clear. One likely factor affecting the commercially insured population is the requirement for preauthorization for advanced imaging studies through radiology benefit management companies (11). Preauthorization creates a barrier to the ordering of advanced imaging, which may deter some referring providers from obtaining such studies. Another possible factor affecting the commercially insured is the implementation of high-deductible health plans and other forms of cost sharing in recent years (19). Commercial enrollees who have such plans often face a high burden of cost sharing and may be less willing to undergo these expensive examinations (20). However, other studies have not found evidence that patients in these types of commercial plans differentially reduce their radiology utilization (21,22).
The Medicare slowdown could be due to other factors, such as accountable care organizations (although these comprise a minority of providers) or spillover effects from managed Medicare (Medicare Advantage). The latter refers to the likelihood that busy clinicians often do not differentiate between their Medicare fee-for-service patients, who do not need preauthorization, and their Medicare Advantage patients, who usually do. Another potential contributor could be the Deficit Reduction Act of 2005, which took effect in 2007 and sharply reduced Medicare technical component reimbursements for advanced imaging in private offices. Although the Deficit Reduction Act did reduce reimbursement, its effect on utilization is less clear (23).
These potential explanations do not account for some of the overall similarities in trends across the three groups. Because Medicare fee-for-service uses neither preauthorization nor high-deductible health plans, it is of interest that the imaging slowdowns and subsequent trends among its enrollees were similar to those in the commercially insured population. A host of other factors may potentially explain these similarities, including commercial alternative payment programs that mirror the Medicare accountable care organizations, bundled payment programs, overall concerns about radiation exposure and costs, reimbursement cuts, or greater adherence to appropriate use criteria by ordering clinicians (11). Given the timing of imaging rate slowdown in the mid to late 2000s, this may also reflect the effects of broader economic recession on health expenditures.
It is unclear what accounts for the gradual uptick in growth of CT imaging among older adults in recent years. It is possible that hospital facilities with CT scanners are offsetting prior code bundling to maintain revenues, but why this is apparent only in CT imaging is not obvious. This is certainly worthy of further study.
Our study presented, for the first time to our knowledge, information about imaging utilization in commercially insured adults in a manner that enables direct comparison with the Medicare fee-for-service population. The most important findings for radiologists and policy makers are the apparent concordance in broader utilization trends between commercial insurance and Medicare fee-for-service, and the stabilization of growth rates even among modalities in which code bundling did not occur, with some notable exceptions. We suggest that future studies investigate whether the increasing trends in CT imaging for commercially insured patients aged 45–64 years and Medicare recipients in the latter years of our study are clinically appropriate, because of the risks of radiation exposure and the additional costs in these populations.
Our findings should be interpreted in the context of certain limitations. The findings represented the experience of one large commercial insurer, may not have been reflective of all other commercial insurers, and were not nationally representative. Studies examining variation in overall health care spending across the two largest available commercial insurance claims databases including Optum found minimal differences in utilization patterns between the two, but it is not clear whether this extends specifically to NDI (24). We did not include utilization in the Medicare Advantage population, which is a sizable and growing segment of Medicare participants. We did not capture or adjust for differences in population characteristics or changes in cost sharing in the three populations over time. Finally, because of our observational study design, we could not determine the exact reasons underlying these trends.
In conclusion, there is general similarity between imaging utilization trends in the Medicare fee-for-service and commercially insured populations, although utilization is consistently higher in the former. After demonstrating consistent patterns of rapid imaging growth through the mid-2000s followed by overall slowdowns through the late 2000s and 2010s, we noted increasing CT use among commercially insured patients aged 45–64 years and Medicare populations—enough to perhaps stall the previously declining growth rates in overall imaging use in these populations. Although some significant code-bundling events from 2009–2011 may account for some of the arrested growth in imaging utilization, we also noted similar reversals in growth in imaging modalities in which code bundling did not occur, suggesting that broader factors were influencing the trends.
A.S.H. is supported by the Institutional National Research Service Award (T32HP12706), Ryoichi Sasakawa Fellowship Fund, Harvard Pilgrim Health Care Institute, Texas Health Resources Clinical Scholar Program, National Center for Advancing Translational Sciences (UL1TR001105), Agency for Healthcare Research and Quality (R24HS022418), and National Cancer Institute Cancer Center (1P30CA142543-03).
Disclosures of Conflicts of Interest: A.S.H. Activities related to the present article: disclosed no relevant relationships. Activities not related to the present article: spouse received compensation from Janssen and AbbVie for scientific advisory board and speaker bureau participation. Other relationships: disclosed no relevant relationships. D.L. Activities related to the present article: disclosed no relevant relationships. Activities not related to the present article: is a board member of Outpatient Imaging Affiliates; is a consultant for HealthHelp. Other relationships: disclosed no relevant relationships. L.P. disclosed no relevant relationships. V.M.R. disclosed no relevant relationships. D.R.D. Activities related to the present article: institution received a grant from the National Institute of Diabetes and Digestive and Kidney Diseases. Activities not related to the present article: is employed by the Department of Population Medicine. Other relationships: disclosed no relevant relationships. J.F.W. Activities related to the present article: disclosed no relevant relationships. Activities not related to the present article: is employed by Harvard Medical School and Harvard Pilgrim Healthcare. Other relationships: disclosed no relevant relationships.
Abbreviations:
- NDI
- noninvasive diagnostic imaging
- RVU
- relative value unit
References
- 1. Burkhardt JH, Sunshine JH. . Utilization of radiologic services in different payment systems and patient populations . Radiology 1996. ; 200 ( 1 ): 201 – 207 . [DOI] [PubMed] [Google Scholar]
- 2. Bhargavan M, Sunshine JH. . Utilization of radiology services in the United States: levels and trends in modalities, regions, and populations . Radiology 2005. ; 234 ( 3 ): 824 – 832 . [DOI] [PubMed] [Google Scholar]
- 3. Smith-Bindman R, Miglioretti DL, Larson EB. . Rising use of diagnostic medical imaging in a large integrated health system . Health Aff (Millwood) 2008. ; 27 ( 6 ): 1491 – 1502 . [DOI] [PMC free article] [PubMed] [Google Scholar]
- 4. Levin DC, Rao VM, Parker L, Frangos AJ, Sunshine JH. . Bending the curve: the recent marked slowdown in growth of noninvasive diagnostic imaging . AJR Am J Roentgenol 2011. ; 196 ( 1 ): W25 – W29 . [DOI] [PubMed] [Google Scholar]
- 5. Levin DC, Rao VM, Parker L, Frangos AJ. . The sharp reductions in Medicare payments for noninvasive diagnostic imaging in recent years: will they satisfy the federal policymakers? J Am Coll Radiol 2012. ; 9 ( 9 ): 643 – 647 . [DOI] [PubMed] [Google Scholar]
- 6. Lee DW, Levy F. . The sharp slowdown in growth of medical imaging: an early analysis suggests combination of policies was the cause . Health Aff (Millwood) 2012. ; 31 ( 8 ): 1876 – 1884 . [DOI] [PubMed] [Google Scholar]
- 7. Smith-Bindman R, Miglioretti DL, Johnson E, et al . Use of diagnostic imaging studies and associated radiation exposure for patients enrolled in large integrated health care systems, 1996-2010 . JAMA 2012. ; 307 ( 22 ): 2400 – 2409 . [DOI] [PMC free article] [PubMed] [Google Scholar]
- 8. Dodoo MS, Duszak R, Jr, Hughes DR. . Trends in the utilization of medical imaging from 2003 to 2011: clinical encounters offer a complementary patient-centered focus . J Am Coll Radiol 2013. ; 10 ( 7 ): 507 – 512 . [DOI] [PubMed] [Google Scholar]
- 9. Lang K, Huang H, Lee DW, Federico V, Menzin J. . National trends in advanced outpatient diagnostic imaging utilization: an analysis of the medical expenditure panel survey, 2000-2009 . BMC Med Imaging 2013. ; 13 ( 1 ): 40 – 49 . [DOI] [PMC free article] [PubMed] [Google Scholar]
- 10. Horný M, Burgess JF, Jr, Cohen AB. . Advanced imaging utilization trends in privately insured patients from 2007 to 2013 . J Am Coll Radiol 2015. ; 12 ( 12 Pt B ): 1380 – 1387.e4 . [DOI] [PubMed] [Google Scholar]
- 11. Levin DC, Parker L, Palit CD, Rao VM. . After nearly a decade of rapid growth, use and complexity of imaging declined, 2008-14 . Health Aff (Millwood) 2017. ; 36 ( 4 ): 663 – 670 . [DOI] [PubMed] [Google Scholar]
- 12. Rosman DA, Duszak R, Jr, Wang W, Hughes DR, Rosenkrantz AB. . Changing utilization of noninvasive diagnostic imaging over 2 decades: an examination family-focused analysis of Medicare claims using the Neiman imaging types of service categorization system . AJR Am J Roentgenol 2018. ; 210 ( 2 ): 364 – 368 . [DOI] [PubMed] [Google Scholar]
- 13. Iglehart JK. . Health insurers and medical-imaging policy—a work in progress . N Engl J Med 2009. ; 360 ( 10 ): 1030 – 1037 . [DOI] [PubMed] [Google Scholar]
- 14. Lerman PM. . Fitting segmented regression models by grid search . Appl Stat 1980. ; 29 ( 1 ): 77 – 84 . [Google Scholar]
- 15. Edgington ES, Onghena P. . Randomization tests . 4th ed. Boca Raton, Fla: : Chapman & Hall/CRC; , 2007. . [Google Scholar]
- 16. Kim HJ, Fay MP, Feuer EJ, Midthune DN. . Permutation tests for joinpoint regression with applications to cancer rates . Stat Med 2000. ; 19 ( 3 ): 335 – 351 . [DOI] [PubMed] [Google Scholar]
- 17. Silva E., 3rd. New codes from a new source: the rolling five-year review . J Am Coll Radiol 2010. ; 7 ( 1 ): 10 – 12 . [DOI] [PubMed] [Google Scholar]
- 18. Levin DC, Rao VM, Parker L. . Financial impact of Medicare code bundling of CT of the abdomen and pelvis . AJR Am J Roentgenol 2014. ; 202 ( 5 ): 1069 – 1071 . [DOI] [PubMed] [Google Scholar]
- 19. Rosato D. . How to survive a high-deductible health plan . Consumer Reports. https://www.consumerreports.org/health-insurance/high-deductible-health-plan/. Published November 17, 2016. Accessed December 2, 2019 . [PubMed]
- 20. Brot-Goldberg ZC, Chandra A, Handel BR, Kolstad JT. . What does a deductible do? The impact of cost-sharing on health care prices, quantities, and spending dynamics . Q J Econ 2017. ; 132 ( 3 ): 1261 – 1318 . [Google Scholar]
- 21. Hong AS, Ross-Degnan D, Zhang F, Wharam JF. . Small Decline In Low-Value Back Imaging Associated with the ‘Choosing Wisely’ Campaign, 2012-14 . Health Aff (Millwood) 2017. ; 36 ( 4 ): 671 – 679 . [DOI] [PubMed] [Google Scholar]
- 22. Reddy SR, Ross-Degnan D, Zaslavsky AM, Soumerai SB, Wharam JF. . Impact of a high-deductible health plan on outpatient visits and associated diagnostic tests . Med Care 2014. ; 52 ( 1 ): 86 – 92 . [DOI] [PMC free article] [PubMed] [Google Scholar]
- 23. Levin DC, Rao VM, Parker L. . Trends in the utilization of outpatient advanced imaging after the deficit reduction act . J Am Coll Radiol 2012. ; 9 ( 1 ): 27 – 32 . [DOI] [PubMed] [Google Scholar]
- 24. Institute of Medicine; Board on Health Care Services; Committee on Geographic Variation in Health Care Spending and Promotion of High-Value Care ; et al . Variation in Health Care Spending: Target Decision Making, Not Geography . Washington, DC: : The National Academies Press; , 2013. . [PubMed] [Google Scholar]


