Abstract
Background
Staff who perform fluoroscopically guided interventional (FGI) procedures are among the most highly radiation-exposed groups in medicine. However, there are limited data on monthly or annual doses (or dose trends over time) for these workers.
Purpose
To summarize occupational badge doses (lens dose equivalent and effective dose equivalent values) for medical staff performing or assisting with FGI procedures in 3 recent years after accounting for uninformative values and one- versus two-badge monitoring protocol.
Materials and Methods
Badge dose entries of medical workers believed to have performed or assisted with FGI procedures were retrospectively collected from the largest dosimetry provider in the United States for 49 991, 81 561, and 125 669 medical staff corresponding to years 2009, 2012, and 2015, respectively. Entries judged to be uninformative of occupational doses to FGI procedures staff were excluded. Monthly and annual occupational doses were described using summary statistics.
Results
After exclusions, 22.2% (153 033 of 687 912) of the two- and 32.9% (450 173 of 1 366 736) of the one-badge entries were judged to be informative. There were 335 225 and 916 563 of the two- and one-badge entries excluded, respectively, with minimal readings in the above-apron badge. Among the two-badge entries, 123 595 were incomplete and 76 059 had readings indicating incorrect wear of the badges. From 2009 to 2015 there was no change in lens dose equivalent values among workers who wore one badge (P = .96) or those who wore two badges (P = .23). Annual lens dose equivalents for workers wearing one badge (median, 6.9 mSv; interquartile range, 3.8213.8 mSv; n = 6218) were similar to those of staff wearing two badges (median, 7.1 mSv; interquartile range, 4.6−11.2 mSv; n = 1449) (P = .18), suggesting a similar radiation environment.
Conclusion
These workers are among the highest exposed to elevated levels of ionizing radiation, although their occupational doses are within U.S. regulatory limits. This is a population that requires consistent and accurate dose monitoring; however, failure to return one or both badges, reversal of badges, and improper badge placement are a major hindrance to this goal.
© RSNA, 2019
Online supplemental material is available for this article.
See also the editorial by Karellas in this issue.
Summary
By using data from the largest dosimetry provider in the United States, occupational doses to medical staff performing or assisting with fluoroscopically guided interventional procedures in 2009, 2012, and 2015 were below U.S. regulatory occupational dose limits for most workers, although 15% of occupational doses exceeded the eye dose limits recommended by the International Commission on Radiological Protection.
Key Results
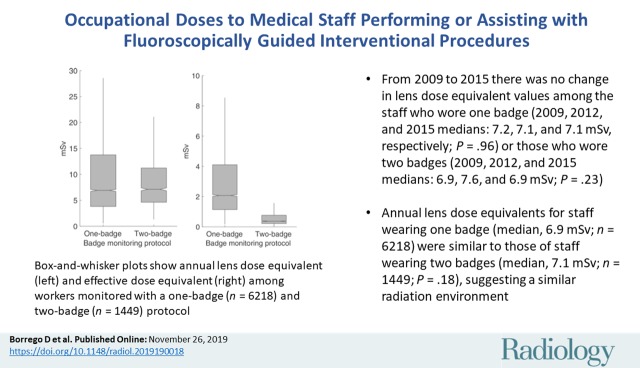
■ From 2009 to 2015 there was no change in lens dose equivalent values among the staff who wore one badge (2009, 2012, and 2015 medians: 7.2, 7.1, and 7.1 mSv, respectively; P = .96) or those who wore two badges (2009, 2012, and 2015 medians: 6.9, 7.6, and 6.9 mSv; P = .23).
■ Annual lens dose equivalents for staff wearing one badge (median, 6.9 mSv; n = 6218) were similar to those of staff wearing two badges (median, 7.1 mSv; n = 1449; P = .18), suggesting a similar radiation environment.
Introduction
In recent decades, the number and complexity of fluoroscopically guided interventional (FGI) procedures has increased substantially because of the numerous benefits afforded to patients over conventional surgery (1) and advances in the field. FGI procedures are minimally invasive allowing for a shorter recovery time, reduced costs, and improved surgical outcomes (2). With the advent of newer technologies, FGI procedures are performed for a wider range of diseases and increasingly complex cases. The growth in the number of medical staff assisting with FGI procedures has not kept pace with these changes, resulting in increased procedure volumes and potentially increased exposure to ionizing radiation (3). New technologies in the fluoroscopic suite have helped to reduce the use of radiation but it is unclear if they are able to offset the additional radiation to these workers from increases in workload.
The radiation exposure to medical staff performing or assisting with FGI procedures is among the highest in medical practice (4–6). Working in this environment for a prolonged period without proper radiation safety training or the use of personal protective equipment may lead to occupational doses in excess of regulatory limits. High-quality dosimetry information pertaining to occupational exposure levels is needed to better inform radiation protection practices and for application in epidemiologic studies designed to study radiation-related risks of cataracts, cancer, and other serious diseases (7–12). However, past studies of occupational exposures for this group of workers reported doses on a per-procedure basis. To our knowledge, there are no data on annual occupational doses or trends in doses over time for these workers in the United States, where these procedures are performed frequently (1).
The purpose of our study is to summarize occupational badge doses (lens dose equivalent and effective dose equivalent values) for medical staff performing or assisting with FGI procedures in 3 recent years (2009, 2012, and 2015). We compared these values according to the use of a one-badge or two-badge protocol because of the potential differences in radiation environments and unique methodologic considerations, including the need for separate assessment of inconsistent and improper badge placement and known differences in the formulas used to calculate effective dose equivalents.
Materials and Methods
Because the United States lacks a national registry of occupational doses to medical workers, we must rely on dosimetry providers or the institution’s radiation safety office to obtain this information. For this study, occupational doses were provided by Landauer (Glenwood, Ill), the dosimetry provider for the majority of acute care hospitals in the United States. Landauer provided data from 2009, 2012, and 2015 for personnel believed to have assisted or performed FGI procedures on the basis of their badge analysis profile indicating if a special formula was used to assign the effective dose equivalent. The effective dose equivalent in these workers was assigned by using a special formula according to use of a one-badge or two-badge protocol, as recommended by the Suggested State Regulations for Control of Radiation (13) and federal guidance (14). In the United States, these workers are monitored with personal dosimeters. With a one-badge approach, the badge is worn above the leaded apron at the collar level. With a two-badge approach, an additional badge is worn underneath the apron at the waist or chest level. We collected a total of 2 054 648 entries from the Landauer database corresponding to 49 991, 81 561, and 125 669 medical staff in the years 2009, 2012, and 2015, respectively. Two authors (D.B. and C.Y.) were responsible for acquisition and processing of data. All authors were responsible for data analysis and interpretation of the results. All authors reviewed the manuscript.
Dosimetry Information
The dosimetry information included operational quantities of personal dose equivalent at a reference depth of 10 mm and 3 mm, Hp(10) and Hp(3), respectively, and a calculated estimate of the protection quantity of effective dose equivalent, HE. Dose readings came from Luxel+ dosimeters (Landauer). The measured personal dose equivalent at a reference depth of 3 mm is used to link the external irradiation to the dose equivalent at the lens of the eye, whereas a depth of 10 mm is used to assign the effective dose equivalent.
Briefly, it is worth considering the distinction between operational quantities (15,16) and protection quantities (17). Operational quantities, such as the personal dose equivalent, can be measured with monitoring devices that are calibrated and traceable to a published standard, known as metrological traceability. In the United States, the metrological traceability is established through the National Voluntary Laboratory Accreditation Program to meet the ANSI HPS N13.11 standard (18). This metrological traceability allows us to compare operational quantities recorded at different institutions. However, protection quantities, such as the effective dose equivalent, are not directly measurable but rather calculated from operational quantities. This derivation can vary by institution. The use of effective dose equivalent, HE, does not comport with concepts put forth by the International Commission on Radiological Protection, which prefers the quantity of effective dose, E (5).
In the United States, regulatory guidance allows for approved methods to determine the effective dose equivalent for compliance with regulatory dose limits among medical staff associated with FGI procedures (14,19). The approved methods modify the operational quantity of a measured personal dose equivalent at a reference depth of 10 mm to account for the additional protection afforded by the leaded apron when estimating the protection quantity of effective dose equivalent (20,21). For workers monitored with the one-badge protocol, the following equation was used to calculate the effective dose equivalent:
,
|
where HE is the effective dose equivalent and Hp(10)collar is the personal dose equivalent at a reference depth of 10 mm measured at the collar level above the lead apron. For workers monitored with the two-badge protocol, we used the equation
|
, |
where Hp(10)waist is the personal dose equivalent at a reference depth of 10 mm measured at the waist underneath the lead apron.
Exclusion Criteria
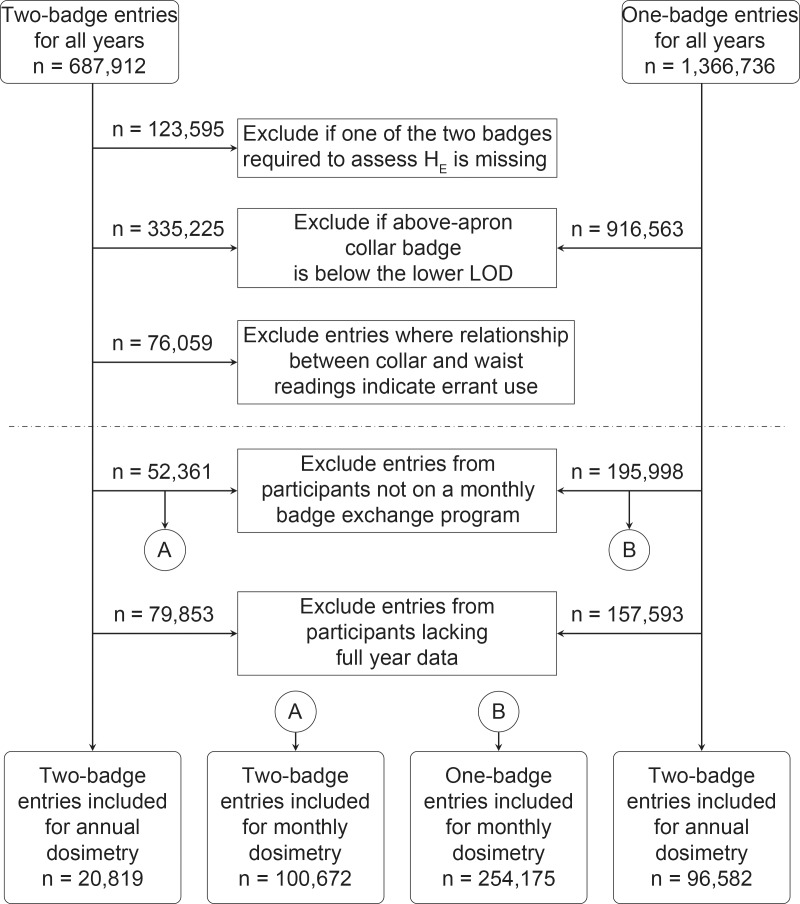
Exclusions were applied to each of the 2 054 648 entries. We excluded entries in which it was not possible to ascertain the effective dose equivalent. That is, for entries of a one-badge protocol, the above-apron badge must have registered a dose above the lower limit of detection (LOD) of 0.02 mSv. For the two-badge protocol, we excluded entries in which one of the badges was not returned or if the above-apron badge registered a dose below the lower LOD (Fig 1). The latter values were excluded because medical staff who routinely work inside the fluoroscopic suite when the fluoroscope is actuated are expected to have a measurable above-the-apron badge dose (4,22–24). Additional exclusions were made on the basis of the expected relationship between the dose readings registered by the above- versus under-apron badge. By using criteria reported by Yoder and Salasky (25), the expected relationships indicating proper wear of the badges are as follows:
The Hp(10)collar-to-Hp(10)waist ratio should be greater than 4. A ratio of 4 or less is expected if the badge locations are reversed or if the badges are inconsistently used.
The Hp(10)collar-to-Hp(10)waist ratio should be less than 200. A ratio of 200 or greater would indicate that the under-apron badge is worn inconsistently.
The difference between the Hp(10)collar and Hp(10)waist should be greater than 0.05 mSv. A difference of 0.05 mSv or less is expected if badge locations are reversed.
Figure 1:
Flowchart of selection of badge entries used to report monthly and annual dose values. The numbers reported are the sum of all years, 2009, 2012, and 2015. The lower limit of detection (LOD) is 0.02 mSv. Entries below the dotted line are judged to provide informative data on occupational doses within the fluoroscopic suite; however, not all of these entries were included in our analysis of monthly or annual doses either because the workers were not on a monthly exchange protocol or they lacked a full year of reliable doses, respectively. HE = effective dose equivalent.
Under-apron readings below the lower LOD were set to 0.01 mSv to avoid division by 0 solely for the purposes of evaluating the mentioned ratios, following the methods of Yoder and Salasky (25). Badge entries with dose readings that did not meet the expected relationships were excluded from all subsequent analyses.
Inclusion Criteria for Reporting of Monthly and Annual Data
We limited our study to workers on a monthly monitoring exchange because they likely represent the group with the highest exposure. Workers included in our monthly data analysis had 12 entries before exclusions and a badge issuance date for each month of the year. To be included in our annual data analysis we required that a worker have 12 valid monthly entries for that year.
For workers monitored with the two-badge protocol, we report two sets of dosimetry values. The first set of values included all eligible data. The second set of values required that workers recorded a value above the lower LOD in the under-apron badge in the monthly data set, and for the annual data set we required that they consistently (≥9 months of the year) recorded a value greater than the lower LOD. We analyzed the doses in this restricted group, who represent the highest exposed, to better understand what the radiation safety office may expect if they elected to switch from a two-badge to the more conservative one-badge protocol.
Statistical Analysis
Monthly and annual data of occupational doses were described by using univariate statistics (eg, median and interquartile range) and box-and-whisker plots. When appropriate, the Wilcoxon rank sum and Kruskal-Wallis test were used to compare distributions. The significance of all statistical tests was assessed with 95% confidence levels (α = .05). All analyses were performed by using statistical software (Matlab and the Matlab Statistics and Machine Learning Toolbox; Mathworks, Natick, Mass).
Results
In 2009, we collected information from 1200 institutions. Of these 1200 institutions, 473 (39.4%) used the two-badge protocol, 392 (32.7%) used the one-badge protocol, and 335 (27.9%) used a combination of both protocols to monitor and assign the effective dose equivalent. By 2015 the number of institutions in our data set increased to 1589, with a growing number of institutions choosing to monitor their workers by using the one-badge protocol. Of the 1589 institutions in 2015, 204 (12.8%) used the two-badge protocol, 649 (40.8%) used the one-badge protocol, and 736 (46.3%) used a combination of both protocols. From 2009 to 2015, the number of staff members monitored by the one-badge protocol increased by nearly threefold (from 31 382 to 92 640), whereas the number of staff monitored with the two-badge protocol increased by nearly twofold (from 18 609 to 33 029).
Of the two-badge protocol data, we excluded 25.2% (44 829 of 177 665) and 27.5% (78 766 of 286 328) of entries for the years 2009 and 2015, respectively, because of failure to return both badges. The two-badge data for 2012 originated from a previous database query that had already excluded incomplete badge pairs. For all years, 59.4% (335 225 of 564 317) and 67.1% (916 563 of 1 366 736) of two-badge and one-badge protocol entries, respectively, had dose readings below the lower LOD that prevented the calculation of the effective dose equivalent. Overall, 76 059 of the two-badge entries had readings indicating incorrect wear of the badges. From 2009 to 2015, the proportion of two-badge entries excluded because of improper use decreased from 38.4% (22 308 of 58 084) to 29.3% (23 179 of 79 166). The remaining 603 206 entries, or 29.4% (603 206 of 2 054 648) of the original data set, were judged to provide informative data on occupational doses within the fluoroscopic suite, but only 58.8% (354 847 of 603 206) were part of a monthly exchange program. Occupational doses for individuals monitored on a quarterly exchange program are provided in Tables E1–E3 (online). Of the monthly entries, only 33.1% (117 401 of 354 847) were used in the estimates of annual doses. Incomplete annual data are a natural occurrence because of staff entering and exiting employment at an institution during the year.
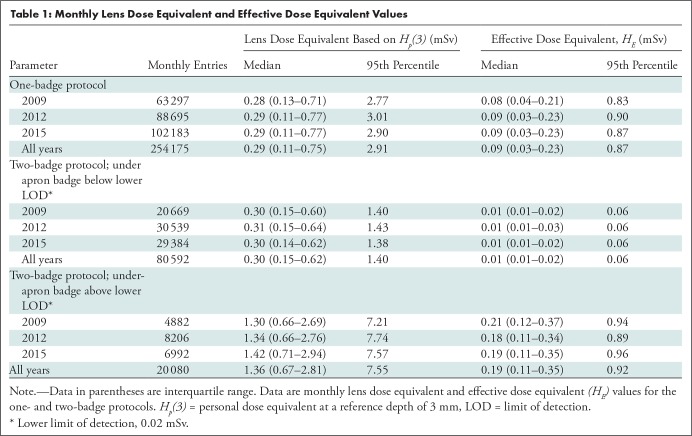
In Table 1, we report monthly lens dose equivalent and effective dose equivalent values. Regardless of protocol, the lens dose equivalent is the measured Hp(3) by the badge worn above the apron at the collar level and not at or adjacent to the eye. Median monthly doses of the lens dose equivalent were 0.29 and 0.30 mSv for the one-badge and two-badge protocols, respectively. Median monthly doses of the effective dose equivalent were 0.09 and 0.01 mSv for the one-badge and two-badge protocols, respectively. We did not observe a change in the monthly lens dose equivalent and effective dose equivalent values from 2009 to 2015.
Table 1:
Monthly Lens Dose Equivalent and Effective Dose Equivalent Values
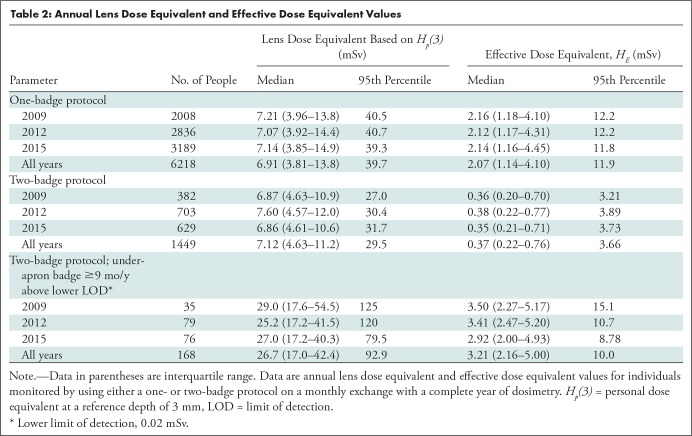
The annual dosimetry data are reported in Table 2 for staff with a full year history after exclusions. Although annual lens dose equivalents for workers monitored with one badge (median, 6.91 mSv; interquartile range, 3.81–13.8 mSv; n = 6218) were similar to those of workers monitored with two badges (median, 7.12 mSv; interquartile range, 4.63−11.2 mSv; n = 1449) (P = .18), annual reported effective dose equivalents were greater among workers who were monitored with one badge (median, 2.07 mSv; interquartile range, 1.14−4.10 mSv) versus two badges (median, 0.37 mSv; interquartile range, 0.22–0.76 mSv) (P < .001) (Fig 2). We did not observe a significant change in measured radiation levels from 2009 to 2015 for workers who used either the one-badge (P = .96) or two-badge (P = .23) protocol. In our data set, 74.8% (1084 of 1449) of workers monitored with the use of a two-badge protocol consistently (≥9 months of the year) registered a dose below the lower LOD in the under-apron badge. When we restricted our analysis to workers who consistently recorded a value above the lower LOD in both badges (11.6% of all workers; 168 of 1449), the median annual reported doses were 26.74 mSv and 3.21 mSv for the lens dose equivalent and effective dose equivalent, respectively.
Table 2:
Annual Lens Dose Equivalent and Effective Dose Equivalent Values
Figure 2a:
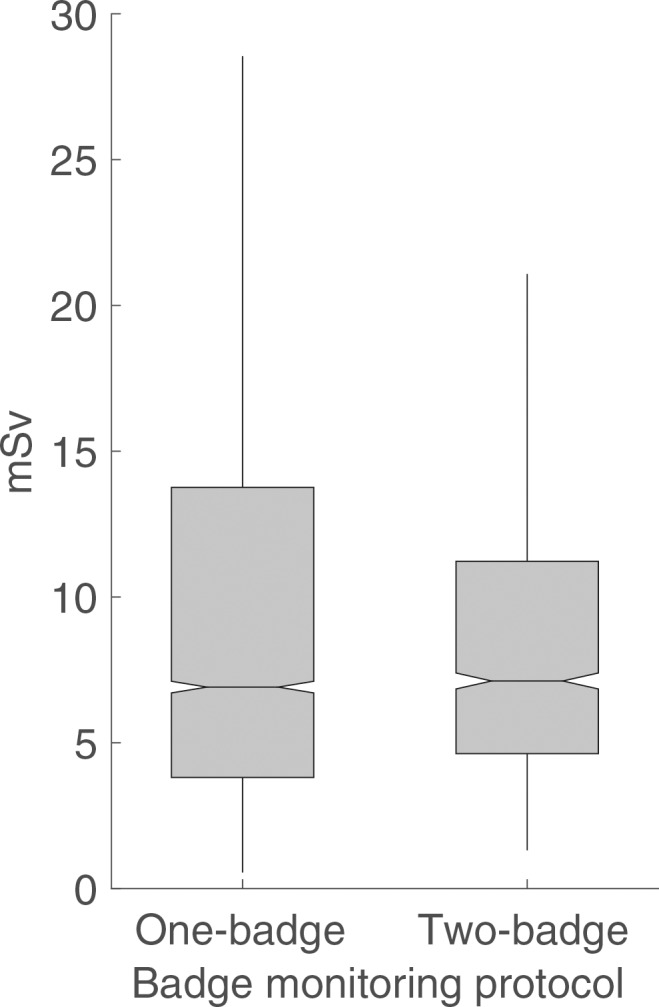
Box-and-whisker plots show (a) annual lens dose equivalent and (b) effective dose equivalent among workers monitored with a one-badge (n = 6218) and two-badge (n = 1449) protocol. The ends of the box are the upper and lower quartiles.
Figure 2b:
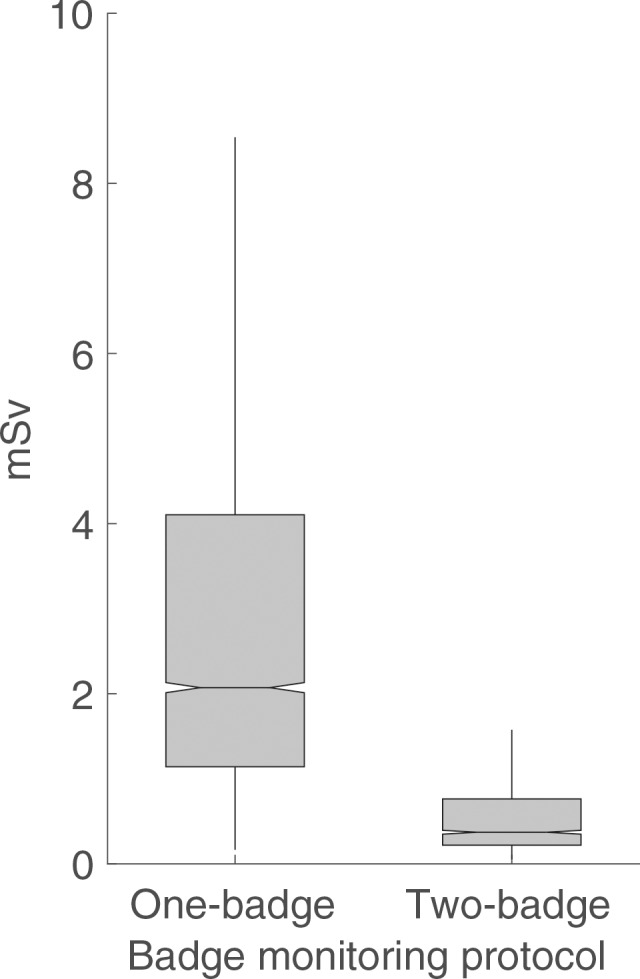
Box-and-whisker plots show (a) annual lens dose equivalent and (b) effective dose equivalent among workers monitored with a one-badge (n = 6218) and two-badge (n = 1449) protocol. The ends of the box are the upper and lower quartiles.
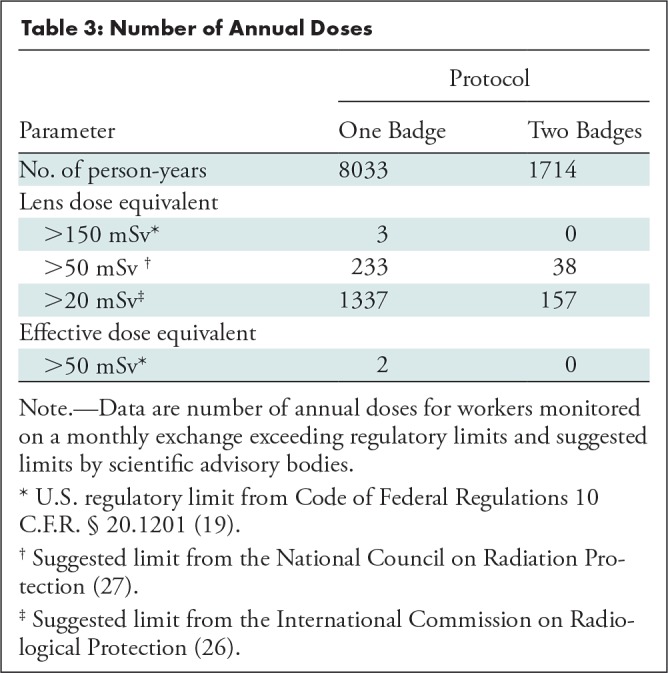
In our data set with 9747 person-years of data, only two workers (workers A and B) exceeded both the annual occupational dose limit of 50-mSv effective dose equivalent and 150-mSv lens dose equivalent (Table 3). One additional worker (worker C) exceeded the lens dose equivalent without exceeding the effective dose equivalent limit. For workers A and C, the high dose values can be attributed to a single elevated monthly reading well above their remaining 11 readings of the year. Current recommendations by the International Commission on Radiological Protection limit the lens dose equivalent to 20 mSv in a single year or 100 mSv in 5 consecutive years, with no single year exceeding 50 mSv (26). In our data set, 15.3% (1494 of 9747) of the time workers with full-year dosimetry exceeded a lens dose equivalent of 20 mSv, 2.8% (271 of 9747) for the 50-mSv limit recommended by the National Council on Radiation Protection (27), and 0.03% (three of 9747) for the 150-mSv limit per year set by the Standards for Protection Against Radiation in the United States (19) on the basis of a measurement of Hp(3) taken at the collar level.
Table 3:
Number of Annual Doses
Discussion
In this study, we summarized badge doses collected from 257 221 U.S. medical workers performing fluoroscopically guided imaging (FGI) procedures during 3 recent calendar years. For medical staff routinely working inside the fluoroscopic suite while the fluoroscope is actuated, it is expected that a positive reading of dose be recorded by the above-apron badge (4,22–24). The large portion of above-apron readings below the lower limit of detection (LOD) could be explained by increased surveillance among individuals who are not required to be in the procedure room or, more problematically, a failure to wear one or both badges (24,28–30). Among medical staff monitored with the two-badge protocol, increasing awareness of occupational radiation risks and radiation protection training (6) may have contributed to the decline we observed in incorrect or erroneous wear of the badges.
A collar level measurement of personal dose equivalent at a reference depth of 3 mm approximates the dose to the lens of the eye; however, it does not account for spatial dose gradients or the reduction in dose from additional personal protective equipment used by some of the medical staff (eg, protective eyewear). The range of mean annual lens dose equivalent values (data not shown in tables) in our data set among workers with a full year of data were 10−12 mSv depending on the year and badge monitoring protocol. For the group of workers who consistently recorded a value above the lower LOD in both badges, the range of mean annual lens dose equivalent increased to 32−40 mSv. Our values are comparable to published values of dose to the lens of the eye, which ranged from 4.1 to 45 mSv for interventional radiologists and from 1 to 247 mSv for interventional cardiologists, with mean values of 4.01 mSv ± 2.36 (standard deviation) and 19.6 mSv ± 12.59 for nurses and interventional cardiologists, respectively (31–33). Mean dose values in our sample are higher than reported values for general medical workers in the United States (mean, 0.74 mSv vs 0.75 mSv for 2003 vs 2006, respectively) (34). Continued radiation protection training and the use of protective eyewear may help reduce the percentage of medical staff exceeding a lens dose equivalent of 20 mSv to no more than the 12.5% predicted by Pekkarinen et al (35) or the 5% reported by Szumska et al (36).
On the basis of similar lens dose equivalents measured by the above-apron badge, the selection of the monitoring protocol does not appear to be informed by the radiologic conditions staff encounter. The differences in the effective dose equivalents arise primarily from the different formulas to assign the effective dose equivalent allowed by regulatory agencies. A review of the formulas seems prudent to enhance the comparability of the two monitoring methods. Making use of Equation 1 to assign the effective dose equivalent for the highest exposed group of workers monitored with the two-badge protocol would increase their effective dose equivalents by no more than a factor of 3; the resulting doses would still be within regulatory limits in the United States. This is an important finding because we observed that an increasing number of institutions use the one-badge protocol over the two-badge protocol. As more people are monitored with the one-badge method, the recorded effective dose equivalent values in the dosimetry records are expected to increase solely because of the differences in the formula used. We speculate that lower costs and greater simplicity in implementing a one-badge protocol may be contributing to the increasing use of the one-badge protocol.
Limitations of our study include our inability to link doses across institutions for staff practicing at multiple sites during a given year. Medical staff are believed to assist or perform FGI procedures on the basis of their badge analysis profile; however, it is possible that a portion of their occupational dose comes from procedures and studies that do not involve the use of fluoroscopy and we were unable to separate this contribution to dose. We were also unable to report on the erroneous use of badges worn by medical staff monitored with the one-badge protocol; however, given the reduced complexity of the one-badge protocol, the rate of erroneous use is likely smaller than that of the two-badge protocol. Moreover, we could not report dose readings on the basis of job title because this information is not recorded in the Landauer database. Lastly, we queried the Landauer database for a period in which there was an increasing effort to promote a culture of radiation protection (6). During this period, we observed changes in the numbers of staff monitored and the protocol selection, and a decrease in rates of errant wear; however, our short period may have precluded us from observing trends in occupational doses over time. Thus, a longer follow-up may be required.
In conclusion, workers who perform fluoroscopically guided interventional procedures are exposed to elevated levels of ionizing radiation, although their occupational doses are within U.S. regulatory limits. This is a population that requires consistent and accurate dose monitoring; however, failure to return one or both badges, reversal of badges, and improper badge placement are major hindrances to this goal. Because we did not have information on job titles, future studies should focus on the physician operators who are nearest to the radiation source and likely have much higher annual doses than other staff members.
SUPPLEMENTAL TABLES
Study supported by the Intramural Research Program of the National Cancer Institute, National Institutes of Health.
Disclosures of Conflicts of Interest: D.B. disclosed no relevant relationships. C.M.K. disclosed no relevant relationships. S.B. disclosed no relevant relationships. C.Y. Activities related to the present article: disclosed money paid to author for consulting fee covering data collection, analysis, and final report to contracting agent from the National Cancer Institute. Activities not related to the present article: disclosed no relevant relationships. Other relationships: disclosed no relevant relationships.
Abbreviations:
- FGI
- fluoroscopically guided intervention
- LOD
- limit of detection
References
- 1. Mettler FA, Jr, Bhargavan M, Faulkner K, et al. Radiologic and nuclear medicine studies in the United States and worldwide: frequency, radiation dose, and comparison with other radiation sources--1950-2007 . Radiology 2009. ; 253 ( 2 ): 520 – 531 . [DOI] [PubMed] [Google Scholar]
- 2. Miller DL. . Efforts to optimize radiation protection in interventional fluoroscopy . Health Phys 2013. ; 105 ( 5 ): 435 – 444 . [DOI] [PubMed] [Google Scholar]
- 3. Lim H, Linet MS, Van Dyke ME, et al. Changing Patterns in the Performance of Fluoroscopically Guided Interventional Procedures and Adherence to Radiation Safety Practices in a U.S. Cohort of Radiologic Technologists . AJR Am J Roentgenol 2016. ; 207 ( 6 ): 1350 – 1359 . [DOI] [PMC free article] [PubMed] [Google Scholar]
- 4. National Council on Radiation Protection and Measurements . Radiation Dose Management for Fluoroscopically-Guided Interventional Medical Procedures . NCRP Report No.: 168 . Bethesda, Md: : National Council on Radiation Protection and Measurements; , 2010. . [Google Scholar]
- 5. López PO, Dauer LT, Loose R, et al. ICRP Publication 139: Occupational Radiological Protection in Interventional Procedures . [Published corrections appear in Ann ICRP 2019;48(1):98 and Ann ICRP 2019;48(1):99.] Ann ICRP 2018;47(2):1–118 . [DOI] [PubMed]
- 6. Tsapaki V, Balter S, Cousins C, et al. The International Atomic Energy Agency action plan on radiation protection of patients and staff in interventional procedures: Achieving change in practice . Phys Med 2018. ; 52 : 56 – 64 . [DOI] [PubMed] [Google Scholar]
- 7. Ko S, Kang S, Ha M, et al. Health Effects from Occupational Radiation Exposure among Fluoroscopy-Guided Interventional Medical Workers: A Systematic Review . J Vasc Interv Radiol 2018. ; 29 ( 3 ): 353 – 366 . [DOI] [PubMed] [Google Scholar]
- 8. Thome C, Chambers DB, Hooker AM, Thompson JW, Boreham DR. . Deterministic Effects to the Lens of the Eye Following Ionizing Radiation Exposure: is There Evidence to Support a Reduction in Threshold Dose? Health Phys 2018. ; 114 ( 3 ): 328 – 343 . [DOI] [PubMed] [Google Scholar]
- 9. Karatasakis A, Brilakis HS, Danek BA, et al. Radiation-associated lens changes in the cardiac catheterization laboratory: Results from the IC-CATARACT (CATaracts Attributed to RAdiation in the CaTh lab) study . Catheter Cardiovasc Interv 2018/2018. ; 91 ( 4 ): 647 – 654 . [DOI] [PubMed] [Google Scholar]
- 10. Velazquez-Kronen R, Borrego D, Gilbert ES, et al. Cataract risk in US radiologic technologists assisting with fluoroscopically guided interventional procedures: a retrospective cohort study . Occup Environ Med 2019. ; 76 ( 5 ): 317 – 325 . [DOI] [PMC free article] [PubMed] [Google Scholar]
- 11. Linet MS, Kitahara CM, Ntowe E, et al. Mortality in U.S. Physicians Likely to Perform Fluoroscopy-guided Interventional Procedures Compared with Psychiatrists, 1979 to 2008 . Radiology 2017. ; 284 ( 2 ): 482 – 494 . [DOI] [PMC free article] [PubMed] [Google Scholar]
- 12. Kitahara CM, Linet MS, Balter S, et al. Occupational Radiation Exposure and Deaths From Malignant Intracranial Neoplasms of the Brain and CNS in U.S. Radiologic Technologists, 1983-2012 . AJR Am J Roentgenol 2017. ; 208 ( 6 ): 1278 – 1284 . [DOI] [PMC free article] [PubMed] [Google Scholar]
- 13.Conference of Radiation Control Program Directors , Inc. CRCPD Dynamic Document of Suggested State Regulations for Control of Radiation. SSRCR Vol 1 (Ionizing), Dynamic Document. Frankfort, KY, USA: 2003; D1-D149. https://www.crcpd.org/page/SSRCRs. Accessed DATE. [Google Scholar]
- 14. U.S. Nuclear Regulatory Commission . Regulatory Guide 8.40: Methods for Measuring Effective Dose Equivalent From External Exposure. ADAMS Accession No. ML100610534 . Washington, DC: : U.S. Nuclear Regulatory Commission; , Jul 13. , 2010. ; 1 – 8 . [Google Scholar]
- 15. International Commission on Radiation Units and Measurements . Equivalents from External Radiation Sources - Part 2. ICRU Report No.: 43 . Bethesda, Md: : International Commission on Radiation Units and Measurements; , 1988. ; 1 – 65 . [Google Scholar]
- 16. International Commission on Radiation Units and Measurements . Measurement of Dose Equivalents from External Photon and Electron Radiations. ICRU Report No.: 47 . Bethesda, Md: : International Commission on Radiation Units and Measurements; , 1992. ; 1–48 . [Google Scholar]
- 17. International Commission on Radiological Protection . ICRP Publication 26: Recommendations of the ICRP . Ann ICRP 1977. ; 1 ( 3 ): 1 – 53 . [DOI] [PubMed] [Google Scholar]
- 18. American National Standards Institute . ANSI/HPS N13.11-2009 (R2015): Personnel Dosimetry Performance – Criteria for Testing. Health Physics Society . McLean, Va: : American National Standards Institute; , March 12, 2015. ; 1 – 51 . [Google Scholar]
- 19. Standards for Protection Against Radiation.10 C.F.R. § 20.1201 . U.S. Nuclear Regulatory Commission; . Washington, DC, USA: : May 21. , 1991. . [Google Scholar]
- 20. Webster EW. . EDE for exposure with protective aprons . Health Phys 1989. ; 56 ( 4 ): 568 – 569 . [PubMed] [Google Scholar]
- 21. National Council on Radiation Protection and Measurements . Use of Personal Monitors to Estimate Effective Dose Equivalent and Effective Dose to Workers for External Exposure to Low-LET Radiation. NCRP Report No.: 122 . Bethesda, Md: : National Council on Radiation Protection and Measurements; , 1995. . [Google Scholar]
- 22. Chida K, Kaga Y, Haga Y, et al. Occupational dose in interventional radiology procedures . AJR Am J Roentgenol 2013. ; 200 ( 1 ): 138 – 141 . [DOI] [PubMed] [Google Scholar]
- 23. Vañó E, Fernandez JM, Sanchez R. . Occupational dosimetry in real time. Benefits for interventional radiology . Radiat Meas 2011. ; 46 ( 11 ): 1262 – 1265 . [Google Scholar]
- 24. Padovani R, Le Heron J, Cruz-Suarez R, et al. International project on individual monitoring and radiation exposure levels in interventional cardiology . Radiat Prot Dosimetry 2011. ; 144 ( 1-4 ): 437 – 441 . [DOI] [PubMed] [Google Scholar]
- 25. Yoder RC, Salasky MR. . A Review of Two Methods Used in the USA to Assess HE During Fluoroscopic-Based Radiology . Radiat Prot Dosimetry 2016. ; 170 ( 1-4 ): 307 – 310 . [DOI] [PubMed] [Google Scholar]
- 26. Authors on behalf of ICRP , Stewart FA, Akleyev AV, et al. ICRP publication 118: ICRP statement on tissue reactions and early and late effects of radiation in normal tissues and organs--threshold doses for tissue reactions in a radiation protection context . Ann ICRP 2012. ; 41 ( 1-2 ): 1 – 322 . [DOI] [PubMed] [Google Scholar]
- 27. National Council on Radiation Protection and Measurements . Guidance on Radiation Dose Limits for the Lens of the Eye. NCRP Commentary No.: 26 . Bethesda, Md: : National Council on Radiation Protection and Measurements; , 2016. . [Google Scholar]
- 28. Marx MV, Niklason L, Mauger EA. . Occupational radiation exposure to interventional radiologists: a prospective study . J Vasc Interv Radiol 1992. ; 3 ( 4 ): 597 – 606 . [DOI] [PubMed] [Google Scholar]
- 29. Niklason LT, Marx MV, Chan HP. . Interventional radiologists: occupational radiation doses and risks . Radiology 1993. ; 187 ( 3 ): 729 – 733 . [DOI] [PubMed] [Google Scholar]
- 30. Sánchez RM, Vano E, Fernández JM, et al. Staff doses in interventional radiology: a national survey . J Vasc Interv Radiol 2012. ; 23 ( 11 ): 1496 – 1501 . [DOI] [PubMed] [Google Scholar]
- 31. O’Connor U, Walsh C, Gallagher A, et al. Occupational radiation dose to eyes from interventional radiology procedures in light of the new eye lens dose limit from the International Commission on Radiological Protection . Br J Radiol 2015. ; 88 ( 1049 ): 20140627 . [DOI] [PMC free article] [PubMed] [Google Scholar]
- 32. Domienik J, Brodecki M, Rusicka D. . A study of the dose distribution in the region of the eye lens and extremities for staff working in interventional cardiology . Radiat Meas 2012. ; 47 ( 2 ): 130 – 138 . [Google Scholar]
- 33. Haga Y, Chida K, Kaga Y, Sota M, Meguro T, Zuguchi M. . Occupational eye dose in interventional cardiology procedures . Sci Rep 2017. ; 7 ( 1 ): 569 . [DOI] [PMC free article] [PubMed] [Google Scholar]
- 34. National Council on Radiation Protection and Measurements . Ionizing Radiation Exposure of the Population of the United States. NCRP Report No.: 160 . Bethesda, Md: : National Council on Radiation Protection and Measurements; , 2009. . [Google Scholar]
- 35. Pekkarinen A, Siiskonen T, Lehtinen M, Savolainen S, Kortesniemi M. . Potential occupational exposures in diagnostic and interventional radiology: statistical modeling based on Finnish national dose registry data . Acta Radiol 2019. ; 60 ( 1 ): 68 – 77 . [DOI] [PubMed] [Google Scholar]
- 36. Szumska A, Budzanowski M, Kopeć R. . Occupational exposure to the whole body, extremities and to the eye lens in interventional radiology in Poland, as based on personnel dosimetry records at IFJ PAN . Radiat Phys Chem 2014. ; 104 : 72 – 75 . [Google Scholar]
Associated Data
This section collects any data citations, data availability statements, or supplementary materials included in this article.


