

Abstract
Background
Signal contamination from long T2 water is a major challenge in direct imaging of myelin with MRI. Nulling of the unwanted long T2 signals can be achieved with an inversion recovery (IR) preparation pulse to null long T2 white matter within the brain. The remaining ultrashort T2 signal from myelin can be detected with an ultrashort echo time (UTE) sequence.
Purpose
To develop patient-specific whole-brain myelin imaging with a three-dimensional double-echo sliding inversion recovery (DESIRE) UTE sequence.
Materials and Methods
The DESIRE UTE sequence generates a series of IR images with different inversion times during a single scan. The optimal inversion time for nulling long T2 signal is determined by finding minimal signal on the second echo. Myelin images are generated by subtracting the second echo image from the first UTE image. To validate this method, a prospective study was performed in phantoms, cadaveric brain specimens, healthy volunteers, and patients with multiple sclerosis (MS). A total of 20 healthy volunteers (mean age, 40 years ± 13 [standard deviation], 10 women) and 20 patients with MS (mean age, 58 years ± 8; 15 women) who underwent MRI between November 2017 and February 2019 were prospectively included. Analysis of variance was performed to evaluate the signal difference between MS lesions and normal-appearing white matter in patients with MS.
Results
High signal intensity and corresponding T2* and T1 of the extracted myelin vesicles provided evidence for direct imaging of ultrashort-T2 myelin protons using the UTE sequence. Gadobenate dimeglumine phantoms with a wide range of T1 values were selectively suppressed with DESIRE UTE. In the ex vivo brain study of MS lesions, signal loss was observed in MS lesions and was conformed with histologic analysis. In the human study, there was a significant reduction in normalized signal intensity in MS lesions compared with that in normal-appearing white matter (0.19 ± 0.10 vs 0.76 ± 0.11, respectively; P < .001).
Conclusion
The double-echo sliding inversion recovery ultrashort echo time sequence can generate whole-brain myelin images specifically with a clinical 3-T scanner.
© RSNA, 2019
Online supplemental material is available for this article.
See also the editorial by Port in this issue.

Summary
Three-dimensional double-echo sliding inversion recovery ultrashort echo time MRI enabled robust direct imaging of myelin confirmed via phantom, ex vivo, and in vivo studies; obvious myelin signal loss was seen in multiple sclerosis lesions.
Key Results
■ Three-dimensional double-echo sliding inversion recovery ultrashort echo time MRI yielded robust long T2 white matter signal suppression by using a range of inversion times to null signal from tissue components with different T1 values, coupled with early detection of short T2 signals to enable direct visualization of myelin in the brain.
■ In ex vivo brain myelin imaging, signal loss was seen in multiple sclerosis (MS) lesions and was associated with myelin loss seen at histology.
■ In patients, a reduction in normalized myelin image signal intensity was seen in MS lesions when compared with normal-appearing white matter (0.19 vs 0.76, P < .001).
Introduction
Loss of myelin is a hallmark of numerous inflammatory and neurodegenerative disorders of the central nervous system, including multiple sclerosis (MS), in which characteristic foci of demyelination are seen. These are associated with a variety of neurologic and neuropsychological problems (1). Direct in vivo evaluation of myelin could be of major importance in the recognition and characterization of demyelination and subsequent remyelination, both spontaneously and in response to treatment in patients with MS or other diseases (2).
Although MRI is widely used in the noninvasive evaluation of MS (3,4), direct imaging of myelin with this technique has proven difficult due to the ultrashort T2 (T2 <1 msec) of myelin lipids and proteins (5–7). The usual clinical approach uses T1- or T2-weighted fast spin-echo or gradient-echo sequences, which only depict the longer T2 components in white and gray matter. The changes seen with these sequences are not specific to myelin, and there is substantial overlap between the MRI appearance of abnormalities in demyelinating diseases and those seen in other diseases of the central nervous system (2). Magnetization transfer imaging has been investigated as a method to show changes in myelin (8), but a recent large-scale multicenter study reported poor correlation between disability assessed with the expanded disability status scale and the magnetization transfer ratio of brain tissue (r = −0.16) in MS (9). In recent years, several other techniques have been developed to achieve more specific imaging of myelin in patients with MS, including multicomponent T2 analysis (10), multicomponent-driven equilibrium single-component observation of T1 and T2, or mcDESPOT, (11), and myelin-specific imaging (12). However, these techniques all use conventional sequences with echo times of several milliseconds or more. These can be used to detect signal from water associated with myelin that has T2* values of 5 msec or longer (13), but they cannot be used to detect significant signal from myelin protons that have much shorter T2* values that are less than 1 msec (5–7). Ultrashort echo time (UTE) MRI sequences with echo times 100–1000 times shorter than those of conventional sequences can be used to directly detect signal from myelin protons; thus, they could enable a more specific evaluation of the changes in myelin that occur in demyelination and remyelination (5–7).
Two-dimensional adiabatic inversion recovery UTE MRI sequences have been developed to enable direct detection of myelin protons in white matter with clinical MRI scanners (5,14–17). The inversion recovery preparation suppresses signal from the long T2 components in white matter (WML, mainly water) by inverting and nulling their longitudinal magnetization using an appropriate inversion time. The longitudinal magnetization of myelin is not inverted using conventional MRI due to its extremely short T2. Instead, it is partially saturated; however, it can be detected with subsequent use of UTE data acquisition. An accurate inversion time is critical for nulling the signal from WML because its signal may be 10 or more times greater than that from myelin. Slightly longer or shorter inversion times than the optimum for nulling may lead to water signal contamination and may compromise the accuracy and specificity of myelin imaging. However, the optimal nulling point (TInull) for WML may be difficult to determine. The T1 of normal WML varies in different regions of the brain and between individuals (18,19). A wide range of T1 values (ie, 690–1100 msec) have been reported for white matter at 3 T (20,21). In addition, the T1 of WML may change in patients with overt disease and those with occult disease within normal-appearing white matter. T1 measurement is time consuming, which is a limitation in clinical applications. In addition, the commonly used two-dimensional inversion recovery UTE sequence is sensitive to eddy currents and suffers from out-of-slice signal excitation, especially in off-center slices. Furthermore, two-dimensional techniques of this type cannot easily be used to perform single-acquisition whole-brain imaging (15,22).
To address these limitations, we have developed a three-dimensional (3D) double-echo sliding inversion recovery (DESIRE) UTE sequence, which provides nulling that accommodates the differences in the T1 of long T2 white matter seen between human participants. In a single scan, this technique yields a series of images with a wide range of equally spaced inversion times covering all likely nulling points for WML due to normal variation with age or sex and disease. As a result, the 3D DESIRE UTE sequence can yield robust suppression of WML and therefore can enable more specific and accurate imaging of myelin. To validate this technique for whole-brain myelin imaging with a clinical 3-T scanner, we performed studies using phantoms, cadaveric brain specimens, healthy volunteers, and patients with multiple sclerosis.
Materials and Methods
We received local institutional review board approval for this prospective study, and written informed consent was obtained from all participants.
All MRI examinations were performed with a 3-T clinical scanner (MR750; GE Healthcare Technologies, Milwaukee, Wis). A 12-channel receive-only head coil was used for signal reception. A myelin phantom study was designed to validate the signal source in 3D DESIRE UTE imaging, and a water phantom with different T1 values was used to assess the efficiency of water signal suppression. This was followed by ex vivo and in vivo brain studies.
Phantom Preparation
Extracted myelin from the porcine brain was used to validate direct imaging of myelin using UTE sequences. White matter isolated from the porcine brain was mechanically homogenized with a Dounce homogenizer (Thomas Scientific, Swedesboro, NJ). Myelin vesicles were purified by using discontinuous sucrose gradient ultracentrifugation and osmotic shocking according to published methods (23), with the procedure repeated three times to achieve a high degree of purity. After thoroughly washing out any residual sucrose, the myelin vesicles were resuspended twice in a deuterated hydroxymethyl aminomethane hydrochloride buffer to remove residual water (Fig E1 [online]) and then placed in a 1.0-mL syringe.
To test the effectiveness of the DESIRE sequence for suppressing water signals, six myelin and water phantoms with different T1 values were prepared. These phantoms were doped with gadobenate dimeglumine (MultiHance; Spectrum Chemical, Los Angeles, Calif) at concentrations of 0.075, 0.125, 0.175, 0.225, 0.275, and 0.325 mmol/L. The six phantoms were then placed in parallel in a cylindrical container filled with 1% agarose gel; in effect, this created a seventh control phantom without gadobenate dimeglumine.
Cadaveric Human Brain Study
Four cadaveric human heads from four donors (two healthy donors, an 82-year-old man and an 87-year-old woman; two donors with MS, a 45-year-old man and a 56-year-old woman) were obtained from a nonprofit whole-body donation company (United Tissue Network, Phoenix, Ariz). The cadaveric heads were fresh frozen and had been stored in a freezer at −80°C. Each specimen was placed in a 4°C refrigerator for 12 hours then removed and stored at room temperature for 24 hours to thaw before the MRI studies. After imaging, each specimen was refrozen at −80°C and cut into 1-cm axial sections. Biopsies were performed in regions of interest identified at image review, and tissue samples were fixed in zinc formalin (Anatech, Battle Creek, Mich) for 1 week. After paraffin embedding, 5-μm sections were cut and stained overnight in alcoholic 0.1% Luxol fast blue at 60°C, counterstained with neutral red, dehydrated, and mounted (Permount; Fisher Scientific, Pittsburgh, Pa).
In Vivo Brain Study
A total of 20 healthy volunteers and 20 patients with MS were scanned between November 2017 and February 2019.
MRI Protocol
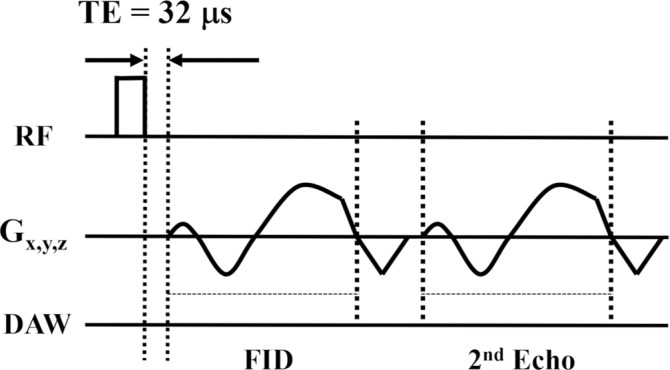
A 3D adiabatic inversion recovery–prepared UTE-Cones sequence was used in this study (Fig 1) (24,25). The adiabatic inversion pulse (Silver-Hoult sequence; duration, 6.048 msec; bandwidth, 1.643 kHz; maximum B1 amplitude, 17 µT) can be used to uniformly invert the longitudinal magnetizations of long T2 components in both white matter and gray matter and is insensitive to B1 inhomogeneity (Fig 1a) (26). The longitudinal magnetization of myelin with its extremely short T2* of approximately 0.3 msec is not inverted by this pulse but is partially saturated. At inversion time, a train of dual-echo (UTE and gradient-echo) Cones spokes (total number of spokes, Nsp) are used for data acquisition. In each spoke, the UTE data acquisition starts as soon as possible after the radiofrequency excitation, with a minimal nominal echo time of 32 µsec (Fig 1b).
Figure 1a:
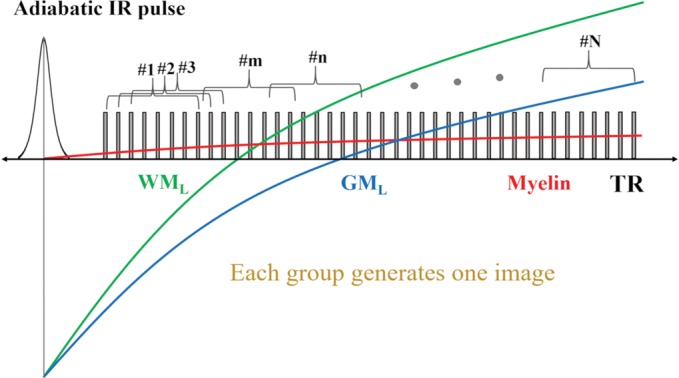
Three-dimensional DESIRE (double-echo sliding inversion recovery) ultrashort echo time (UTE) sequence. (a) This sequence uses an adiabatic inversion pulse for selective long T2 signal suppression followed by a train of data acquisition spokes. (b) In each spoke, a short rectangular pulse is used for signal excitation, followed by dual-echo spiral sampling with a minimal nominal echo time of 32 µsec. After the inversion recovery (IR) pulse, the magnetizations of long T2 components in white matter (WML) and gray matter (GML) are inverted and recover via longitudinal relaxation. However, myelin magnetization is partially saturated by the relatively long adiabatic IR pulse because of its extremely short T2. It recovers during inversion time. To obtain images with inversion times at or close to the signal nulling points of long T2 components, a sliding-window technique is used to generate a series of images with gradually increasing inversion times. Spokes within a window with a size of Nw are used to generate one image. The window starts at the beginning and slides forward one spoke each time, thus generating a new image. The total number of images is equal to Nsp−Nw + 1, where Nsp is the number of spokes and Nw is the window size. (c) All spokes are randomly ordered for data sampling to ensure each group of spokes is uniformly distributed in k-space. The k-space trajectory has been normalized from −1 to 1 for all axes. DAW = data acquisition window, FID = free induction decay, Gx,y,z = gradients in x, y, and z axes, RF = radiofrequency, TE = echo time, TR = repetition time.
Figure 1b:
Three-dimensional DESIRE (double-echo sliding inversion recovery) ultrashort echo time (UTE) sequence. (a) This sequence uses an adiabatic inversion pulse for selective long T2 signal suppression followed by a train of data acquisition spokes. (b) In each spoke, a short rectangular pulse is used for signal excitation, followed by dual-echo spiral sampling with a minimal nominal echo time of 32 µsec. After the inversion recovery (IR) pulse, the magnetizations of long T2 components in white matter (WML) and gray matter (GML) are inverted and recover via longitudinal relaxation. However, myelin magnetization is partially saturated by the relatively long adiabatic IR pulse because of its extremely short T2. It recovers during inversion time. To obtain images with inversion times at or close to the signal nulling points of long T2 components, a sliding-window technique is used to generate a series of images with gradually increasing inversion times. Spokes within a window with a size of Nw are used to generate one image. The window starts at the beginning and slides forward one spoke each time, thus generating a new image. The total number of images is equal to Nsp−Nw + 1, where Nsp is the number of spokes and Nw is the window size. (c) All spokes are randomly ordered for data sampling to ensure each group of spokes is uniformly distributed in k-space. The k-space trajectory has been normalized from −1 to 1 for all axes. DAW = data acquisition window, FID = free induction decay, Gx,y,z = gradients in x, y, and z axes, RF = radiofrequency, TE = echo time, TR = repetition time.
When UTE acquisitions start at the TInull of WML, the myelin signal in white matter is selectively detected and further highlighted by the echo subtraction (second echo from the first), which reduces the residual signal from gray matter. To find TInull, a series of images with different TIs are generated with the DESIRE UTE sequence. Acquisition spokes are grouped in a window with a fixed size of Nw, and these spokes are subsequently used to generate an image (Fig 1a). The window starts sliding after the very first Nw spokes with the shortest inversion time, then slides one spoke at a time to generate a new image with a slightly longer inversion time. The total number of groups or images is equal to Nsp − Nw + 1. With this sliding window technique, a series of images with different T1-dependent contrasts is generated. Individual images can then be used to determine the inversion time that best nulls WML. This TInull is found when the signal in white matter in the second echo image reaches a minimum (the noise level). This is where the WML signal is nulled and the short T2 myelin signal has fully decayed. Different subjects may have different TInull values due to the T1 variations among volunteers and patients.
Five different windows (Nw = 10, 20, 30, 40, and 50) were used to investigate whether different windows would affect the optimal TInull for WML and thus the effectiveness of myelin imaging.
We used random view ordering with a bit-reversed algorithm for data sampling. With this method, groups of spokes in the same window were randomly distributed in the k-space (Fig 1c); this ordering can be effectively reconstructed by using combined parallel imaging with compressed sensing (PI-CS) reconstruction.
Figure 1c:

Three-dimensional DESIRE (double-echo sliding inversion recovery) ultrashort echo time (UTE) sequence. (a) This sequence uses an adiabatic inversion pulse for selective long T2 signal suppression followed by a train of data acquisition spokes. (b) In each spoke, a short rectangular pulse is used for signal excitation, followed by dual-echo spiral sampling with a minimal nominal echo time of 32 µsec. After the inversion recovery (IR) pulse, the magnetizations of long T2 components in white matter (WML) and gray matter (GML) are inverted and recover via longitudinal relaxation. However, myelin magnetization is partially saturated by the relatively long adiabatic IR pulse because of its extremely short T2. It recovers during inversion time. To obtain images with inversion times at or close to the signal nulling points of long T2 components, a sliding-window technique is used to generate a series of images with gradually increasing inversion times. Spokes within a window with a size of Nw are used to generate one image. The window starts at the beginning and slides forward one spoke each time, thus generating a new image. The total number of images is equal to Nsp−Nw + 1, where Nsp is the number of spokes and Nw is the window size. (c) All spokes are randomly ordered for data sampling to ensure each group of spokes is uniformly distributed in k-space. The k-space trajectory has been normalized from −1 to 1 for all axes. DAW = data acquisition window, FID = free induction decay, Gx,y,z = gradients in x, y, and z axes, RF = radiofrequency, TE = echo time, TR = repetition time.
The sequence parameters for the phantom study and ex vivo and in vivo (in healthy volunteers and patients with MS) brain studies are shown in the Table. The total scanning time for the DESIRE UTE sequence in the in vivo study was 10 minutes.
Sequence Parameters for the Phantom and ex Vivo and in Vivo Brain Studies
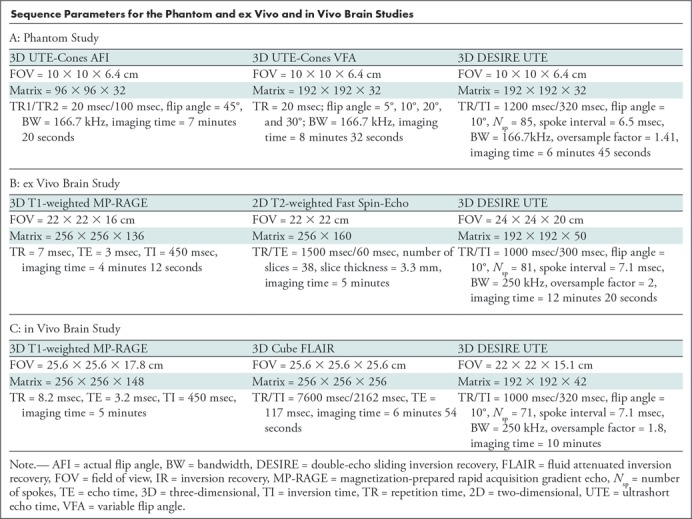
Image Reconstruction
Each group of raw data was reconstructed independently with PI-CS. The sensitivity encoding–based PI and CS are incorporated into a single optimization framework (27,28):
 |
where
f is the unknown vector defining the desired 3D
full–field-of-view image to be computed; E is the
encoding matrix, which includes both regridding and sensitivity-encoding
operators; d is the vector-formed k-space data from all receive
channels;  is a wavelet
transform;
is a wavelet
transform;  is the
l1 norm;
is the
l1 norm;  is the
l2 norm; and
is the
l2 norm; and  is the total variation term;
λ and α are the two regularization parameters used to control the
weights of l1 and the total variation terms,
respectively.
is the total variation term;
λ and α are the two regularization parameters used to control the
weights of l1 and the total variation terms,
respectively.
The coil sensitivities are derived by dividing highly smoothed images from all the channels by their sum-of-squares combination. The images used to calculate coil sensitivity are obtained from the final group of spokes with the longest inversion time.
Regridded images were used as the initial image f estimation in the PI-CS computation. We set λ and α to the same value, which was equal to a constant C multiplying the maximum value of the initial images after regridding. The constant C was experimentally determined by solving the Equation with different C values and choosing one so that Ef − d2 < 0.2 (27,28). We found that good imaging quality (a relatively high signal-to-noise ratio [SNR] with no apparent artifact and preservation of image detail) could be achieved with C of 0.004 for all the data.
In-house implementation of PI-CS reconstruction was written in Matlab 2016b (MathWorks, Natick, Mass) at a workstation with an Intel i7–4790 CPU, 3.6-GHz processor base frequency, and 32-GB RAM. A 3D nonuniform fast-Fourier transform Compute Unified Device Architecture, or CUDA, implementation with Matlab mex interface was used for fast 3D regridding (29).
Statistical Analysis
The contrast-to-noise ratios between MS lesions and normal white matter were calculated as their signal difference divided by background noise. Mean ± standard deviation for the contrast-to-noise ratios was reported. The measured signal intensities from the DESIRE UTE myelin images were normalized using the equation Sn = (S-Smin)/(Smax-Smin) before statistical analysis. S, Smin, Smax, and Sn are measured signal intensity, minimal signal intensity, maximal signal intensity, and normalized signal intensity, respectively. Analysis of variance was performed to evaluate the signal difference between MS lesions and normal-appearing white matter. All data processing was performed with in-house code written in Matlab.
Results
Phantom Studies
In the myelin phantom, 3D UTE images showed high signal from the intact myelin vesicles, which had a short T1 of 367 msec ± 4 (mean ± standard deviation) and a T2* of 225 µsec ± 7 (Fig E2 [online]).
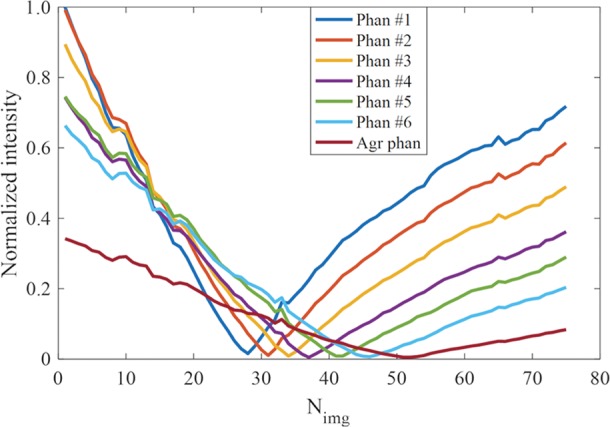
As mentioned previously, a major challenge for direct imaging of myelin in vivo is the high signal from WML. Figure 2 shows that the DESIRE UTE sequence can be used to null signals from gadobenate dimeglumine–doped water containing agarose gel phantoms with T1 values of 513, 565, 678, 854, 1069, 1484, and 2880 msec, as measured with a 3D UTE actual flip angle and variable flip angle technique (30,31). Seventy-six images with different inversion times were generated from a single DESIRE UTE data acquisition. The signal intensity changes with inversion time for each phantom are shown in Figure 2b. The optimal TInull for each phantom is found at the lowest point of each signal intensity curve, and, as expected, the longer the T1, the longer the optimal TInull. Thus, one DESIRE UTE acquisition can generate images, with at least one of them showing near-perfect nulling despite their very different T1 values. The reconstructed image numbers (Nimgs) range from 1 to 74 depending on their inversion time. The Nimgs for nulling are listed here and are shown in Figure 2c (phantom 1, Nimg = 28; phantom 2, Nimg = 31; phantom 3, Nimg = 34; phantom 4, Nimg = 37; phantom 5, Nimg = 41; phantom 6, Nimg = 46; and agarose phantom, Nimg = 51).
Figure 2a:
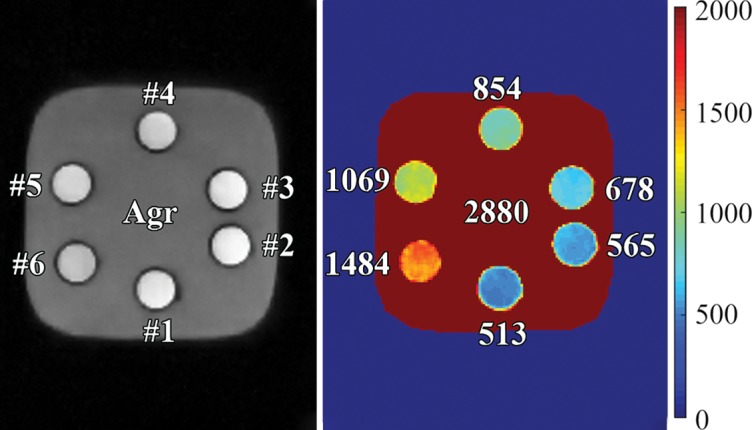
Three-dimensional (3D) double-echo sliding inversion recovery (DESIRE) ultrashort echo time (UTE) imaging of gadobenate dimeglumine phantoms. (a) The gray scale of the left image was adjusted to show image details. The T1s of the six water phantoms doped with different concentrations of gadobenate dimeglumine and agarose gel (Agr) were 513, 565, 678, 854, 1069, 1484, and 2880 msec, respectively, as measured with the 3D UTE-Cones actual flip angle and variable flip angle methods. The unit for the color legend is milliseconds. (b) Signal curves of the 76 images obtained with the sliding-window method for all phantoms. (c) DESIRE UTE images were reconstructed at the optimal nulling point for each phantom. Nimg = image number.
Figure 2b:
Three-dimensional (3D) double-echo sliding inversion recovery (DESIRE) ultrashort echo time (UTE) imaging of gadobenate dimeglumine phantoms. (a) The gray scale of the left image was adjusted to show image details. The T1s of the six water phantoms doped with different concentrations of gadobenate dimeglumine and agarose gel (Agr) were 513, 565, 678, 854, 1069, 1484, and 2880 msec, respectively, as measured with the 3D UTE-Cones actual flip angle and variable flip angle methods. The unit for the color legend is milliseconds. (b) Signal curves of the 76 images obtained with the sliding-window method for all phantoms. (c) DESIRE UTE images were reconstructed at the optimal nulling point for each phantom. Nimg = image number.
Figure 2c:

Three-dimensional (3D) double-echo sliding inversion recovery (DESIRE) ultrashort echo time (UTE) imaging of gadobenate dimeglumine phantoms. (a) The gray scale of the left image was adjusted to show image details. The T1s of the six water phantoms doped with different concentrations of gadobenate dimeglumine and agarose gel (Agr) were 513, 565, 678, 854, 1069, 1484, and 2880 msec, respectively, as measured with the 3D UTE-Cones actual flip angle and variable flip angle methods. The unit for the color legend is milliseconds. (b) Signal curves of the 76 images obtained with the sliding-window method for all phantoms. (c) DESIRE UTE images were reconstructed at the optimal nulling point for each phantom. Nimg = image number.
Human Studies
A total of 20 healthy volunteers (mean age, 40 years ± 13; 10 women) and 20 patients with MS (mean age, 58 years ± 8; 15 women) were recruited. Figure 3a shows representative DESIRE UTE images corresponding to five different inversion times (Nimg 4, 18, 27, 36, and 60) from a total of 61 inversion times and demonstrates variation in image contrast with inversion time in one brain scan. The corresponding dual-echo images reconstructed with PI-CS are shown in Figure 3b (27,32). Differences in T1-dependent contrast are seen in the five dual-echo images: In Nimg 4, white and gray matter have similar signal intensities. In Nimg 18, white matter signal intensity is lower than gray matter signal intensity. Nimg 27 is close to the nulling point of WML and highlights gray matter. Nimg is close to the nulling point of long T2 components in gray matter (GML) and highlights white matter. In Nimg 60, white matter has a higher signal intensity than gray matter. Signal intensity and contrast differences between the two different echo time images at the same inversion time mainly result from differences in T2-dependent signal decay after excitation and before acquisition of the second echo time image. Ultrashort T2 signals (from myelin protons) in the first echo image are always positive because their signals recover quickly starting immediately after the adiabatic inversion recovery pulse, which saturates rather than inverts the longitudinal magnetization. However, WML or GML signals are inverted by the inversion recovery pulse, and the MRI signal subsequently detected from them is negative at short inversion times (ie, before Nimg 27 for WML or before Nimg 36 for GML, respectively). In this situation, white matter and gray matter signals in the second echo image are higher than those in the first echo image, as seen in Nimg 18. After Nimg 36, both WML and GML signals are positive. Thus, as shown in image 60, the first echo image has a higher signal intensity than the second echo image because of the additive positive myelin and water signals in the first echo. For image 27, the WML signal is almost nulled, as demonstrated by the near-zero signal for WML in the second echo image. The first echo image mainly shows the short T2 myelin signal in white matter. If echo subtraction is performed as for image 27 (ie, UTE1–TE2), myelin signals in white matter are highlighted because the signal in white matter is positive, while the signal in gray matter is negative.
Figure 3a:

Three-dimensional double-echo sliding inversion recovery ultrashort echo time brain imaging in a representative healthy 37-year-old male volunteer. (a) Five different time points (4, 18, 27, 36, and 60) were selected from a total of 61 time points to demonstrate variation in image contrast. (b) The corresponding dual-echo images were reconstructed by using parallel imaging–compressed sensing reconstruction. Contrast changes can be seen clearly in these five dual-echo images. IR = inversion recovery, TR = repetition time.
Figure 3b:

Three-dimensional double-echo sliding inversion recovery ultrashort echo time brain imaging in a representative healthy 37-year-old male volunteer. (a) Five different time points (4, 18, 27, 36, and 60) were selected from a total of 61 time points to demonstrate variation in image contrast. (b) The corresponding dual-echo images were reconstructed by using parallel imaging–compressed sensing reconstruction. Contrast changes can be seen clearly in these five dual-echo images. IR = inversion recovery, TR = repetition time.
The normalized signal intensity curves for a region of interest drawn in a white matter region are displayed for the first and second echo images (Fig 4a, 4b). The TInull for WML can be determined accurately by choosing the signal nulling point for the second echo (Nimg 26), as shown by the arrow in Figure 3a. Figure 3b shows the dual-echo images and the corresponding subtraction images close to the WML nulling point. The highest myelin contrast with the most complete water suppression was achieved for Nimg 26. Lower myelin signal was observed with a shorter inversion time (Nimg <26) because of the cancelation of positive magnetization from myelin and negative magnetization from WML. Higher myelin signal was observed with a longer inversion time (Nimg >26) because of the residual positive magnetization from WML, which adds to that of myelin, leading to a higher signal level.
Figure 4a:
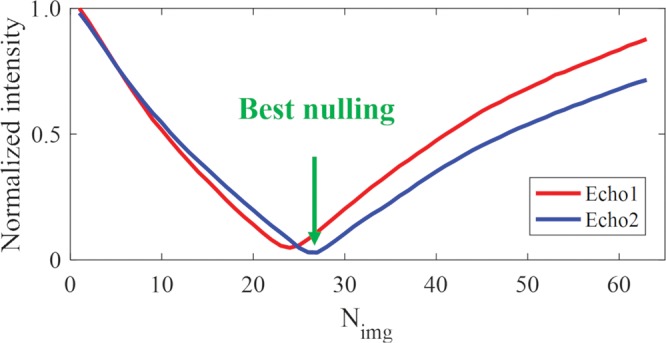
Three-dimensional double-echo sliding inversion recovery ultrashort echo time brain MRI with inversion times close to the long T2 components in white matter (WML) nulling point (TInull). (a) Normalized signal intensity curves for a region of interest in a white matter region (yellow circle in b) for the first (Echo 1, echo time = 0.032 msec) and second (Echo 2, echo time = 2.2 msec) echo images. TInull for WML corresponds to the signal TInull for Echo 2 (arrow). (b) Dual-echo images and corresponding subtraction images close to TInull for WML. Myelin images are obtained by subtracting the first echo from the second echo, Nimg = image number.
Figure 4b:

Three-dimensional double-echo sliding inversion recovery ultrashort echo time brain MRI with inversion times close to the long T2 components in white matter (WML) nulling point (TInull). (a) Normalized signal intensity curves for a region of interest in a white matter region (yellow circle in b) for the first (Echo 1, echo time = 0.032 msec) and second (Echo 2, echo time = 2.2 msec) echo images. TInull for WML corresponds to the signal TInull for Echo 2 (arrow). (b) Dual-echo images and corresponding subtraction images close to TInull for WML. Myelin images are obtained by subtracting the first echo from the second echo, Nimg = image number.
Images at the optimal nulling point for all five different window sizes (Nw = 10, 20, 30, 40, and 60) are shown in Figure E3 (online). As can be seen, white matter signal in the second echo was almost completely nulled with all five window sizes, and the corresponding subtraction images all show high myelin contrast. This result shows that an optimal TInull can be found for each of the different window sizes (ie, TInull can be adjusted so that long T2 water magnetizations acquired before TInull cancels that acquired after TInull, leading to efficient water signal suppression). The SNR of myelin images increased from 9.4 for a window size of 10 to 16.4 for a window size of 40 and then dropped slightly to 15.6 for a window size of 50. The higher SNR with increased window size (from 10 to 40) is reasonable since more data are used for reconstruction. On the other hand, if window size is too large, there is more signal variation between the spokes (a large window size means more negative long T2 water magnetizations for spokes acquired before TInull and more positive long T2 water magnetizations for spokes acquired after TInull), which may lead to increased image artifacts and pseudonoise (and thus a decrease in SNR). The SNR of the myelin image with window size of 50 was slightly decreased, which suggested the existence of signal fluctuations even though there were no apparent artifacts (the PI-CS reconstruction framework helps in reducing these artifacts). As a result, a window size of less than 40 was preferred with the current DESIRE UTE protocol. In this study, a fixed window (Nw = 30) was used for all patient data reconstruction. It yielded reasonable image SNR without apparent image artifacts. With the fixed window, the myelin images could be obtained at the optimal nulling point in all patients. Representative whole-brain myelin images in a healthy volunteer with a window size of 30 are shown in Figure 5. The TInull used in volunteers and patients ranged from 309 msec to 324 msec.
Figure 5:

Selected whole-brain myelin images generated with double-echo sliding inversion recovery ultrashort echo time imaging with a window of 30 and image number 17.
Figure 6 shows four representative imaging slices obtained from the brain of an individual with MS by using DESIRE UTE and clinical T1- and T2-weighted sequences. MS lesions identified on the clinical images are clearly depicted on the 3D DESIRE UTE images and are shown as areas of signal reduction corresponding to loss of myelin as subsequently found at histology. Similar findings were observed in all the other MS brain specimens.
Figure 6a:

Ex vivo images of the brain in a 45-year-old man with multiple sclerosis (MS). (a) MS lesions (arrows and circles) on clinical T1-weighted (T1w) magnetization-prepared rapid acquisition gradient-echo (repetition time msec/echo time msec, 7/3) (top row) and T2-weighted (T2w) fast spin-echo (1500/60) (middle row) images are shown as signal voids on three-dimensional double-echo sliding inversion recovery (DESIRE) ultrashort echo time images (bottom row), corresponding to marked myelin loss. Note the location of the lesion sampled for histologic analysis (arrowheads). (b) The 5-μm sections of the brain sample were cut and stained overnight in alcoholic 0.1% Luxol fast blue at 60°C and were counterstained with neutral red, dehydrated, and mounted. Histologic analysis of normal-appearing white matter (top), lesion edge (middle), and lesion (bottom) show specific loss of myelin staining in the MS lesion.
Figure 6b:
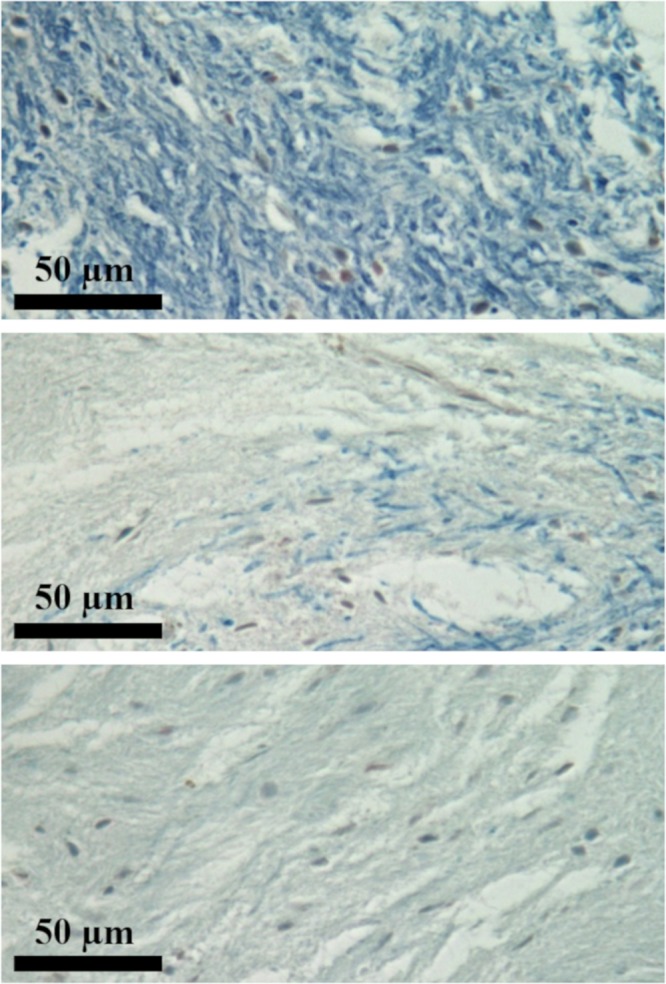
Ex vivo images of the brain in a 45-year-old man with multiple sclerosis (MS). (a) MS lesions (arrows and circles) on clinical T1-weighted (T1w) magnetization-prepared rapid acquisition gradient-echo (repetition time msec/echo time msec, 7/3) (top row) and T2-weighted (T2w) fast spin-echo (1500/60) (middle row) images are shown as signal voids on three-dimensional double-echo sliding inversion recovery (DESIRE) ultrashort echo time images (bottom row), corresponding to marked myelin loss. Note the location of the lesion sampled for histologic analysis (arrowheads). (b) The 5-μm sections of the brain sample were cut and stained overnight in alcoholic 0.1% Luxol fast blue at 60°C and were counterstained with neutral red, dehydrated, and mounted. Histologic analysis of normal-appearing white matter (top), lesion edge (middle), and lesion (bottom) show specific loss of myelin staining in the MS lesion.
As with the MS brain specimen study, myelin loss in patients was identified on DESIRE UTE images in MS lesions shown with clinical T1- and T2-weighted sequences (Figs 7, 8). The mean contrast-to-noise ratios between lesions and normal-appearing white matter measured for representative patients in Figures 7 and 8 were 15.8 ± 2.2 and 15.2 ± 1.9, respectively. In all the patients involved in this study, there were significant differences in the normalized signal intensities between MS lesions (0.19 ± 0.10) and normal-appearing white matter (0.76 ± 0.11) with a P value less than .001. This result demonstrated the clinical feasibility of the 3D DESIRE UTE technique for volumetric imaging of myelin in the brain.
Figure 7:

Images in the top, middle, and bottom rows are from different brain sites in a 59-year-old woman with multiple sclerosis (MS). MS lesions (arrows and circles) on the clinical T1-weighted (T1w) magnetization-prepared rapid acquisition gradient-echo (repetition time msec/echo time msec, 8.2/3.2) (left) and T2-weighted (T2w) fluid-attenuated inversion recovery (7600/117) (middle) images are shown as signal voids, corresponding to marked myelin loss on the three-dimensional double-echo sliding inversion recovery (DESIRE) ultrashort echo time images (right).
Figure 8:

Images in the top and bottom rows are from different brain sites in a 45-year-old woman with multiple sclerosis (MS). MS lesions (arrows and circles) on the clinical T1-weighted (T1w) magnetization-prepared rapid acquisition gradient-echo (repetition time msec/echo time msec, 8.2/3.2) (left) and T2-weighted (T2w) fluid-attenuated inversion recovery (7600/117) (middle) images are shown as signal voids, corresponding to marked myelin loss on the three-dimensional double-echo sliding inversion recovery (DESIRE) ultrashort echo time images (right).
Discussion
In this study, we have shown that the three-dimensional (3D) double-echo sliding inversion recovery (DESIRE) ultrashort echo time (UTE) sequence can generate patient-specific whole-brain myelin images using a clinical 3-T scanner. The high MRI signal from myelin vesicles extracted from the porcine brain provided evidence that myelin can be directly imaged with 3D UTE sequences. The DESIRE UTE method enables inversion and nulling of long T2 signals in white matter regardless of their variation in T1 and enables selective imaging of myelin in white matter of the brain. It avoids trying to preselect the correct inversion time for long T2 white matter nulling for each volunteer and patient. The water phantom study showed the robustness of signal nulling provided by this technique. The study of the cadaveric human brain in individuals who had multiple sclerosis (MS) further validated direct myelin imaging using the 3D DESIRE UTE sequence. Finally, the whole-brain myelin images in healthy volunteers and patients with MS showed reduction in mean normalized signal intensity in MS lesions compared with normal-appearing white matter (0.19 ± 0.10 vs 0.76 ± 0.11, P < .001). MRI showed obvious myelin loss in MS lesions identified with conventional clinical MRI sequences, as well as the feasibility and potential value of the 3D DESIRE UTE technique for volumetric imaging of myelin in vivo. The technique also has potential in diseases other than MS, as loss of myelin is also seen in numerous inflammatory and neurodegenerative disorders, including different forms of leukodystrophy (33).
We used a relatively low excitation flip angle of 10° to reduce the likelihood of contrast changes between adjacent DESIRE UTE images and to help achieve the best nulling point for selective myelin imaging. The contrast variation between adjacent DESIRE UTE images can also be reduced by using a shorter spoke interval. We used the shortest possible spoke intervals in the DESIRE UTE acquisitions. However, the degree to which spoke interval can be shortened is limited by echo spacing and the use of a dual-echo acquisition. To further reduce the spoke interval, an imaging system with a higher maximum gradient amplitude could be used. In addition, flexibility in setting the window size allows greater sharing of high-frequency projection data to improve myelin SNR while reducing streak artifacts.
The 3D DESIRE UTE technique provides a series of morphologic images with different T1-dependent contrast in a single scan compared with the single T1-dependent contrast obtained with conventional clinical T1- or PD-weighted MRI sequences. Moreover, we showed that whole-brain T1 mapping can be performed by fitting the second-echo images with a simple model, similar to the method described by Kecskemeti et al (34). Thus, in addition to whole-brain myelin imaging, the proposed 3D DESIRE UTE technique yields comprehensive morphologic images with different T1 weightings. It can also produce quantitative images, such as volumetric T1 maps, although more work still needs to be done to estimate the myelin T1 from the series of dual-echo DESIRE UTE images, including consideration of T2* decay of the short and long T2 components.
While we only investigated 3D DESIRE UTE Cones imaging, the DESIRE contrast mechanism could, in principle, be combined with other UTE imaging techniques, such as radial UTE, zero echo time, or ZTE, (35,36), and sweep imaging with Fourier transformation, or SWIFT, (37). Furthermore, the DESIRE technique may be combined with conventional gradient-echo or spin-echo acquisitions to yield images with selective nulling of tissues or tissue components with specific T1 values using a range of TI values.
There were several limitations to this study. First, the total data acquisition time for high-resolution volumetric myelin imaging is relatively long. Apparent motion artifacts were observed in four of 20 patients during scanning. Use of a dedicated head coil with more receive channels and higher SNR performance would permit greater undersampling and would reduce the total scan time and any patient discomfort associated with this technique. Second, for this study, we used a conventional hardware image processing workstation that required extensive data processing time (8 hours for one subject); use of a graphics processing unit–based PI-CS reconstruction or a more advanced workstation would greatly increase computational efficiency. Third, both regularization parameters used to control the weights of l1 and the total variation terms (λ and α, respectively) were experimentally determined similar to previous studies (27,28). A more comprehensive analysis (comparison between prepost SNR, image artifacts, and blurriness) would be warranted in future studies. Fourth, we are currently conducting a larger study to compare DESIRE UTE with conventional clinical sequences to detect lesions and monitor response to initiation of therapy in patients with MS. Results of this study will be reported. In this study, we only focused on morphologic detection of MS lesions. Quantitative developments and measurements will be conducted soon. Fifth, we did not seek to image myelin in gray matter in this study; a similar strategy to the one used here for white matter myelin imaging could be used for gray matter myelin imaging, although this would be more challenging because gray matter has a considerably lower myelin content than white matter. The technique could also be used for volumetric myelin imaging in the spinal cord and peripheral nervous system. Sixth, quantitative imaging of myelin, including T1, T2*, and myelin proton density mapping is still under development and will need validation. Lastly, no comparative study was performed to see if DESIRE UTE would provide different lesion findings in diseases without demyelination (eg, migraine) compared with MS (38). In the future, we will further develop quantitative DESIRE UTE techniques and apply them to different neurologic diseases to investigate the potential of the sequence to improve differential diagnosis.
In summary, the three-dimensional (3D) double-echo sliding inversion recovery (DESIRE) ultrashort echo time (UTE) sequence is a robust technique for accurate whole-brain myelin imaging, as demonstrated in studies of phantoms, brain specimens, volunteers, and patients with multiple sclerosis (MS). The extracted myelin vesicle study provides clear evidence that myelin can be directly imaged with UTE sequences using a clinical 3-T scanner, and the water phantom study showed that the long T2 signal suppression was effective for different T1 values. The studies of healthy volunteers and patients with MS demonstrate the potential of 3D DESIRE UTE in the morphologic evaluation of demyelination and remyelination in vivo. This may improve the accuracy of diagnosis and monitoring of disease progression and remission in patients with MS or other neurologic diseases.
SUPPLEMENTAL FIGURES
Supported by the National Institutes of Health (1R01 NS092650, T32 EB005970), VA Clinical Science and Rehabilitation Research and Development Services (I01CX001388, I01RX002604), and GE Healthcare.
Disclosures of Conflicts of Interest: Y.J.M. disclosed no relevant relationships. A.C.S. disclosed no relevant relationships. H.J. disclosed no relevant relationships. J.W. disclosed no relevant relationships. E.Y.C. disclosed no relevant relationships. J.C. disclosed no relevant relationships. G.M.B. disclosed no relevant relationships. J.D. disclosed no relevant relationships.
Abbreviations:
- DESIRE
- double-echo sliding inversion recovery
- GML
- long T2 components in gray matter
- MS
- multiple sclerosis
- Nimg
- image number
- PI-CS
- parallel imaging with compressed sensing
- SNR
- signal-to-noise ratio
- 3D
- three-dimensional
- TInull
- nulling point
- UTE
- ultrashort echo time
- WML
- long T2 components in white matter
References
- 1. Noseworthy JH, Lucchinetti C, Rodriguez M, Weinshenker BG. . Multiple sclerosis . N Engl J Med 2000. ; 343 ( 13 ): 938 – 952 . [DOI] [PubMed] [Google Scholar]
- 2. Brück W, Bitsch A, Kolenda H, Brück Y, Stiefel M, Lassmann H. . Inflammatory central nervous system demyelination: correlation of magnetic resonance imaging findings with lesion pathology . Ann Neurol 1997. ; 42 ( 5 ): 783 – 793 . [DOI] [PubMed] [Google Scholar]
- 3. Filippi M, Rocca MA. . MR imaging of multiple sclerosis . Radiology 2011. ; 259 ( 3 ): 659 – 681 . [DOI] [PubMed] [Google Scholar]
- 4. Laule C, Vavasour IM, Kolind SH, et al . Magnetic resonance imaging of myelin . Neurotherapeutics 2007. ; 4 ( 3 ): 460 – 484 . [DOI] [PMC free article] [PubMed] [Google Scholar]
- 5. Waldman A, Rees JH, Brock CS, Robson MD, Gatehouse PD, Bydder GM. . MRI of the brain with ultra-short echo-time pulse sequences . Neuroradiology 2003. ; 45 ( 12 ): 887 – 892 . [DOI] [PubMed] [Google Scholar]
- 6. Horch RA, Gore JC, Does MD. . Origins of the ultrashort-T2 1H NMR signals in myelinated nerve: a direct measure of myelin content? Magn Reson Med 2011. ; 66 ( 1 ): 24 – 31 . [DOI] [PMC free article] [PubMed] [Google Scholar]
- 7. Wilhelm MJ, Ong HH, Wehrli SL, et al . Direct magnetic resonance detection of myelin and prospects for quantitative imaging of myelin density . Proc Natl Acad Sci U S A 2012. ; 109 ( 24 ): 9605 – 9610 . [DOI] [PMC free article] [PubMed] [Google Scholar]
- 8. Stanisz GJ, Kecojevic A, Bronskill MJ, Henkelman RM. . Characterizing white matter with magnetization transfer and T(2) . Magn Reson Med 1999. ; 42 ( 6 ): 1128 – 1136 . [DOI] [PubMed] [Google Scholar]
- 9. Rovaris M, Judica E, Sastre-Garriga J, et al . Large-scale, multicentre, quantitative MRI study of brain and cord damage in primary progressive multiple sclerosis . Mult Scler 2008. ; 14 ( 4 ): 455 – 464 . [DOI] [PubMed] [Google Scholar]
- 10. MacKay A, Whittall K, Adler J, Li D, Paty D, Graeb D. . In vivo visualization of myelin water in brain by magnetic resonance . Magn Reson Med 1994. ; 31 ( 6 ): 673 – 677 . [DOI] [PubMed] [Google Scholar]
- 11. Deoni SCL, Rutt BK, Arun T, Pierpaoli C, Jones DK. . Gleaning multicomponent T1 and T2 information from steady-state imaging data . Magn Reson Med 2008. ; 60 ( 6 ): 1372 – 1387 . [DOI] [PubMed] [Google Scholar]
- 12. Alonso-Ortiz E, Levesque IR, Pike GB. . MRI-based myelin water imaging: A technical review . Magn Reson Med 2015. ; 73 ( 1 ): 70 – 81 . [DOI] [PubMed] [Google Scholar]
- 13. Hwang D, Kim DH, Du YP. . In vivo multi-slice mapping of myelin water content using T2* decay . Neuroimage 2010. ; 52 ( 1 ): 198 – 204 . [DOI] [PubMed] [Google Scholar]
- 14. Du J, Ma G, Li S, et al . Ultrashort echo time (UTE) magnetic resonance imaging of the short T2 components in white matter of the brain using a clinical 3T scanner . Neuroimage 2014. ; 87 ( Supplement C ): 32 – 41 . [DOI] [PMC free article] [PubMed] [Google Scholar]
- 15. Sheth V, Shao H, Chen J, et al . Magnetic resonance imaging of myelin using ultrashort Echo time (UTE) pulse sequences: Phantom, specimen, volunteer and multiple sclerosis patient studies . Neuroimage 2016. ; 136 : 37 – 44 . [DOI] [PMC free article] [PubMed] [Google Scholar]
- 16. Seifert AC, Li C, Wilhelm MJ, Wehrli SL, Wehrli FW. . Towards quantification of myelin by solid-state MRI of the lipid matrix protons . Neuroimage 2017. ; 163 : 358 – 367 . [DOI] [PMC free article] [PubMed] [Google Scholar]
- 17. Fan SJ, Ma Y, Zhu Y, et al . Yet more evidence that myelin protons can be directly imaged with UTE sequences on a clinical 3T scanner: Bicomponent T2* analysis of native and deuterated ovine brain specimens . Magn Reson Med 2018. ; 80 ( 2 ): 538 – 547 . [DOI] [PMC free article] [PubMed] [Google Scholar]
- 18. Suzuki S, Sakai O, Jara H. . Combined volumetric T1, T2 and secular-T2 quantitative MRI of the brain: age-related global changes (preliminary results) . Magn Reson Imaging 2006. ; 24 ( 7 ): 877 – 887 . [DOI] [PubMed] [Google Scholar]
- 19. Cheng HL, Stikov N, Ghugre NR, Wright GA. . Practical medical applications of quantitative MR relaxometry . J Magn Reson Imaging 2012. ; 36 ( 4 ): 805 – 824 . [DOI] [PubMed] [Google Scholar]
- 20. Rooney WD, Johnson G, Li X, et al . Magnetic field and tissue dependencies of human brain longitudinal 1H2O relaxation in vivo . Magn Reson Med 2007. ; 57 ( 2 ): 308 – 318 . [DOI] [PubMed] [Google Scholar]
- 21. Stikov N, Boudreau M, Levesque IR, Tardif CL, Barral JK, Pike GB. . On the accuracy of T1 mapping: searching for common ground . Magn Reson Med 2015. ; 73 ( 2 ): 514 – 522 . [DOI] [PubMed] [Google Scholar]
- 22. Robson MD, Gatehouse PD, Bydder M, Bydder GM. . Magnetic resonance: an introduction to ultrashort TE (UTE) imaging . J Comput Assist Tomogr 2003. ; 27 ( 6 ): 825 – 846 . [DOI] [PubMed] [Google Scholar]
- 23. Larocca JN, Norton WT. . Isolation of myelin . In: Current Protocols in Cell Biology . New Jersey: : John Wiley & Sons; , 2007. . [DOI] [PubMed] [Google Scholar]
- 24. Gurney PT, Hargreaves BA, Nishimura DG. . Design and analysis of a practical 3D cones trajectory . Magn Reson Med 2006. ; 55 ( 3 ): 575 – 582 . [DOI] [PubMed] [Google Scholar]
- 25. Carl M, Bydder GM, Du J. . UTE imaging with simultaneous water and fat signal suppression using a time-efficient multispoke inversion recovery pulse sequence . Magn Reson Med 2016. ; 76 ( 2 ): 577 – 582 . [DOI] [PMC free article] [PubMed] [Google Scholar]
- 26. Ma YJ, Zhu Y, Lu X, Carl M, Chang EY, Du J. . Short T2 imaging using a 3D double adiabatic inversion recovery prepared ultrashort echo time cones (3D DIR-UTE-Cones) sequence . Magn Reson Med 2018. ; 79 ( 5 ): 2555 – 2563 . [DOI] [PMC free article] [PubMed] [Google Scholar]
- 27. Lustig M, Donoho D, Pauly JM. . Sparse MRI: The application of compressed sensing for rapid MR imaging . Magn Reson Med 2007. ; 58 ( 6 ): 1182 – 1195 . [DOI] [PubMed] [Google Scholar]
- 28. Liang D, Liu B, Wang J, Ying L. . Accelerating SENSE using compressed sensing . Magn Reson Med 2009. ; 62 ( 6 ): 1574 – 1584 . [DOI] [PubMed] [Google Scholar]
- 29. Knoll F, Schwarzl A, Diwoky C, Sodickson DK. . gpuNUFFT - An Open Source GPU Library for 3D Regridding with Direct Matlab Interface [abstr] . In: Proceedings of the Twenty-Second Meeting of the International Society for Magnetic Resonance in Medicine . Berkeley, Calif: : International Society for Magnetic Resonance in Medicine; , 2014. ; 4297 . [Google Scholar]
- 30. Ma YJ, Lu X, Carl M, et al . Accurate T1 mapping of short T2 tissues using a three-dimensional ultrashort echo time cones actual flip angle imaging-variable repetition time (3D UTE-Cones AFI-VTR) method . Magn Reson Med 2018. ; 80 ( 2 ): 598 – 608 . [DOI] [PMC free article] [PubMed] [Google Scholar]
- 31. Ma YJ, Zhao W, Wan L, et al . Whole knee joint T1 values measured in vivo at 3T by combined 3D ultrashort echo time cones actual flip angle and variable flip angle methods . Magn Reson Med 2019. ; 81 ( 3 ): 1634 – 1644 . [DOI] [PMC free article] [PubMed] [Google Scholar]
- 32. Pruessmann KP, Weiger M, Scheidegger MB, Boesiger P. . SENSE: sensitivity encoding for fast MRI . Magn Reson Med 1999. ; 42 ( 5 ): 952 – 962 . [PubMed] [Google Scholar]
- 33. van der Knaap MS, Valk J. . Magnetic Resonance of Myelination and Myelin Disorders . 3rd ed. Berlin, Germany: : Springer-Verlag; , 2005. . [Google Scholar]
- 34. Kecskemeti S, Samsonov A, Hurley SA, Dean DC, Field A, Alexander AL. . MPnRAGE: A technique to simultaneously acquire hundreds of differently contrasted MPRAGE images with applications to quantitative T1 mapping . Magn Reson Med 2016. ; 75 ( 3 ): 1040 – 1053 . [DOI] [PMC free article] [PubMed] [Google Scholar]
- 35. Weiger M, Pruessmann KP, Hennel F. . MRI with zero echo time: hard versus sweep pulse excitation . Magn Reson Med 2011. ; 66 ( 2 ): 379 – 389 . [DOI] [PubMed] [Google Scholar]
- 36. Grodzki DM, Jakob PM, Heismann B. . Ultrashort echo time imaging using pointwise encoding time reduction with radial acquisition (PETRA) . Magn Reson Med 2012. ; 67 ( 2 ): 510 – 518 . [DOI] [PubMed] [Google Scholar]
- 37. Idiyatullin D, Corum C, Park JY, Garwood M. . Fast and quiet MRI using a swept radiofrequency . J Magn Reson 2006. ; 181 ( 2 ): 342 – 349 . [DOI] [PubMed] [Google Scholar]
- 38. Zheng Z, Xiao Z, Shi X, et al . White matter lesions in chronic migraine with medication overuse headache: a cross-sectional MRI study . J Neurol 2014. ; 261 ( 4 ): 784 – 790 . [DOI] [PubMed] [Google Scholar]
Associated Data
This section collects any data citations, data availability statements, or supplementary materials included in this article.