Abstract
Background
The value of native myocardial T1 mapping and extracellular volume (ECV) fraction in patients who have hypertrophic cardiomyopathy (HCM) but no late gadolinium enhancement (LGE) and no hemodynamic obstruction are currently unknown.
Purpose
To evaluate myocardial fibrosis in patients with nonobstructive HCM and no LGE by using native myocardial T1 mapping and ECV fraction and to study their relationships to left ventricular (LV) function and LV hypertrophy.
Materials and Methods
Patients with HCM who underwent cardiac MRI between 2012 and 2015 were retrospectively evaluated. Patients were included if they had no LGE at MRI, LV ejection fraction greater than or equal to 45%, and no LV outflow tract obstruction. Healthy participants had similar age and sex distribution. Native myocardial T1 and ECV were measured with MRI.
Results
A total of 258 patients with HCM (mean age ± standard deviation, 49 years ± 15; 74% men) and 122 healthy participants (mean age, 50 years ± 14; 76% men) were evaluated. Native myocardial T1 was longer and ECV fraction was higher in the patients with HCM relative to the healthy participants (mean native T1, 950 msec ± 48 vs 913 msec ± 46; mean ECV, 24.5% ± 2.8 vs 23.0% ± 2.7; both P < .001). Maximum T1 and ECV values correlated strongly with LV mass index for the entire patient cohort with HCM (both r = 0.86; P < .001) and for the subgroups (r = 0.86 and 0.85 for interventricular septal group and r = 0.88 and 0.86 for apical group; all P < .001).
Conclusion
Prolonged myocardial T1 and elevated extracellular volume in hypertrophic cardiomyopathy suggests diffuse myocardial fibrosis, even in the absence of regionally apparent late gadolinium enhancement and hemodynamic obstruction, and is associated with left ventricular hypertrophy.
© RSNA, 2019
See also the editorial by Bluemke and Lima in this issue.
Summary
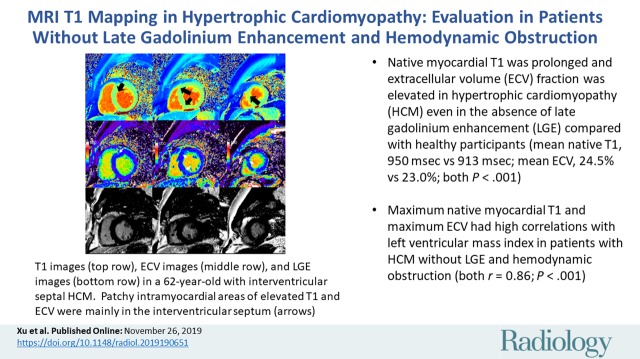
Native myocardial T1 was prolonged and extracellular volume (ECV) fraction was elevated in hypertrophic cardiomyopathy, even in the absence of late gadolinium enhancement and hemodynamic obstruction. Native myocardial T1 and ECV both had a high correlation with the indexed left ventricular mass.
Key Results
■ Native myocardial T1 was prolonged and extracellular volume (ECV) fraction was elevated in hypertrophic cardiomyopathy (HCM) even in the absence of late gadolinium enhancement (LGE) compared with healthy participants (mean native T1, 950 msec ± 48 [standard deviation] vs 913 msec ± 46; mean ECV, 24.5% ± 2.8 vs 23.0% ± 2.7; both P < .001).
■ Maximum native myocardial T1 and maximum ECV had high correlations with left ventricular mass index in patients with HCM without LGE and hemodynamic obstruction (both r = 0.86; P < .001).
Introduction
Hypertrophic cardiomyopathy (HCM) is the most common inherited primary cardiomyopathy with an approximate prevalence of one in 500 (1,2). Life expectancy is normal for the majority of patients with HCM (1,3–5). However, a small minority of patients with HCM may experience life-threatening cardiovascular events. Sudden cardiac death (SCD) accounts for approximately 51% of cardiovascular events in HCM, followed by heart failure (36%) and stroke (13%) (6,7).
The presence of late gadolinium enhancement (LGE) at cardiac MRI has significant prognostic power in the prediction of severe cardiac complications in HCM (all-cause mortality, SCD, and heart failure–related death). However, there are a few limitations of the current LGE MRI techniques. Conventional LGE techniques can detect regional variations in contrast enhancement of the myocardium relative to nulled normal myocardium, but have difficulty in detecting subtle diffuse enhancement of the myocardium. Mistakes in myocardial nulling can lead to nondiagnostic LGE images (8). Also, approximately half of patients with HCM have no LGE at MRI (9,10).
Native myocardial T1 mapping is a robust MRI technique that allows measurement of absolute T1 values of the myocardium. Additionally, T1 values before and after gadolinium-based contrast agent administration can be used to calculate the myocardial extracellular volume (ECV) fraction, which detects the presence of myocardial interstitial fibrosis (11). To our knowledge, the native myocardial T1 and ECV characteristics in patients with HCM who have no LGE at MRI have yet to be well studied.
The purpose of our study was to compare native myocardial T1 and ECV fraction values in patients with HCM who have no LGE and no hemodynamic obstruction with healthy participants to evaluate for the presence of subtle myocardial fibrosis in HCM. We also evaluated the relationship between native myocardial T1 and ECV values and left ventricular (LV) function and LV hypertrophy in patients with HCM. We hypothesized that native myocardial T1 and ECV fraction values would be significantly higher in patients with HCM without LGE compared with healthy participants because of underlying fibrosis.
Materials and Methods
Study Population
All patients with HCM (n = 1446) who were evaluated with cardiac MRI at Fuwai Hospital (Beijing, China) between 2012 and 2015 were retrospectively reviewed. Patients with HCM (n = 258) who met all of the following inclusion criteria were enrolled in this study: HCM was diagnosed by the presence of a nondilated hypertrophied LV at cardiac MRI (maximal wall thickness ≥15 mm in adult patients or ≥13 mm in adult patients whose first-degree relatives had a diagnosis of HCM) in the absence of another disease that could account for the hypertrophy (12), no LGE at cardiac MRI, no hemodynamic obstruction, and preserved or mildly impaired LV systolic function (LV ejection fraction ≥45%). The exclusion criteria included the following: patients with other conditions that can lead to increased LV wall thickness including hypertension, aortic valve disease, sigmoid septum (13), and athletic heart; infiltrative cardiomyopathy such as cardiac amyloidosis, Fabry disease, or Danon disease; renal impairment (estimated glomerular filtration rate of 60 mL/min); and other conventional cardiac contraindications to MRI (eg, claustrophobia). Clinical data and family history were collected and categorized by using New York Heart Association classification.
A control group of healthy participants with a similar age and sex distribution to the enrolled patients with HCM was also enrolled and underwent cardiac MRI. The healthy participants were selected from a database of healthy participants (13). Healthy control participants were defined as volunteers without past medical history of cardiovascular or metabolic disease on the basis of patient history. All patients with HCM and healthy participants underwent both clinical assessment and cardiac MRI. The ethics committee of Fuwai Hospital approved this study. Written informed consent was waived because this study was retrospective.
Cardiac MRI Protocol
Gadolinium-based contrast agent–enhanced cardiac MRI was performed at 1.5 T (Magnetom Avanto; Siemens, Erlangen, Germany) with a maximum gradient field of 45 mT/m and a maximum gradient slew rate of 200 mT·m−1. For cardiac morphologic and functional analysis, steady-state free precession breath-held cines were obtained in three long-axis planes and sequential short-axis slices from the atrioventricular ring to the LV apex. Typical imaging parameters included the following: 3.0/1.1 (repetition time msec/echo time msec); flip angle, 85° to 65°; bandwidth, 800 Hz/pixel; matrix size, 192 × 256; pixel size (interpolated), 2.2 × 1.6 mm2; integrated parallel imaging technique acceleration factor of 2; and temporal resolution, 38–45 msec per frame depending on RR interval.
A modified Look-Locker inversion recovery (MOLLI) sequence was used for T1 mapping as has been previously described (14,15). The MOLLI sequence was performed in the LV short axis for all patients at the base, midchamber, and apex. For patients with apical HCM, two-chamber and four-chamber MOLLI images were also acquired. MOLLI images were acquired before as well as 10–20 minutes after administration of gadolinium-based contrast agent (0.2 mmol/kg of gadopentate dimeglumine [Magnevist; Bayer Healthcare Pharmaceuticals, Wayne, NJ]). The MOLLI acquisition before contrast agent administration followed the 5(3)3 protocol (five images acquired after the first inversion-recovery pulse over five heartbeats, followed by a recovery period of three heartbeats, and three more images were then acquired over three heartbeats after a second inversion recovery pulse) during a breath hold. MOLLI images acquired after contrast agent administration followed the 4(1)3(1)2 protocol (four images acquired after the first inversion pulse over four heartbeats, followed by a recovery period of one heartbeat, three images acquired after a second inversion pulse, followed by recovery period of one heartbeat, and then the last two images acquired after a third inversion-recovery pulse) during a breath hold (13,15). The typical imaging parameters were as follows: 2.5/1.0; matrix, 162 × 256; slice thickness, 6 mm.
Images to identify myocardial LGE were obtained starting at 10 minutes after administration of contrast agent by using a gradient spoiled fast low-angle shot sequence with phase-sensitive inversion-recovery technique. LGE MRI was performed in a four-chamber view, a two-chamber view, and a series of contiguous 6-mm LV short axis slices that covered the entire LV ventricle. The inversion time was individually determined per patient to null the myocardial signal.
Cardiac MRI Analysis
MRI studies were transferred to an offline workstation with the commercial postprocessing software Argus (version VA60C; Siemens) and QMass (version 7.4; Medis Medical Imaging, Leiden, the Netherlands) for blinded analysis. All MRI analyses were performed by a fellowship-trained radiologist (M.J.L, with 15 years of cardiovascular MRI experience) blinded to all identifying information. Linear dimensions of the cardiac chambers (left atrium dimension and LV end-diastolic diameter), LV volumes (LV end-diastolic volume, LV end-systolic volume, stroke volume, and cardiac output), LV mass index, and LV ejection fraction were measured by using standard volumetric techniques and analyzed with commercially available software (Syngo VD10B, Syngo VX49B, and Argus VA60C; Siemens).
LV endocardial and epicardial borders on cine images were manually planimetered to define the myocardium. Maximal LV wall thickness was defined as the greatest linear dimension at any site within the LV myocardium. The LV was assessed according to the American Heart Association 17-segment model (16). Mean T1 values for each LV segment were obtained from the T1 maps at LV basal, midchamber, and apical slices by using a 16-segment American Heart Association model. This was performed on T1 maps both before and after gadolinium-based contrast agent administration. We used methods previously described to calculate the myocardial ECV fraction (17). Hematocrit level was determined for each individual from a venous blood sample drawn less than 24 hours prior to the cardiac MRI examination. We also averaged ECV measurements from the basal, midventricular, and apical short-axis slices to yield a mean ECV value.
The ECV fraction ranges from 0% to 100% (17,18). The ECV values were delineated segmentally in the three short-axis slices defined by the American Heart Association 16-segment model, and results are presented segmentally on ECV maps. Then we obtained the minimum, mean, and maximum of the T1 and ECV values of 16-segment LV model.
LGE was semiautomatically quantified by using the full-width half-maximum method with manual correction (19) by using QMass (Medis Medical Imaging). Any obvious blood pool or pericardial partial volume artifacts were manually corrected.
Inter- and intraobserver variability for T1-derived ECV were assessed in a subgroup of 100 individuals (50 patients with HCM and 50 healthy participants) where one observer (M.J.L) measured T1 once, and a second observer (S. L. with 3 years of cardiovascular MRI experience) who was blinded to the first observer’s results measured T1 at two time points at least 1 week apart. Clinical readers of LGE images were blinded to T1 results.
Evaluation of Cardiovascular Events
The primary end points included heart failure–related death (in context of progressive cardiac decompensation), SCD (unexpected within 1 hour of witnessed collapse or nocturnal), and heart transplantation (6). All events were reviewed by two independent investigators who used previously described criteria (20).
Statistical Analysis
Sample size determination was based on the comparison between patients with HCM and healthy participants. The assumed ratio of patient group and healthy participants with cardiac MRI examinations was around 2:1. By using two-sided α of .05 to test the potential difference of T1 and ECV values among the patients and healthy participants, 240 patients with 120 control participants would offer greater than 80% power to detect a standardized difference of 0.3. The above calculation was performed by using SAS (version 9.4; SAS Institute, Cary, NC). Quantitative data values are expressed as means ± standard deviation or medians and interquartile range, as appropriate. Qualitative data were presented as numbers and percentages. Inter- and intraobserver variability were analyzed with Bland-Altman plots. The comparisons for baseline variables were performed by Student t test, Mann-Whitney U test, and χ2 test for normally distributed, nonnormally distributed, and categorical variables, respectively. Low expected frequency variables, such as the incidence of syncope and family history, were shown as a rate and compared with Fisher exact test. Among the patients with HCM, Pearson correlations were performed to investigate the potential relations between tissue characteristics (T1 and ECV) and LV functional parameters (LV ejection fraction and LV mass index) if the variables were normally distributed. Spearman correlation was performed if the variables were ordinal data or not normally distributed. The main analysis was focused on the potential correlations between maximum T1 and maximum ECV and LV ejection fraction and LV mass index among the overall population. Because there were four tests on the key comparisons regarding the correlation coefficients mentioned above, we used the Bonferroni correction to adjust the multiplicity issue (21). After Bonferroni correction, P value of .01 (ie, P < .05/4 = .01) was set for the main analysis. Moreover, linear correlation graphs were generated to evaluate the correlation between the minimum, maximum, and mean T1 values and the minimum, maximum, and mean ECV values, respectively. Univariable Cox regression models were used to estimate the unadjusted hazard of primary end points for each clinical as well as each cardiac MRI characteristic. Hazard ratios were generated and were expressed together with their 95% confidence intervals. To avoid the overfitting problem, multivariable models were not presented due to the low number of primary end points. Results were considered to indicate statistical significance if P < .05. Statistical analysis was performed by using SPSS (version 20.0; SPSS, Chicago, Ill).
Results
Demographics of the Patient Sample
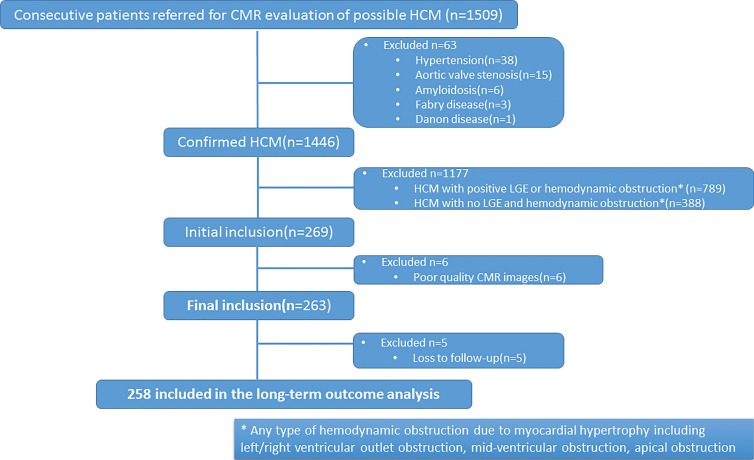
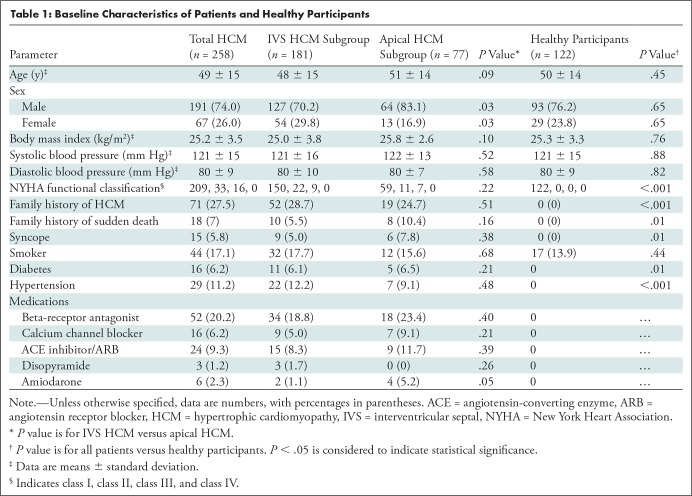
Two hundred fifty-eight patients (17.8%) of the 1446 patients fulfilled the inclusion criteria of nonobstructive HCM without LGE (Fig 1). The patient sample included 181 of 258 (70.2%) patients with interventricular septal HCM and 77 of 258 (29.8%) patients with apical HCM (Table 1). Among patients with interventricular septal HCM, 70.2% (127 of 181) were men, whereas 83.1% (64 of 77) of patients with apical HCM were men (P = .03). There were no differences in the proportion of patients with a family history of HCM or for a family history of SCD between the two groups.
Figure 1:
Flowchart shows patient selection process based on inclusion and exclusion criteria. CMR = cardiac MRI, HCM = hypertrophic cardiomyopathy, LGE = late gadolinium enhancement.
Table 1:
Baseline Characteristics of Patients and Healthy Participants
Myocardial Function by Using MRI
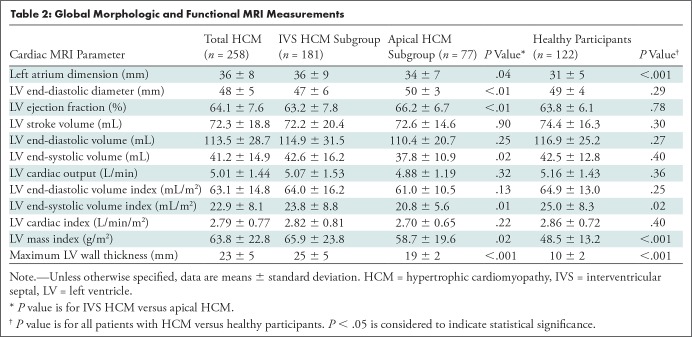
The mean left atrial dimension in the group with interventricular septal HCM was 36 mm ± 9 (standard deviation), which was larger than that in the group with apical HCM (34 mm ± 7; P = .04). Left atrium dimension in the entire HCM cohort was also larger than that in healthy participants (36 mm ± 8 vs 31 mm ± 5; P < .001). However, the LV end-diastolic diameter in the group with interventricular septal HCM was smaller than that in the group with apical HCM (47 mm ± 6 vs 50 mm ± 3; P < .01) and LV end-diastolic diameter in the entire HCM cohort had no significant difference compared with healthy participants (P = .29). The LV ejection fraction in apical HCM was 3.0% higher than that in interventricular septal HCM, while LV ejection fraction in the entire HCM cohort was no different from the healthy participants (P = .78). With the exception of the LV end-diastolic diameter, LV ejection fraction, end-systolic volume, and end-systolic volume index, there are no significant differences in other LV functional parameters including stroke volume, end-diastolic volume, cardiac output, end-diastolic volume index, and cardiac index between the two subgroups of HCM.
The maximum wall thickness in septal HCM was greater than that observed in apical HCM (25 mm ± 5 vs 19 mm ± 2; P < .001) and the healthy participants (25 mm ± 5 vs 10 mm ± 2; P < .001). The LV mass index was lowest in the healthy participants (48.5 g/m2 ± 13.2) followed by apical HCM (58.7 g/m2 ± 19.6; P < .001) and interventricular septal HCM (65.9 g/m2 ± 23.8; P < .001). However, there were significant differences observed in the LV mass index between the interventricular septal HCM group and the apical HCM group (P = .02). The detailed MRI functional results of the patients with interventricular septal HCM, the patients with apical HCM, and the healthy participants are presented in Table 2.
Table 2:
Global Morphologic and Functional MRI Measurements
T1 Mapping Results
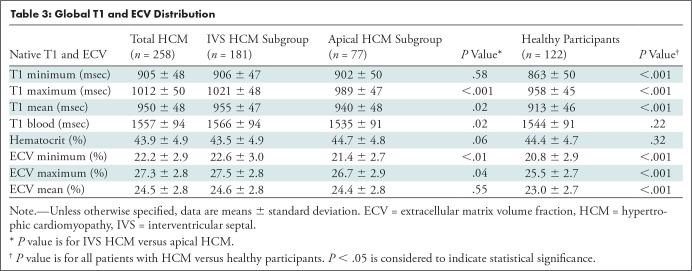
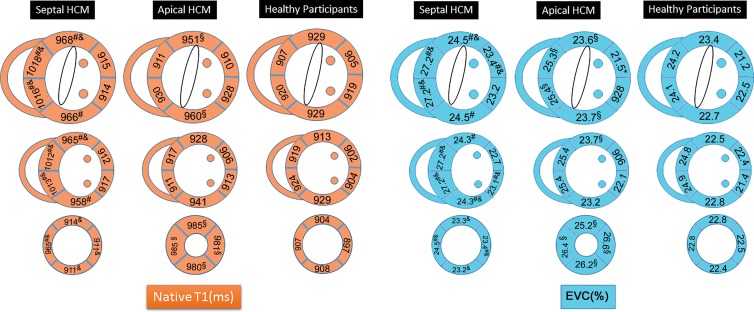
The mean native myocardial T1 values for interventricular septal HCM (955 msec ± 47) and apical HCM (940 msec ± 48) were greater than that of the healthy participants (913 msec ± 46) (Table 3). Segmental analysis of native myocardial T1 values in the patients with HCM showed that the prolonged native myocardial T1 values in the patients with HCM predominately involved the segments with myocardial hypertrophy (segments 1–4, 7–9, and 14 in the group with interventricular HCM; segments 1, 4, and 13–16 in group with apical HCM; all P < .05) (Figs 2–5). Myocardial ECV fraction was greater in patients with HCM (mean, 24.5% ± 2.8) than in the healthy participants (mean, 23.0% ± 2.7) in a similar distribution as the abnormal areas of native myocardial T1. The ECV fraction of segments 1–4, 6–11, 14, and 16 in the group with interventricular septal HCM and segments 2–4, 7, and 13–16 in the group with apical HCM were all greater than those in heathy participants. Minimum myocardial ECV, maximum myocardial ECV, and mean myocardial ECV in interventricular septal HCM (22.6% ± 3.0, 27.5% ± 2.8, 24.6% ± 2.8, respectively) and apical HCM (21.4% ± 2.7, 26.7% ± 2.9, 24.4% ± 2.8, respectively) were greater when compared with the healthy participants (20.8% ± 2.9, 25.5% ± 2.7, 23.0% ± 2.7, respectively; all P < .01) (Table 3; Figs 2–5).
Table 3:
Global T1 and ECV Distribution
Figure 2:
Image shows distribution of native myocardial T1 and extracellular volume (ECV) fraction in septal hypertrophic cardiomyopathy (HCM), apical HCM, and healthy participants. Compared with healthy participants, native myocardial T1 was elevated in segments 1–4, 7–10, and 14 in patients with septal HCM and in segments 1, 4, and 13–16 in patients with apical HCM. Elevated ECV was similar in distribution to areas of elevated native myocardial T1 in both patient groups. P < .05 is considered to indicate statistical significance. Posthoc tests showed significant differences between interventricular septal HCM versus healthy participants (#), apical HCM versus healthy participants (§), and interventricular septal HCM versus apical HCM (&), respectively.
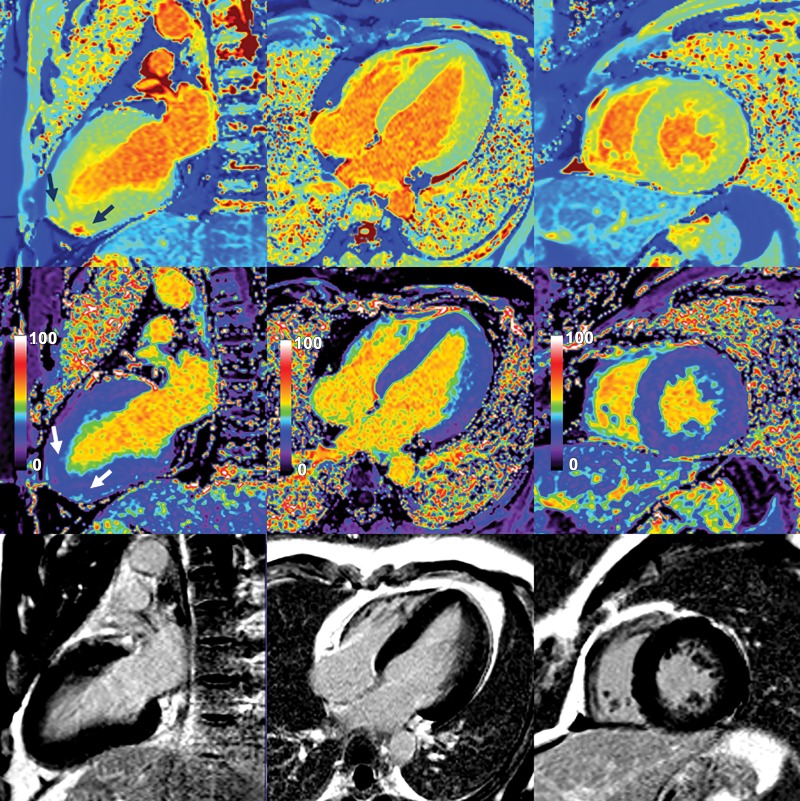
Figure 5:
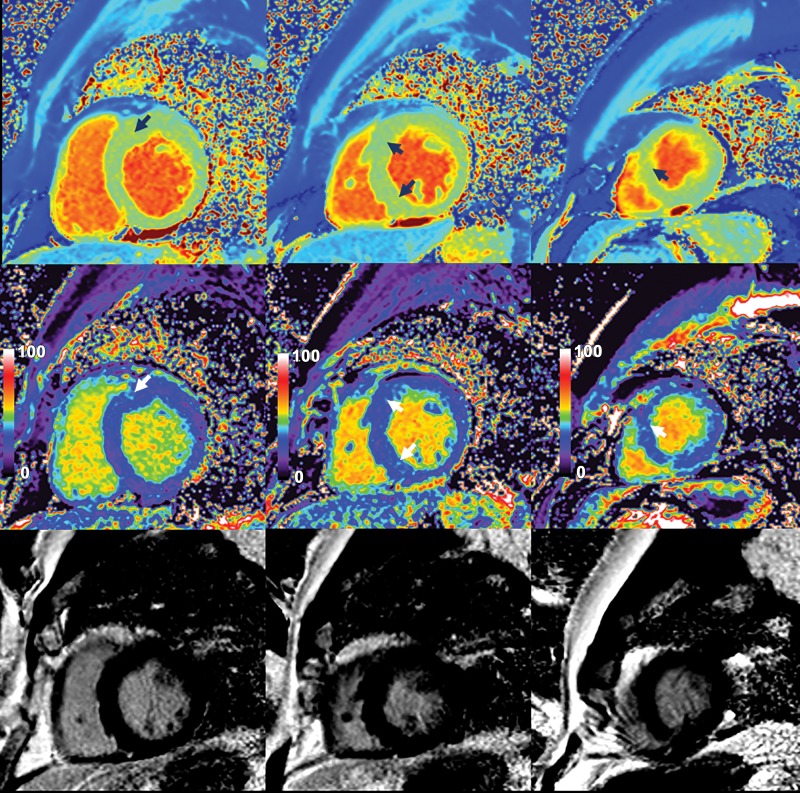
Native myocardial T1 images (top row), quantitative extracellular volume (ECV) fraction images (middle row), and late gadolinium enhancement (LGE) images (bottom row) in a 33-year-old man with apical hypertrophic cardiomyopathy. Patchy intramyocardial areas of elevated T1 and ECV were mainly in apex (arrows). These findings suggest increased extracellular matrix in hypertrophied areas of myocardium. No obvious LGE was observed on conventional LGE images.
Figure 3:
Native myocardial T1 images (top row), quantitative extracellular volume (ECV) fraction images (middle row), and late gadolinium enhancement images (bottom row) in a healthy 29-year-old woman. Mean native myocardial T1 and ECV fraction in healthy participants were 913 msec ± 46 (standard deviation) and 23.0% ± 2.7, respectively.
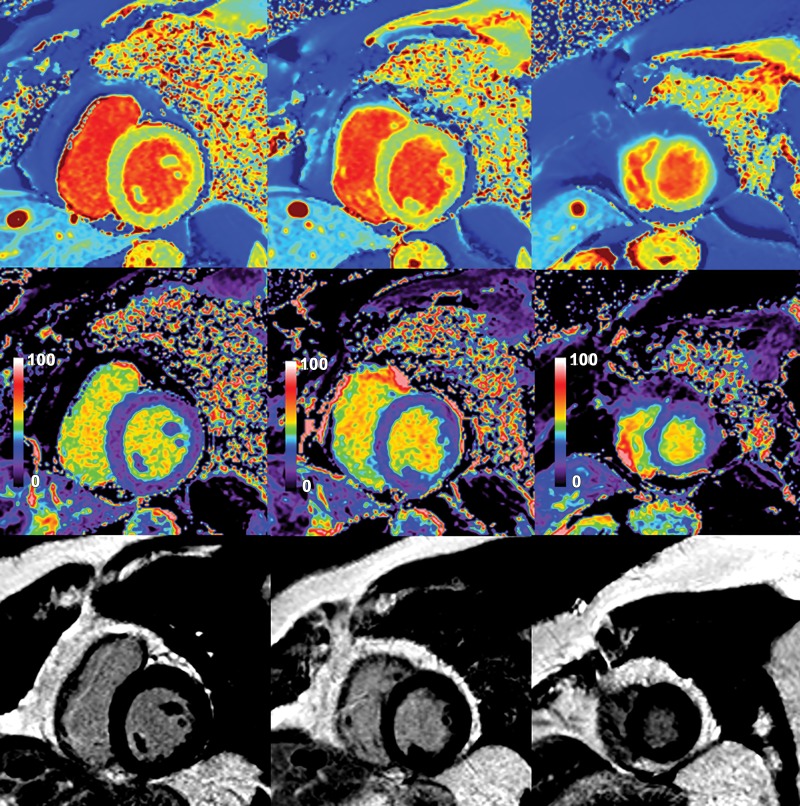
Figure 4:
Native myocardial T1 images (top row), quantitative extracellular volume (ECV) fraction images (middle row), and late gadolinium enhancement (LGE) images (bottom row) in a 62-year-old man with interventricular septal hypertrophic cardiomyopathy. Patchy intramyocardial areas of elevated T1 and ECV were mainly in interventricular septum (arrows). These findings suggest increase of extracellular matrix in involved myocardium. No obvious LGE was observed on conventional LGE images in bottom row.
T1 Mapping in Relation to LV Function
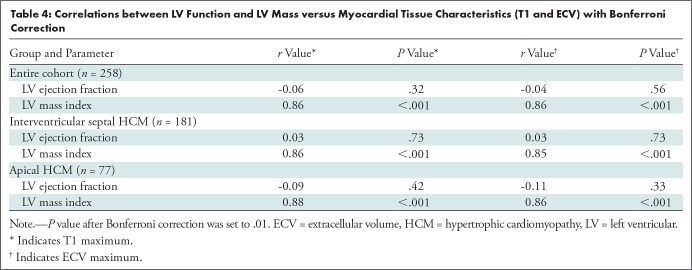
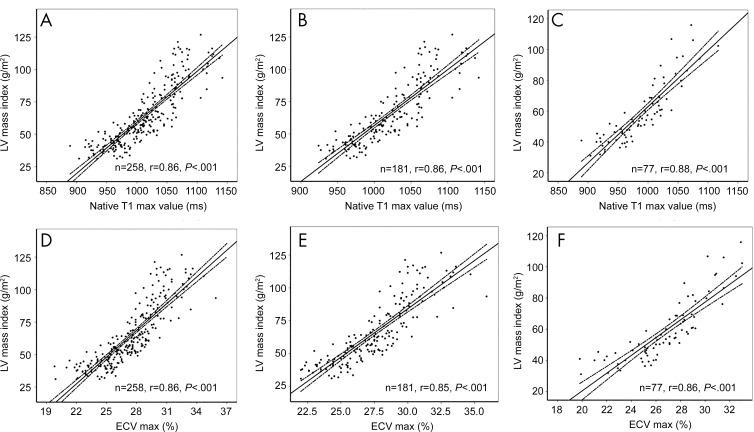
There were no correlations between tissue characteristics (maximum T1 and maximum ECV) and LV ejection fraction (both r < 0.3; P > .05). However, the LV mass index correlated well with tissue characteristics (maximum T1 and maximum ECV). Within the entire cohort, there was a positive association between maximum T1 and maximum ECV and LV mass index (both r = 0.86; P < .01). For further subgroup analysis of patients with interventricular septal HCM and patients with apical HCM, both maximum myocardial T1 and maximum ECV showed positive associations with indexed LV mass index (r = 0.86 and 0.85 for interventricular septal HCM and r = 0.88 and 0.86 for apical HCM; all P < .001) (Table 4, Fig 6).
Table 4:
Correlations between LV Function and LV Mass versus Myocardial Tissue Characteristics (T1 and ECV) with Bonferroni Correction
Figure 6:
Graphs illustrate correlation between native T1 and extracellular volume (ECV) values and left ventricular (LV) mass index in, A, D, all patients with hypertrophic cardiomyopathy (HCM) (n = 258), B,E, patients with interventricular septal HCM (n = 181), and, C, F, patients with apical HCM (n = 77), respectively. Max = maximum.
T1 Mapping in Relation to Cardiovascular Outcomes
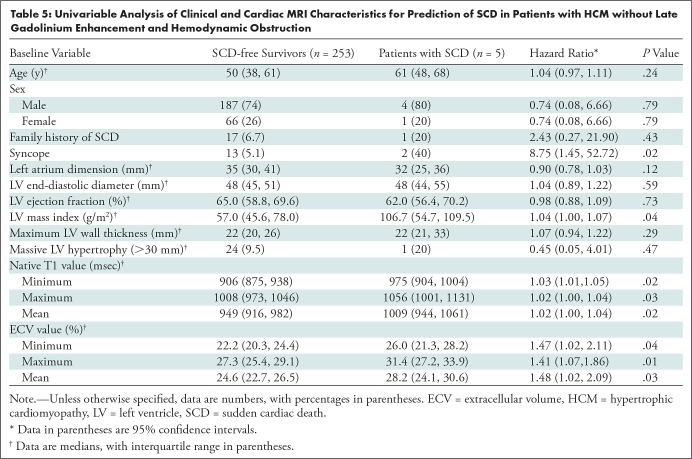
The median follow-up periods were 48 months (interquartile range, 39–65 months) for the group with interventricular septal HCM and 51 months (interquartile range, 47–76 months) for the group with apical HCM. During the follow-up period, five of 258 patients (1.9%) had SCD. The average time between cardiac MRI and SCD was 50 months ± 13 (range, 34–67 months). Three of five patients had interventricular septal HCM and two of five patients had apical HCM. There were no other end-point events (eg, heart failure–related death or heart transplantation) during the follow-up period. No healthy participants reached any end points. Syncope, LV mass index, native T1, and ECV were all associated with SCD in the univariable analysis (Table 5). The low event rate precluded multivariable analyses.
Table 5:
Univariable Analysis of Clinical and Cardiac MRI Characteristics for Prediction of SCD in Patients with HCM without Late Gadolinium Enhancement and Hemodynamic Obstruction
Intra- and Interobserver Variability
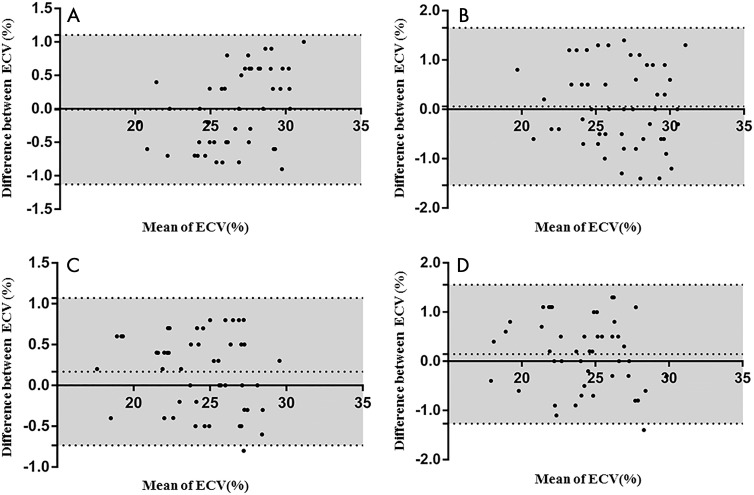
ECV fraction in the healthy participants and the HCM patient groups (interventricular septal HCM and apical HCM) had a mean intraobserver variability of 0.2% ± 0.5 and 0.0% ± 0.6, and a mean interobserver variability of 0.1% ± 0.8 and 0.1% ± 0.8, respectively (Fig 7).
Figure 7:
Bland-Altman analyses show extracellular volume (ECV) for intra- and interobserver variability in patients with hypertrophic cardiomyopathy (HCM) and healthy participants. Variability of, A, intraobserver and, B, interobserver for patients with HCM is shown. Variability of C, intraobserver and, D, interobserver for healthy participants is shown. Middle dashed line indicates mean difference and gray area between dashed lines indicates standard deviation.
Discussion
The results of our study demonstrate several important findings regarding the characteristics and prognostic value of native myocardial T1 measurements and extracellular volume (ECV) fraction values in patients with hypertrophic cardiomyopathy (HCM) who show no late gadolinium enhancement (LGE) and no hemodynamic obstruction. First, we found prolonged native myocardial T1 and increased ECV in patients with HCM (within the hypertrophied myocardial segments) who showed no LGE at MRI. These results suggest that patients with HCM have increased interstitial fibrosis within the hypertrophied segments despite the absence of LGE. These findings are an important advancement beyond conventional LGE techniques, which can readily identify dense focal scar but have difficulty in detecting more subtle diffuse expansion of the extracellular matrix caused by interstitial fibrosis, inflammation, edema, and infiltrative processes. Second, greater T1 and ECV values were associated with left ventricular (LV) mass index across all patients with HCM. Third, we found that native myocardial T1 and ECV were associated with sudden cardiac death (SCD) in patients with HCM who show no LGE at MRI.
Previous studies have demonstrated abnormal expansion of the extracellular space in the myocardium of patients with HCM by using native T1 mapping methods (22), as well as T1 mapping before and after contrast agent administration (13,23,24). The majority of studies have predominantly reported that native myocardial T1 values were significantly longer in HCM segments with LGE. In our study, we applied the T1 maps to further evaluate the myocardium in patients with HCM without LGE at MRI to assess for expansion of the extracellular space prior to the appearance of LGE at MRI. When compared with healthy participants, both native myocardial T1 and ECV fraction values were significantly greater in hypertrophic segments in both interventricular septal HCM and apical HCM, despite the absence of LGE. This finding is in keeping with a few previous studies that have shown that native myocardial T1 values are greater in HCM hypertrophied segments without LGE when compared with healthy participants (13,22). Thus, native myocardial T1 mapping and ECV fraction have an increased ability to detect abnormal myocardium compared with conventional LGE.
The mechanism of pathology in HCM reported by studies in animal models of HCM have found significant and early upregulation of genes involved in extracellular matrix synthesis (25). These genetic pathways were activated before LV hypertrophy or myocardial fibrosis developed, making increase in extracellular matrix the earliest finding in HCM. More recently, human studies have also shown that myocardial type I collagen synthesis is significantly increased in sarcomere mutation carriers, even in the absence of LV hypertrophy and LGE (26). Thus, the earliest abnormality in HCM is increased extracellular matrix. Although both native myocardial T1 values and LGE are both altered by the expansion of the extracellular space, native T1 values could be affected by additional changes such as intramyocellular water distribution. Thus, some researchers have suggested that native myocardial T1 values reflect the severity of the disease stage in HCM more accurately than does LGE (22).
Over the last several decades, the list of known risk factors of SCD in patients with HCM has continued to grow. It has grown from what was originally five binary risk factors into the HCM Risk-SCD model that has been incorporated in the 2014 European Society of Cardiology guidelines (27,28). In patients with HCM, risk stratification is a clinical challenge and has been mainly focused on prevention of SCD. Several risk factors have been proposed: family history of SCD, unexplained syncope, nonsustained ventricular tachycardia, LV thickness, and LV outflow tract obstruction gradient (29). O’Mahony et al (28) developed a newer risk prediction model to predict SCD in patients with HCM, which included the use of continuous variables instead of dichotomized variables and which was implemented in the current European Society of Cardiology guidelines. In 2018, Maron et al (1) modified risk stratification and primary prevention of SCD with implantable cardioverter defibrillators in patients with HCM. A more recently updated risk model for SCD in patients with HCM includes six major risk factors: family history of HCM-related sudden death, unexplained syncope, multiple-repetitive nonsustained ventricular tachycardia, massive LV hypertrophy (>30 mm), LV apical aneurysm, extensive LGE (>15%), and end-stage HCM (ejection fraction <50%) (3).
Although this updated risk model and risk factors improves risk stratification for SCD and subsequently identification of patients who can benefit from an implantable cardioverter defibrillator (30,31), the current guidelines and risk models have no recommendations regarding quantitative native myocardial T1 and ECV fraction in risk stratification for SCD. There are still a small number of patients without LGE and without LV outflow tract obstruction who die of SCD in a relatively long period of follow-up.
In our cohort, syncope was the only conventional risk factor that was associated with SCD, but this may be limited because of the small number of patients with SCD in our cohort. According to our findings, ECV is the best image-based risk factor associated with SCD in the two types of patients with HCM studied, but this needs to be further validated in a future study with a larger study cohort. Furthermore, other studies have shown that elevated ECV fraction is not only an important risk marker for SCD in HCM (32,33) but also for adverse cardiovascular events in patients with other nonischemic cardiomyopathies (34,35).
This study had several limitations. First, the relatively small number of patients enrolled in a single center, together with the low number of SCD events, represents an obvious limitation that allows us to suggest, rather than to affirm, that native myocardial T1 and ECV fraction analysis might improve HCM SCD risk stratification in the low-intermediate risk categories. Second, we acknowledge that because of the low SCD events, only univariable Cox regression analyses were performed at a single time point. Thus, we cannot confirm which variable is an independent risk factor for SCD. Third, only modified Look-Locker inversion recovery T1 mapping was used for ECV calculation. Thus, these results should be interpreted with caution when compared with other T1 mapping techniques. Other potential prognostic markers, such as N-terminal pro b-type natriuretic peptide, were not systematically assessed. Further prospective studies in large patient populations are needed to further validate our data and apply them to daily clinical practice.
In summary, we demonstrated the global and segmental distributions of T1 and extracellular volume (ECV) characteristics in hypertrophic cardiomyopathy (HCM) without late gadolinium enhancement (LGE) and hemodynamic obstruction detected early expansion of the myocardial extracellular space. Native T1 and ECV are highly correlated with left ventricular mass index. Future prospective, randomized, large, and multicenter investigations are needed to investigate the prognostic value of myocardial tissue characteristics (T1 and ECV) in HCM without LGE and hemodynamic obstruction.
Acknowledgments
Acknowledgments
The authors thank Andrew E. Arai, MD, National Heart, Lung, and Blood Institute (NHLBI), National Institutes of Health (NIH), USA, for his expertise during with the revision of the manuscript. We also thank Yang Wang, PhD, Medical Research & Biometrics Center, Cardiovascular Institute and Fuwai Hospital, National Center for Cardiovascular Diseases, for the assistance with the statistical analysis.
Supported in part by the Research Grant of National Natural Science Foundation of China (81571647, 81620108015, 81771811, 81971588), Education Reform Project of Peking Union Medical College (10023201900204), and Capital Clinically Characteristic Applied Research Fund (Z191100006619021).
J.X. and B.Z. contributed equally to this work.
Disclosures of Conflicts of Interest: J.X. disclosed no relevant relationships. B.Z. disclosed no relevant relationships. A.S. disclosed no relevant relationships. S.L. disclosed no relevant relationships. J.H. disclosed no relevant relationships. G.Y. disclosed no relevant relationships. L.S. disclosed no relevant relationships. Y.J. disclosed no relevant relationships. S.Z. disclosed no relevant relationships. M.L. disclosed no relevant relationships.
Abbreviations:
- ECV
- extracellular volume
- HCM
- hypertrophic cardiomyopathy
- LGE
- late gadolinium enhancement
- LV
- left ventricle
- MOLLI
- modified Look-Locker inversion recovery
- SCD
- sudden cardiac death
References
- 1. Maron BJ. . Clinical Course and Management of Hypertrophic Cardiomyopathy . N Engl J Med 2018. ; 379 ( 7 ): 655 – 668 . [DOI] [PubMed] [Google Scholar]
- 2. Maron BJ, Ommen SR, Semsarian C, Spirito P, Olivotto I, Maron MS. . Hypertrophic cardiomyopathy: present and future, with translation into contemporary cardiovascular medicine . J Am Coll Cardiol 2014. ; 64 ( 1 ): 83 – 99 [Published correction appears in J Am Coll Cardiol 2014;64(11):1188.] . [DOI] [PubMed] [Google Scholar]
- 3. Maron BJ, Casey SA, Hauser RG, Aeppli DM. . Clinical course of hypertrophic cardiomyopathy with survival to advanced age . J Am Coll Cardiol 2003. ; 42 ( 5 ): 882 – 888 . [DOI] [PubMed] [Google Scholar]
- 4. Elliott P, McKenna WJ. . Hypertrophic cardiomyopathy . Lancet 2004. ; 363 ( 9424 ): 1881 – 1891 . [DOI] [PubMed] [Google Scholar]
- 5. Maron BJ, Rowin EJ, Casey SA, et al . Hypertrophic Cardiomyopathy in Children, Adolescents, and Young Adults Associated With Low Cardiovascular Mortality With Contemporary Management Strategies . Circulation 2016. ; 133 ( 1 ): 62 – 73 . [DOI] [PubMed] [Google Scholar]
- 6. Maron BJ, Olivotto I, Spirito P, et al . Epidemiology of hypertrophic cardiomyopathy-related death: revisited in a large non-referral-based patient population . Circulation 2000. ; 102 ( 8 ): 858 – 864 . [DOI] [PubMed] [Google Scholar]
- 7. Elliott PM, Gimeno JR, Thaman R, et al . Historical trends in reported survival rates in patients with hypertrophic cardiomyopathy . Heart 2006. ; 92 ( 6 ): 785 – 791 . [DOI] [PMC free article] [PubMed] [Google Scholar]
- 8. Kim RJ, Chen EL, Lima JA, Judd RM. . Myocardial Gd-DTPA kinetics determine MRI contrast enhancement and reflect the extent and severity of myocardial injury after acute reperfused infarction . Circulation 1996. ; 94 ( 12 ): 3318 – 3326 . [DOI] [PubMed] [Google Scholar]
- 9. Todiere G, Aquaro GD, Piaggi P, et al . Progression of myocardial fibrosis assessed with cardiac magnetic resonance in hypertrophic cardiomyopathy . J Am Coll Cardiol 2012. ; 60 ( 10 ): 922 – 929 . [DOI] [PubMed] [Google Scholar]
- 10. Axelsson Raja A, Farhad H, Valente AM, et al . Prevalence and Progression of Late Gadolinium Enhancement in Children and Adolescents With Hypertrophic Cardiomyopathy . Circulation 2018. ; 138 ( 8 ): 782 – 792 . [DOI] [PMC free article] [PubMed] [Google Scholar]
- 11. Flett AS, Hayward MP, Ashworth MT, et al . Equilibrium contrast cardiovascular magnetic resonance for the measurement of diffuse myocardial fibrosis: preliminary validation in humans . Circulation 2010. ; 122 ( 2 ): 138 – 144 . [DOI] [PubMed] [Google Scholar]
- 12. Bos JM, Towbin JA, Ackerman MJ. . Diagnostic, prognostic, and therapeutic implications of genetic testing for hypertrophic cardiomyopathy . J Am Coll Cardiol 2009. ; 54 ( 3 ): 201 – 211 . [DOI] [PubMed] [Google Scholar]
- 13. Lu M, Zhao S, Yin G, et al . T1 mapping for detection of left ventricular myocardial fibrosis in hypertrophic cardiomyopathy: a preliminary study . Eur J Radiol 2013. ; 82 ( 5 ): e225 – e231 . [DOI] [PubMed] [Google Scholar]
- 14. Messroghli DR, Radjenovic A, Kozerke S, Higgins DM, Sivananthan MU, Ridgway JP. . Modified Look-Locker inversion recovery (MOLLI) for high-resolution T1 mapping of the heart . Magn Reson Med 2004. ; 52 ( 1 ): 141 – 146 . [DOI] [PubMed] [Google Scholar]
- 15. Kellman P, Wilson JR, Xue H, et al . Extracellular volume fraction mapping in the myocardium, part 2: initial clinical experience . J Cardiovasc Magn Reson 2012. ; 14 ( 1 ): 64 . [DOI] [PMC free article] [PubMed] [Google Scholar]
- 16. Fattori R, Biagini E, Lorenzini M, Buttazzi K, Lovato L, Rapezzi C. . Significance of magnetic resonance imaging in apical hypertrophic cardiomyopathy . Am J Cardiol 2010. ; 105 ( 11 ): 1592 – 1596 . [DOI] [PubMed] [Google Scholar]
- 17. Ugander M, Oki AJ, Hsu LY, et al . Extracellular volume imaging by magnetic resonance imaging provides insights into overt and sub-clinical myocardial pathology . Eur Heart J 2012. ; 33 ( 10 ): 1268 – 1278 . [DOI] [PMC free article] [PubMed] [Google Scholar]
- 18. Moon JC, Messroghli DR, Kellman P, et al . Myocardial T1 mapping and extracellular volume quantification: a Society for Cardiovascular Magnetic Resonance (SCMR) and CMR Working Group of the European Society of Cardiology consensus statement . J Cardiovasc Magn Reson 2013. ; 15 ( 1 ): 92 . [DOI] [PMC free article] [PubMed] [Google Scholar]
- 19. Iles LM, Ellims AH, Llewellyn H, et al . Histological validation of cardiac magnetic resonance analysis of regional and diffuse interstitial myocardial fibrosis . Eur Heart J Cardiovasc Imaging 2015. ; 16 ( 1 ): 14 – 22 . [DOI] [PubMed] [Google Scholar]
- 20. Kannel WB, Wolf PA, Castelli WP, D’Agostino RB. . Fibrinogen and risk of cardiovascular disease. The Framingham Study . JAMA 1987. ; 258 ( 9 ): 1183 – 1186 . [PubMed] [Google Scholar]
- 21. Sture H. . A Simple Sequentially Rejective Multiple Test Procedure . Scand J Stat 1979. ; 6 ( 2 ): 65 – 70 . https://www.jstor.org/stable/4615733 . [Google Scholar]
- 22. Dass S, Suttie JJ, Piechnik SK, et al . Myocardial tissue characterization using magnetic resonance noncontrast t1 mapping in hypertrophic and dilated cardiomyopathy . Circ Cardiovasc Imaging 2012. ; 5 ( 6 ): 726 – 733 . [DOI] [PubMed] [Google Scholar]
- 23. Ellims AH, Iles LM, Ling LH, Hare JL, Kaye DM, Taylor AJ. . Diffuse myocardial fibrosis in hypertrophic cardiomyopathy can be identified by cardiovascular magnetic resonance, and is associated with left ventricular diastolic dysfunction . J Cardiovasc Magn Reson 2012. ; 14 ( 1 ): 76 . [DOI] [PMC free article] [PubMed] [Google Scholar]
- 24. Amano Y, Takayama M, Kumita S. . Contrast-enhanced myocardial T1-weighted scout (Look-Locker) imaging for the detection of myocardial damages in hypertrophic cardiomyopathy . J Magn Reson Imaging 2009. ; 30 ( 4 ): 778 – 784 . [DOI] [PubMed] [Google Scholar]
- 25. Kim JB, Porreca GJ, Song L, et al . Polony multiplex analysis of gene expression (PMAGE) in mouse hypertrophic cardiomyopathy . Science 2007. ; 316 ( 5830 ): 1481 – 1484 . [DOI] [PubMed] [Google Scholar]
- 26. Ho CY, López B, Coelho-Filho OR, et al . Myocardial fibrosis as an early manifestation of hypertrophic cardiomyopathy . N Engl J Med 2010. ; 363 ( 6 ): 552 – 563 . [DOI] [PMC free article] [PubMed] [Google Scholar]
- 27. Authors/Task Force Members , Elliott PM, Anastasakis A, et al . 2014 ESC Guidelines on diagnosis and management of hypertrophic cardiomyopathy: the Task Force for the Diagnosis and Management of Hypertrophic Cardiomyopathy of the European Society of Cardiology (ESC) . Eur Heart J 2014. ; 35 ( 39 ): 2733 – 2779 . [DOI] [PubMed] [Google Scholar]
- 28. O’Mahony C, Jichi F, Pavlou M, et al . A novel clinical risk prediction model for sudden cardiac death in hypertrophic cardiomyopathy (HCM risk-SCD) . Eur Heart J 2014. ; 35 ( 30 ): 2010 – 2020 . [DOI] [PubMed] [Google Scholar]
- 29. Gersh BJ, Maron BJ, Bonow RO, et al . 2011 ACCF/AHA guideline for the diagnosis and treatment of hypertrophic cardiomyopathy: a report of the American College of Cardiology Foundation/American Heart Association Task Force on Practice Guidelines . Circulation 2011. ; 124 ( 24 ): e783 – e831 . [DOI] [PubMed] [Google Scholar]
- 30. Ruiz-Salas A, García-Pinilla JM, Cabrera-Bueno F, et al . Comparison of the new risk prediction model (HCM Risk-SCD) and classic risk factors for sudden death in patients with hypertrophic cardiomyopathy and defibrillator . Europace 2016. ; 18 ( 5 ): 773 – 777 . [DOI] [PubMed] [Google Scholar]
- 31. Vriesendorp PA, Schinkel AF, Liebregts M, et al . Validation of the 2014 European Society of Cardiology guidelines risk prediction model for the primary prevention of sudden cardiac death in hypertrophic cardiomyopathy . Circ Arrhythm Electrophysiol 2015. ; 8 ( 4 ): 829 – 835 . [DOI] [PubMed] [Google Scholar]
- 32. Hinojar R, Varma N, Child N, et al . T1 Mapping in Discrimination of Hypertrophic Phenotypes: Hypertensive Heart Disease and Hypertrophic Cardiomyopathy: Findings From the International T1 Multicenter Cardiovascular Magnetic Resonance Study . Circ Cardiovasc Imaging 2015. ; 8 ( 12 ): e003285 . [DOI] [PubMed] [Google Scholar]
- 33. Ho CY, Abbasi SA, Neilan TG, et al . T1 measurements identify extracellular volume expansion in hypertrophic cardiomyopathy sarcomere mutation carriers with and without left ventricular hypertrophy . Circ Cardiovasc Imaging 2013. ; 6 ( 3 ): 415 – 422 . [DOI] [PMC free article] [PubMed] [Google Scholar]
- 34. Kammerlander AA, Marzluf BA, Zotter-Tufaro C, et al . T1 Mapping by CMR Imaging: From Histological Validation to Clinical Implication . JACC Cardiovasc Imaging 2016. ; 9 ( 1 ): 14 – 23 . [DOI] [PubMed] [Google Scholar]
- 35. Puntmann VO, Carr-White G, Jabbour A, et al . T1-Mapping and Outcome in Nonischemic Cardiomyopathy: All-Cause Mortality and Heart Failure . JACC Cardiovasc Imaging 2016. ; 9 ( 1 ): 40 – 50 [Published correction appears in JACC Cardiovasc Imaging 2017;10(3):384.] . [DOI] [PubMed] [Google Scholar]


