Abstract
Background
Chemotherapy is widely used in gastric cancer treatment, but multidrug resistance remains a leading cause of chemotherapy failure. Trop2 is highly expressed in gastric tumor tissues and greatly influences cancer progression. However, little is known about the relationship between Trop2 and drug resistance in gastric cancer.
Material/Methods
In the present study, Trop2 was knocked down in BGC823 cells and overexpressed in HGC27. CCK-8 assay was performed to explore the relationship of Trop2 expression and cell proliferation treated with anticancer drugs. Flow cytometry was performed to assess the relationship between Trop2 and cell apoptosis after chemotherapy. Subcutaneous xenograft models were generated to explore the curative effect of DDP to GC in vivo. MRP1 and Notch1 expressions were assessed by Western blot.
Results
Trop2 decreased cell proliferation inhibition and apoptosis after chemotherapeutic treatments. DDP showed stronger therapeutic effects on Trop2-knockdown tumor than control in vivo. MRP1 and Notch1 signaling pathway were confirmed to participate in Trop2-induced drug resistance.
Conclusions
Our findings suggest that Trop2 promotes the resistance of gastric cancer to chemotherapy by activating the Notch1 pathway.
MeSH Keywords: Drug Resistance; Receptor, Notch1; Stomach Neoplasms
Background
Gastric cancer (GC) is the fourth most common malignancy and is the third leading cause of cancer death in the world [1]. Surgery significantly contributes to fighting GC, but it is only curative in the early stage, and a large proportion of GC patients have entered advanced stages at initial diagnosis [2]. Chemotherapy is widely used to improve quality of life and to extend the survival time of GC patients with unresectable disease. However, multidrug resistance (MDR) is still a major obstacle to the treatment of gastric cancer despite chemotherapeutic advances.
Trophoblast cell-surface antigen 2 (Trop2), also known as human tumor-associated calcium signal transducer 2 (TACSTD2), is a 36-kDa cell-surface glycoprotein originally identified in human placental trophoblastic tissue [3]. It has been demonstrated that GC tissues expressed higher levels of Trop2 compared with matched pericarcinomatous tissues, and GC patients with high Trop2 expression tended to have poor prognosis [4]. Trop2 is correlated with CREB and P27 in function, which may influence the therapeutic effects of tamoxifen and gemcitabine [5–7], but little is known about the role of Trop2 in GC chemotherapy resistance and the underlying molecular mechanism.
The aim of this study was to determine the function of Trop2 on GC chemoresistance and to explain the molecular mechanism by which it occurs. Our findings provide new insights into the role of Trop2 in MDR, and further studies are needed to confirm Trop2 as a potential therapeutic target for GC patients with drug resistance.
Material and Methods
Cell lines and cell culture
The human gastric cancer cell lines MGC803, BGC823, MKN45, MKN28, and HGC27 and the gastric epithelial cell line GES-1 were purchased from KeyGEN Biotechnology. Cell lines were maintained in RPMI 1640 medium (#61870044, Gibco, USA) containing 10% fetal bovine serum (#10099141, Invitrogen, USA), 100 units/mL penicillin, and 100 μg/ml streptomycin sulfate (#15070063, Invitrogen, USA). All cells were incubated in a humidified atmosphere containing 5% CO2 at 37°C.
Protein extraction and Western blot analysis
Total proteins were extracted using RIPA Lysis Buffer (#P0013C, Beyotime, China) based on the manufacturer’s protocol. Protein concentrations were determined by BCA Protein Assay Kit (#23227, Pierce, USA). Equal amounts of protein were resolved by polyacrylamide gel for electrophoresis and transferred onto a PVDF membrane. The membrane was blocked with 5% milk for 2 h at room temperature and then incubated with goat anti-human TROP2 polyclonal antibody (1: 1000, #AF650, R&D Systems, USA), rabbit anti-human MRP1/ABCC1 polyclonal antibody (1: 500, #14685, Cell Signaling Technology, USA), or rabbit anti-human Notch1 polyclonal antibody (1;1000, #3608, Cell Signaling technology, USA) overnight at 4°C. The membrane was washed 3 times with PBST and then incubated with secondary antibodies for 1 h at room temperature. The membrane was subsequently incubated with SuperSignal West Dura Extended Duration Substrate (#37071, Thermo, USA) and exposed to the ChemiDoc XRS+ System (Bio-Rad, USA). The expression of GAPDH was used as the internal control.
Stable cell lines
The scrambled shRNA lentivirus and the lentivirus encoding shRNA against Trop2 (GeneCopoeia, China) were transfected into BGC823 cells. Lentivirus-mediated Trop2-cDNA and empty vector were transfected into HGC27 cells. After 48 h, cells were exposed to 0.5 μg/ml puromycin dihydrochloride (#A1113803, Gibco, USA) for 1 week. Puromycin-resistant clones were maintained with 0.25 μg/ml puromycin for 2 weeks. The stable BGC823 cells were named as BGC823-shTrop2 and BGC823-NC, respectively. The stable HGC27 cells were named as HGC27-ovTrop2 and HGC27-NC, respectively.
CCK-8 cell viability assay
Stable cells were plated at a density of 8×10³ cells per well in 96-well tissue culture plates. After adhering, cells were treated with different concentrations of DDP or 5-Fluorouracil (5-FU) for 48 h, and cell viability was detected by use of Cell Counting Kit-8 (CCK-8) reagent (# ck04-500, Dojindo, Japan). The absorbance at 450 nm was measured by Multiskan Spectrum (Thermo, USA).
Flow cytometric detection of apoptosis
Cells were plated in 6-well plates at a density of 5×10⁴ per well. After adhering, BGC823-shTrop2 and BGC823-NC cells were treated with DDP (0.5 μg/ml) or 5-FU (0.5 μg/ml), and HGC27-ovTrop2 and HGC27-NC cells were treated with DDP (1 μg/ml) or 5-FU (0.5 μg/ml) for 48 h. Cells were harvested, washed with PBS, and incubated with the AnnexinV Alexa Fluor647/PI/Apoptosis detection kit (# FMSAV647-050, Fcmacs, China). Results were collected and analyzed using FACS Aria II SORP (BD, USA).
Animal experiments
BGC823-NC or BGC823-shTrop2 (1×10⁶ in 100 μl serum-free RPMI-1640) was injected subcutaneously in female BALB/c mice (4 weeks old) in the oxters. DDP (10 mg/kg) was injected into the tail vein as soon as the average tumor diameter was 5–6 mm. Tumors were measured every 3 days and tumor volume was estimated according to the formula: V=largest diameter×smallest diameter2×0.5 [8]. This study was approved and supervised by the Animal Research Ethics Committees of Nanjing Medical University.
Statistical analysis
All statistical analyses were conducted using the SPSS 19.0 statistical software package (SPSS Inc., USA). Quantitative data are shown as mean values±SD. The t test was used for comparison of 2 groups and one-way ANOVA was used to calculate differences between groups. P<0.05 represents a statistically significant difference.
Results
Knockdown of Trop2 in BGC823 and overexpression of Trop2 in HGC27
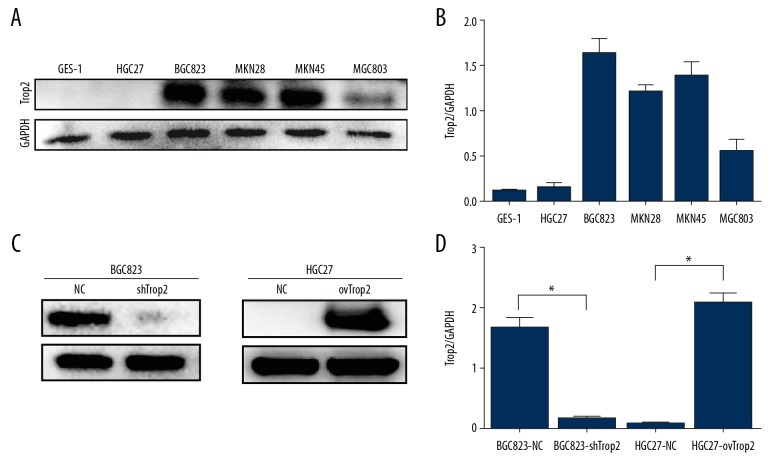
To examine expression levels of Trop2 in different GC cells, Western bolt was performed using the human gastric epithelial cell line GES-1 and gastric cancer cell lines HGC27, BGC823, MKN45, MKN28, and MGC803. Trop2 expressions in HGC27 cells were lower than in other cancer cells, and BGC823 showed a relatively higher Trop2 level (Figure 1A, 1B). To determine the effect of Trop2 on chemotherapy resistance, a lentivirus encoding shRNA against Trop2 was transfected into BGC823 cells, and Trop2 was overexpressed by lentivirus-mediated Trop2-cDNA transfection in HGC27 cells. Western blot analysis confirmed efficient transfection in BGC823 and HGC27 cells (Figure 1C, 1D).
Figure 1.
Trop2 expression in gastric cells and the constructions of stable cell lines. (A, B) Western blot analysis showed that HGC27 cells had relatively low Trop2 expression, and Trop2 protein level in BGC823 cells was higher than in other cell lines. (C, D) BGC823-shTrop2 cells expressed less Trop2 protein than BGC823-NC cells, and HGC27-ovTrop2 cells showed significantly more expression of Trop2 than HGC27-NC cells.
Trop2 promoted proliferation of GC cells treated with anticancer drugs
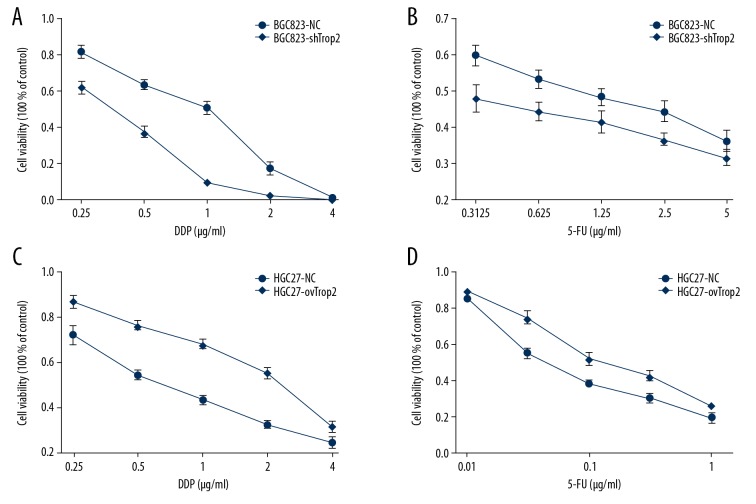
To determine if the expression of Trop2 affects the tolerance of cancer cells to chemotherapeutics, CCK-8 cell proliferation assay was used to detect responses of BGC823-shTrop2 and HGC27-ovTrop2 cells treated with DDP or 5-FU. Compared with control groups, the drug response curves in BGC823-shTrop2 cells were down-shifted (Figure 2A, 2B), and the drug response curves in HGC27-ovTrop2 were up-shifted (Figure 2C, 2D). Results showed that BGC823-shTrop2 cells had a distinctly lower survival rate than BGC823-NC cells, while HGC27-ovTrop2 showed less proliferation inhibition than HGC27-NC cells after treatments with the same drug concentration, indicating that Trop2 decreased the cell proliferation inhibition induced by chemotherapeutic treatments.
Figure 2.
Trop2 dysregulation affected GC cell proliferation inhibition induced by drugs. (A) The IC50 value of DDP in BGC823-shTrop2 cells was 0.355±0.033 μg/ml, lower than that of BGC823-NC (0.701±0.083μg/ml) (P=0.002). (B) BGC823-shTrop2 treated with 5-FU showed a lower IC50 value(0.338±0.253μg/ml) than that of BGC823-NC (1.101±0.470/ml) (P=0.011). (C) The IC50 value of DDP in HGC27-ovTrop2 cells was 2.102±0.274μg/ml, higher than that of HGC27-NC cells (0.749±0.163μg/ml) (P=0.002). (D) HGC27-ovTrop2 cells treated with 5-FU showed a higher IC50 value (0.172±0.038μg/ml) than that of HGC27-NC cells (0.069±0.007/ml) (P=0.01).
Trop2 inhibited chemotherapy-induced cell apoptosis
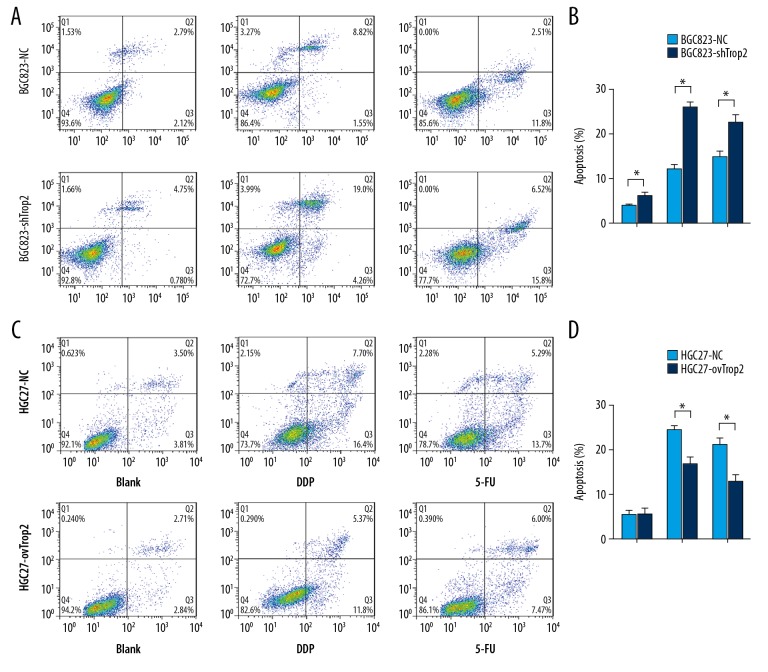
Flow cytometry was performed to determine whether Trop2 knockdown promotes cell apoptosis following treatment with chemotherapeutic drugs. BGC823-shTrop2 and HGC27-ovTrop2 cells were treated with DDP or 5-FU for 48 h. Trop2 knockdown induced slightly more apoptosis, and BGC823-shTrop2 cells showed a significantly higher DDP-induced apoptosis rate than in BGC823-NC cells (Figure 3A, 3B). Trop2 overexpression did not induce less apoptosis when cells were not exposed to the drugs, but HGC27-ovTrop2 cells showed a lower DDP-induced apoptosis rate than that in HGC27-NC cells (Figure 3C, 3D). These results showed that Trop2 not only inhibited cell apoptosis, but also decreased the cell apoptosis induced by chemotherapeutic drugs.
Figure 3.
Trop2 variation regulated GC cell apoptosis after chemotherapy. (A, B) The apoptosis rates of BGC823-NC and BGC823-shTrop2 cells were 3.84±0.635% and 6.31±2.13%, respectively. The apoptosis rates of BGC823-NC and BGC823-shTrop2 exposed to DDP were 11.907±1.571% and 26.407±2.784%, respectively. The apoptosis rates of BGC823-NC and BGC823-shTrop2 exposed to 5-FU were 17.707±2.479% and 22.227±3.822%, respectively. (C, D) The apoptosis rates of HGC27-NC and HGC27-ovTrop2 were 5.533±1.854% and 5.503±2.340%, respectively. The apoptosis rates of HGC27-NC and HGC27-ovTrop2 exposed to DDP were 24.533±1.512% and 16.687±3.222%, respectively. The apoptosis rates of HGC27-NC and HGC27-ovTrop2 exposed to 5-FU were 21.157±2.486% and 12.830±2.923%, respectively. * P<0.05
Knockdown of Trop2 improved the therapeutic effect of DDP in xenograft mice model
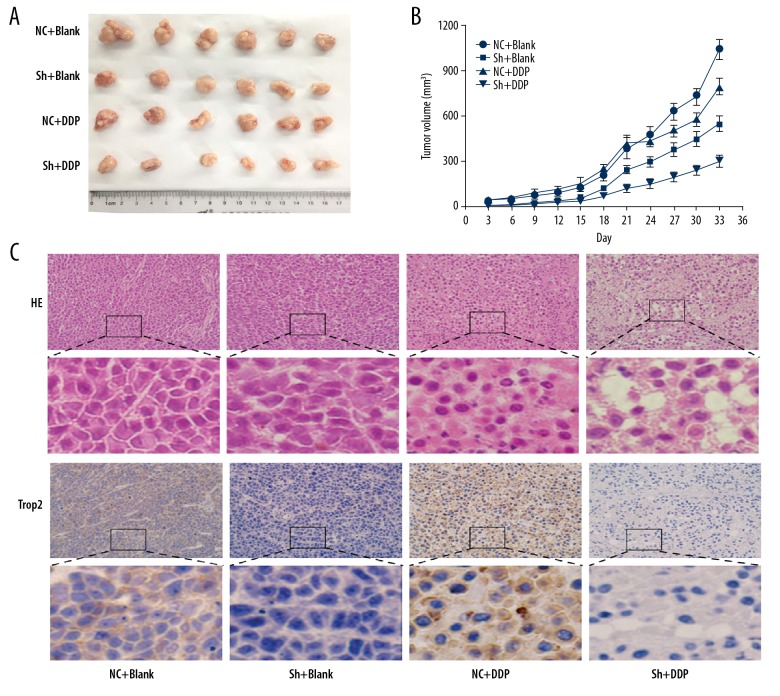
To further explore if Trop2 could influence the curative effect of DDP to GC in vivo, subcutaneous xenograft models were generated. The knockdown of Trop2 suppressed the growth of tumors, and neoplasms in both the control and Trop2 knockdown groups were smaller after chemotherapy (Figure 4A, 4B). However, tumors in the Trop2 knockdown group exhibited more obvious growth inhibition (Figure 4B).
Figure 4.
Downregulation of Trop2 increased drug response to DDP in the xenograft mouse model. (A, B) The growth rate of tumors in mouse models were inhibited after DDP treatment in vivo. The efficacy of chemotherapy was higher in the Trop2-knockdown group. (C) H&E staining of tumor samples showed that morphologic change of cells and more foci of hemorrhage and necrosis appeared after chemotherapy. Especially in the Trop2 knockdown group, greater degrees of vacuolar formation indicated more chemotherapeutic effect. Original widow is ×200, magnified window is ×800.
H&E staining showed that the DDP effect on BGC823-shTrop2 tumors was stronger than that on BGC823-NC xenograft tumors, with more obvious morphologic change of cells and greater degree of vacuolar formation (Figure 4C). These results demonstrated the conclusion we get from in vitro experiments that Trop2 enhanced GC cells tolerance to chemotherapy.
Trop2 promoted expression of MRP1 by Notch1 signaling pathway
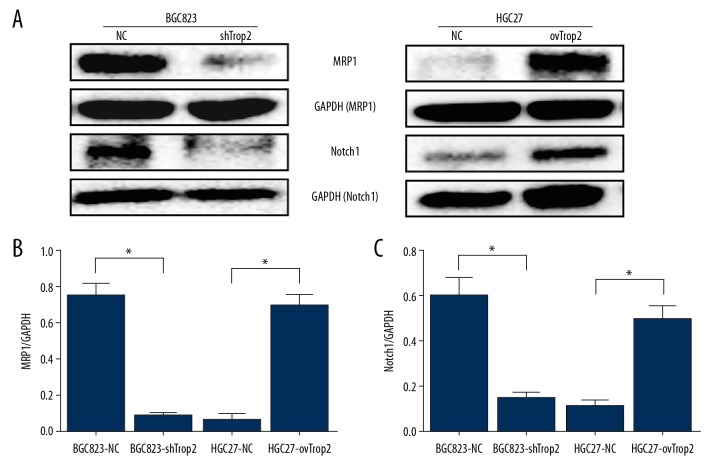
To further explore the molecular mechanism by which Trop2 regulates drug resistance of GC, we assessed the mRNA variation of some drug resistance genes (Supplementary Figure 1), and found the multidrug resistance protein 1 (MRP1) was probably related to Trop2-induced multidrug resistance. Western blot analysis showed that the expression of MRP1 was decreased after Trop2 inhibition, and overexpression of Trop2 promoted the expression of MRP1 (Figure 5). The results suggested that Trop2 enhanced drug resistance in gastric cells by promoting the expression of MRP1.
Figure 5.
Trop2 promoted MRP1 expression by Notch1 signal pathway. (A) Western blot showed that Trop2 knockdown inhibited the expressions of MRP1 and Notch1, and Trop2 overexpression promoted the expressions of MRP1 and Notch1. (B, C) IOD value of Western blot.
To elucidate the signaling mechanism by which Trop2 promotes the expression of MRP1, Western blot analysis was applied to examine variations of the Notch1 signaling pathway upstream of MRP1 [9]. As shown in Figure 5, Trop2 had a positive correlation with the expression of Notch1. These results indicate that Trop2 can stimulate the activation of Notch1, and then alter the downstream protein MRP1.
Discussion
Chemotherapy is a common and important method for perioperative and palliative treatment of GC, but chemoresistance often negatively affects the prognoses of GC patients. The GC drug resistance mechanism includes increasing drug efflux pumps, enhanced metabolism of drugs, intensive DNA damage repair, and variations of drug targets [10]. Comprehensive investigations of the chemoresistance mechanism will undoubtedly contribute to development of anticancer drugs and optimization of chemotherapy regiments.
As a promising prognostic biomarker, Trop2 is reported to be highly expressed in various solid tumors, such as lung cancer [11], cervical cancer [12], pancreatic cancer [13], gallbladder cancer [14], ovarian carcinoma [15], and breast cancer [16]. Mounting evidence suggests that the expression of Trop2 is associated with cancer cell proliferation, migration, and invasion [11,17–20]. Trop2 can alter the level of intracellular calcium, affecting expression of numerous protein and signaling pathways [21]. Trop2 is known to interact with CREB and P27, which are related to resistance to tamoxifen, trastuzumab, and gemcitabine, and may thus be a cause of resistance to these drugs [6,22]. Wang et al. [23] found that Trop2 inhibition could reverse chemotherapy agents-induced immunoresistance in lung cancer cells by the MAPK signaling pathway, but little is known about the role of Trop2 in GC drug resistance.
In this study, in vitro experiments showed that knockdown of the Trop2 expression in BGC823 cells decreased IC50 values of DDP and 5-FU, while overexpression of Trop2 in HGC27 promoted cell proliferation after chemotherapy treatment. A stronger apoptotic response to chemotherapeutic agents was observed in the BGC823-shTrop2 group, and HGC27-ovTrop2 cells treated with DDP or 5-FU showed less apoptosis than in the control group. In vivo experiments showed that DDP had more obvious proliferation inhibition and harmful effect on tumors in the BGC823-shTrop2 group. These results suggest that Trop2 promoted chemoresistance in GC cells.
In assessment of the mechanism by which Trop2 regulates drug resistance, we found that the protein expression of MRP1decreased in BGC823-shTrop2 cells and increased in HGC27-ovTrop2 cells compared with the control group. MRP1 is a member of ATP-binding cassette (ABC) transporter superfamily. MRP1 is widely distributed in normal tissues and organelles, and it can pump out drugs to reduce the intracellular drug concentration, interfering with treatments of epilepsy, depression, and cancer [24–26]. Overexpression of MRP1 in cancer cells is a common mechanism resulting in MDR, and always results in poor prognosis [27–29]. Our results show that Trop2 enhanced the tolerance cancer cells to chemotherapeutics by increasing the expression of MRP1.
To elucidate the signaling pathway regulated by Trop2 in drug resistance, Notch1, the upstream pathway of MRP1, was detected by Western blot, showing that silencing Trop2 inhibited the expression of Notch1, and overexpression of Trop2 showed the opposite results. Human Notch is a transmembrane receptor protein encoded by one of the Notch1–4 genes. The Notch pathway plays a central role in cell differentiation [30], proliferation [31,32], apoptosis [33], metastasis [34], and stem cell maintenance [35]. Knockdown of Notch1 is reported to decrease chemotherapy resistance in cancer [36,37], and Notch1 can increase the expression of MRP1 to promote cancer chemoresistance [38]. In this study, we showed that Trop2 regulated Notch1 signaling to increase the level of MRP1, furtherly reducing cancer cell sensitivity to antitumor drugs.
Conclusions
In summary, our study showed that Trop2 promotes drug resistance of GC by regulating the expression of MRP1. The Notch 1 pathway was involved in Trop2-induced cancer cell drug resistance. Drug resistance is an urgent problem in the clinical treatment of GC. Our findings provided new insight into the role of Trop2 in GC, and targeting Trop2 may be a potential way to overcome MDR when combined with other effective measures.
Supplementary Data
The mRNA variation of drug resistance genes.
Footnotes
Source of support: This project was supported by the National Natural Science Foundation of China (Grant number 81773100)
Conflict of interest
None.
References
- 1.Van CE, Sagaert X, Topal B, et al. Gastric cancer. Lancet. 2016;388:2654–64. doi: 10.1016/S0140-6736(16)30354-3. [DOI] [PubMed] [Google Scholar]
- 2.Yuan D-D, Zhu Z-X, Zhang XIA, Liu JIE. Targeted therapy for gastric cancer: Current status and future directions (Review) Oncol Rep. 2016;35:1245–54. doi: 10.3892/or.2015.4528. [DOI] [PubMed] [Google Scholar]
- 3.Lipinski M, Parks DR, Rouse RV, Herzenberg LA. Human trophoblast cell-surface antigens defined by monoclonal antibodies. Proc Natl Acad Sci USA. 1981;78:5147–50. doi: 10.1073/pnas.78.8.5147. [DOI] [PMC free article] [PubMed] [Google Scholar]
- 4.Zhao W, Zhu H, Zhang S, et al. Trop2 is overexpressed in gastric cancer and predicts poor prognosis. Oncotarget. 2016;7:6136–45. doi: 10.18632/oncotarget.6733. [DOI] [PMC free article] [PubMed] [Google Scholar]
- 5.Vazirigohar A, Houston KD. GPER1-mediated IGFBP-1 induction modulates IGF-1-dependent signaling in tamoxifen-treated breast cancer cells. Mol Cell Endocrinol. 2015;422:160–71. doi: 10.1016/j.mce.2015.11.033. [DOI] [PMC free article] [PubMed] [Google Scholar]
- 6.Pan J, Li X, Wu W, et al. Long non-coding RNA UCA1 promotes cisplatin/gemcitabine resistance through CREB modulating miR-196a-5p in bladder cancer cells. Cancer Lett. 2016;382:64–76. doi: 10.1016/j.canlet.2016.08.015. [DOI] [PubMed] [Google Scholar]
- 7.Shvartsur A, Bonavida B. Trop2 and its overexpression in cancers: Regulation and clinical/therapeutic implications. Genes Canc. 2015;6:84–105. doi: 10.18632/genesandcancer.40. [DOI] [PMC free article] [PubMed] [Google Scholar]
- 8.Ayers GD, Mckinley ET, Zhao P, et al. Volume of preclinical xenograft tumors is more accurately assessed by ultrasound imaging than manual caliper measurements. J Ultrasound Med. 2010;29:891–901. doi: 10.7863/jum.2010.29.6.891. [DOI] [PMC free article] [PubMed] [Google Scholar]
- 9.Cho S, Lu M, He X, et al. Notch1 regulates the expression of the multidrug resistance gene ABCC1/MRP1 in cultured cancer cells. Proc Natl Acad Sci USA. 2011;108:20778–83. doi: 10.1073/pnas.1019452108. [DOI] [PMC free article] [PubMed] [Google Scholar]
- 10.Kartal-Yandim M, Adan-Gokbulut A, Baran Y. Molecular mechanisms of drug resistance and its reversal in cancer. Crit Rev Biotechnol. 2016;36:716–26. doi: 10.3109/07388551.2015.1015957. [DOI] [PubMed] [Google Scholar]
- 11.Li Z, Jiang X, Zhang W. TROP2 overexpression promotes proliferation and invasion of lung adenocarcinoma cells. Biochem Biophys Res Commun. 2016;470:197–204. doi: 10.1016/j.bbrc.2016.01.032. [DOI] [PubMed] [Google Scholar]
- 12.Chu C, Liu J, Zhang H, et al. [Effects of human anti-Trop-2 Fab antibody on biological characteristics of cervical cancer cells]. Journal of Nanjing Medical University (Natural Sciences Edition) 2015;35:320–25. [in Chinese] [Google Scholar]
- 13.Wang H, Liu Q, Tang X, et al. [Eukaryotic expression of human anti-TROP2 antibody IgG and its inhibitory effect on cell proliferation of pancreatic cancer]. Journal of Nanjing Medical University (Natural Sciences Edition) 2014;34:863–69. [in Chinese] [Google Scholar]
- 14.Chen MB, Wu HF, Zhan Y, et al. Prognostic value of TROP2 expression in patients with gallbladder cancer. Tumour Biol. 2014;35:11565–69. doi: 10.1007/s13277-014-2469-9. [DOI] [PubMed] [Google Scholar]
- 15.Xu N, Zhang Z, Zhu J, et al. Overexpression of trophoblast cell surface antigen 2 as an independent marker for a poor prognosis and as a potential therapeutic target in epithelial ovarian carcinoma. Int J Exp Pathol. 2016;97:150–58. doi: 10.1111/iep.12174. [DOI] [PMC free article] [PubMed] [Google Scholar]
- 16.Lin H, Huang J-F, Qiu J-R, et al. Significantly upregulated TACSTD2 and Cyclin D1 correlate with poor prognosis of invasive ductal breast cancer. Exp Mol Pathol. 2013;94:73–78. doi: 10.1016/j.yexmp.2012.08.004. [DOI] [PubMed] [Google Scholar]
- 17.Cubas R, Sheng Z, Min L, et al. Trop2 expression contributes to tumor pathogenesis by activating the ERK MAPK pathway. Mol Cancer. 2010;9:253. doi: 10.1186/1476-4598-9-253. [DOI] [PMC free article] [PubMed] [Google Scholar]
- 18.Li X, Teng S, Zhang Y, et al. TROP2 promotes proliferation, migration and metastasis of gallbladder cancer cells by regulating PI3K/AKT pathway and inducing EMT. Oncotarget. 2017;8:47052–63. doi: 10.18632/oncotarget.16789. [DOI] [PMC free article] [PubMed] [Google Scholar]
- 19.Wu B, Yu C, Zhou B, et al. Overexpression of TROP2 promotes proliferation and invasion of ovarian cancer cells. Exp Ther Med. 2017;14(3):1947–52. doi: 10.3892/etm.2017.4788. [DOI] [PMC free article] [PubMed] [Google Scholar]
- 20.Trerotola M, Jernigan DL, Liu Q, et al. Trop-2 promotes prostate cancer metastasis by modulating beta(1) integrin functions. Cancer Res. 2013;73:3155–67. doi: 10.1158/0008-5472.CAN-12-3266. [DOI] [PMC free article] [PubMed] [Google Scholar]
- 21.Ripani E, Sacchetti A, Corda D, Alberti S. Human Trop-2 is a tumor-associated calcium signal transducer. Int J Cancer. 1998;76:671–76. doi: 10.1002/(sici)1097-0215(19980529)76:5<671::aid-ijc10>3.0.co;2-7. [DOI] [PubMed] [Google Scholar]
- 22.Wu M, Liu L, Chan C. Identification of novel targets for breast cancer by exploring gene switches on a genome scale. BMC Genomics. 2011;12:547. doi: 10.1186/1471-2164-12-547. [DOI] [PMC free article] [PubMed] [Google Scholar]
- 23.Wang X, Long M, Dong K, et al. Chemotherapy agents-induced immunoresistance in lung cancer cells could be reversed by trop-2 inhibition in vitro and in vivo by interaction with MAPK signaling pathway. Cancer Biol Ther. 2013;14:1123–32. doi: 10.4161/cbt.26341. [DOI] [PMC free article] [PubMed] [Google Scholar]
- 24.Lee SH, Lee MS, Lee JH, et al. MRP1 polymorphisms associated with citalopram response in patients with major depression. J Clin Psychopharmacol. 2010;30:116–25. doi: 10.1097/JCP.0b013e3181d2ef42. [DOI] [PubMed] [Google Scholar]
- 25.Sun Y, Luo X, Yang K, et al. Neural overexpression of multidrug resistance-associated protein 1 and refractory epilepsy: A meta-analysis of nine studies. Int J Neurosci. 2015;126:308–17. doi: 10.3109/00207454.2015.1015724. [DOI] [PubMed] [Google Scholar]
- 26.Lu JF, Pokharel D, Bebawy M. MRP1 and its role in anticancer drug resistance. Drug Metab Rev. 2015;47:406–19. doi: 10.3109/03602532.2015.1105253. [DOI] [PubMed] [Google Scholar]
- 27.Choi YH, Yu A-M. ABC transporters in multidrug resistance and pharmacokinetics, and strategies for drug development. Curr Pharm Des. 2014;20:793–807. doi: 10.2174/138161282005140214165212. [DOI] [PMC free article] [PubMed] [Google Scholar]
- 28.Vulsteke C, Lambrechts D, Dieudonne A, et al. Genetic variability in the multidrug resistance associated protein-1 (ABCC1/MRP1) predicts hematological toxicity in breast cancer patients receiving (neo-)adjuvant chemotherapy with 5-fluorouracil, epirubicin and cyclophosphamide (FEC) Ann Oncol. 2013;24:1513–25. doi: 10.1093/annonc/mdt008. [DOI] [PubMed] [Google Scholar]
- 29.Ohashi R, Kawahara K, Namimatsu S, et al. Expression of MRP1 and ABCG2 is associated with adverse clinical outcomes of the papillary thyroid carcinoma with a solid component. Hum Pathol. 2017;67:11–17. doi: 10.1016/j.humpath.2017.03.012. [DOI] [PubMed] [Google Scholar]
- 30.Chu D, Wang W, Xie H, et al. Notch1 expression in colorectal carcinoma determines tumor differentiation status. J Gastrointest Surg. 2008;13:253–60. doi: 10.1007/s11605-008-0689-2. [DOI] [PubMed] [Google Scholar]
- 31.Jundt F, Anagnostopoulos I, Forster R, et al. Activated Notch1 signaling promotes tumor cell proliferation and survival in Hodgkin and anaplastic large cell lymphoma. Blood. 2002;99:3398–403. doi: 10.1182/blood.v99.9.3398. [DOI] [PubMed] [Google Scholar]
- 32.Purow BW, Haque RM, Noel MW, et al. Expression of Notch-1 and its ligands, Delta-Like-1 and Jagged-1, is critical for glioma cell survival and proliferation. Cancer Res. 2005;65:2353–63. doi: 10.1158/0008-5472.CAN-04-1890. [DOI] [PubMed] [Google Scholar]
- 33.Lu CJ, He YF, Yuan WZ, et al. Dihydromyricetin-mediated inhibition of the Notch1 pathway induces apoptosis in QGY7701 and HepG2 hepatoma cells. World J Gastroenterol. 2017;23:6242–51. doi: 10.3748/wjg.v23.i34.6242. [DOI] [PMC free article] [PubMed] [Google Scholar]
- 34.Zhong Y, Shen S, Zhou Y, et al. NOTCH1 is a poor prognostic factor for breast cancer and is associated with breast cancer stem cells. Onco Targets Ther. 2016;9:6865–71. doi: 10.2147/OTT.S109606. [DOI] [PMC free article] [PubMed] [Google Scholar]
- 35.Upadhyay P, Nair S, Kaur E, et al. Notch pathway activation is essential for maintenance of stem-like cells in early tongue cancer. Oncotarget. 2016;7:50437–49. doi: 10.18632/oncotarget.10419. [DOI] [PMC free article] [PubMed] [Google Scholar]
- 36.Ye QF, Zhang YC, Peng XQ, et al. Silencing Notch-1 induces apoptosis and increases the chemosensitivity of prostate cancer cells to docetaxel through Bcl-2 and Bax. Oncol Lett. 2012;3:879–84. doi: 10.3892/ol.2012.572. [DOI] [PMC free article] [PubMed] [Google Scholar]
- 37.Qu J, Wang Y, Yang Y, Liu J. Targeting Notch-1 reverses cisplatin chemosensitivity in ovarian cancer cells by upregulation of PUMA. Int J Clin Exp Med. 2017;10:7785–95. [Google Scholar]
- 38.Liu C, Li Z, Bi L, et al. NOTCH1 signaling promotes chemoresistance via regulating ABCC1 expression in prostate cancer stem cells. Mol Cell Biochem. 2014;393:265–70. doi: 10.1007/s11010-014-2069-4. [DOI] [PubMed] [Google Scholar]
Associated Data
This section collects any data citations, data availability statements, or supplementary materials included in this article.
Supplementary Materials
The mRNA variation of drug resistance genes.


