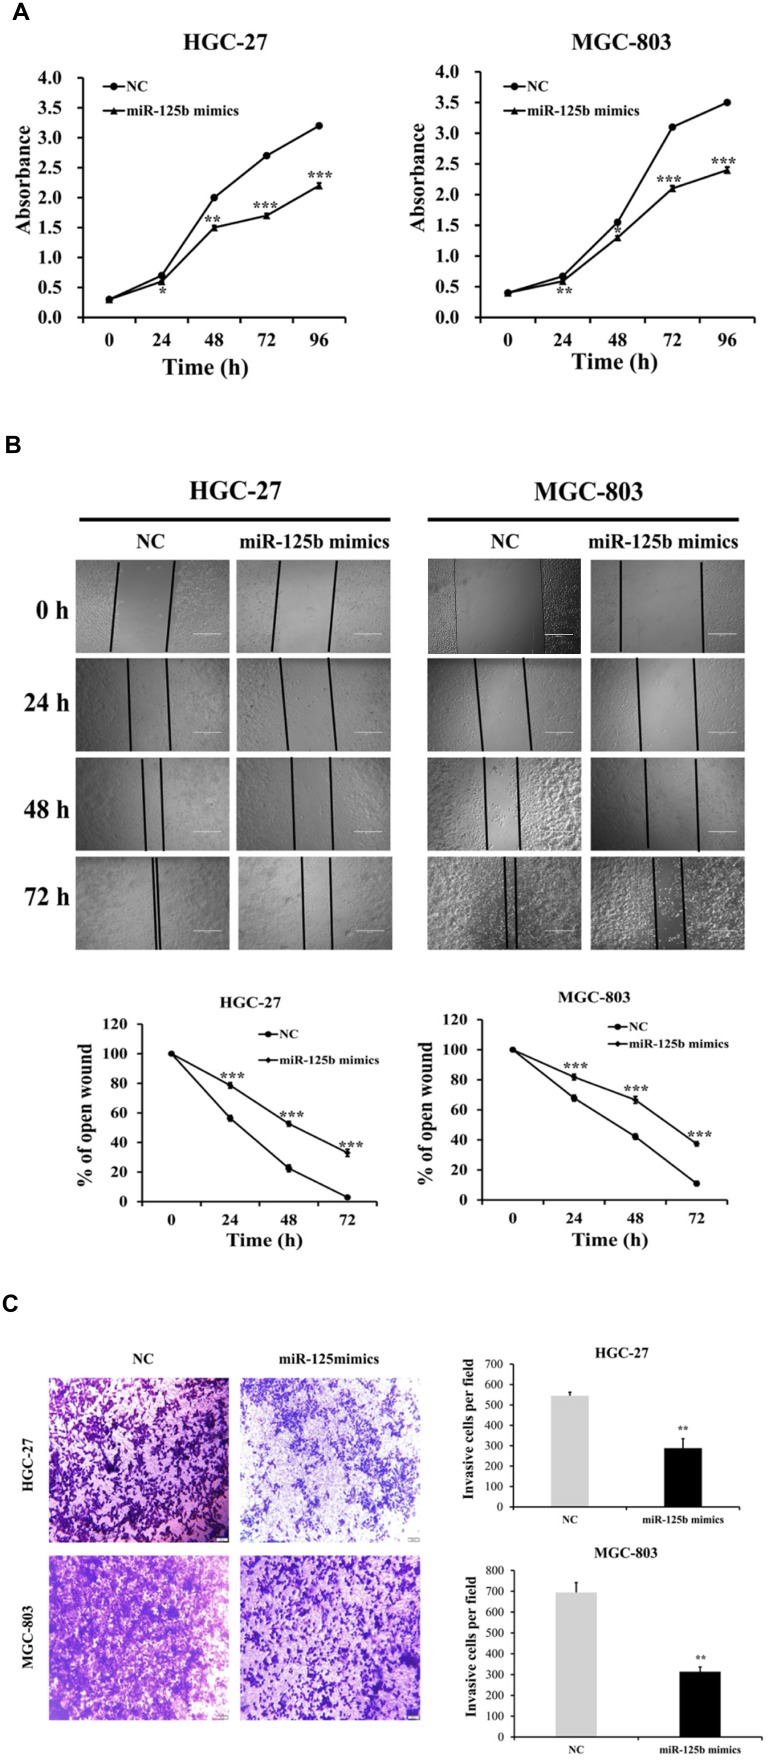
This article has been corrected: Due to errors in figure processing, the image in miR-125b mimics group at 0h is exactly the same as the NC group in Figure 5B. The corrected Figure 5B is attached. The authors declare that these corrections do not change the results or conclusions of this paper.
Original article: Oncotarget. 2018; 9:2105–2119. 2105-2119. https://doi.org/10.18632/oncotarget.23249
Figure 5. miR-125b expression levels inhibited the proliferation, migration and invasion abilities of HGC-27 and MGC-803 cells.
(A) In miR-125b overexpression experiment, the data indicated that both the proliferation of HGC-27 and MGC-803 cells in miR-125b mimics groups were evidently retarded compared with control group. (B) The wound-healing assay showed that HGC-27 and MGC-803 cells migration in miR-125b mimics groups were inhibited compared with the control groups. (C) The matrigel invasion assay also displayed the suppression in miR-125b mimics groups compared with the control groups. Error bars symbolized standard deviation were obtained from three independent experiments and all the data were shown as mean ± SD. All scale bars in Figure B and Figure C are 200 μm and 500 μm, respectively. NC, negative control; h, hour; *, P < 0.05; **, P < 0.01; ***, P < 0.001.


