Abstract
Physician stress, and resultant consequences such as burnout, have become increasingly recognized pervasive problems, particularly within the specialty of Emergency Medicine. Stress is difficult to measure objectively, and research predominantly relies on self-reported measures. The present study aims to characterize digital biomarkers of stress as detected by a wearable sensor among Emergency Medicine physicians. Physiologic data were continuously collected using a wearable sensor during clinical work in the emergency department, and participants were asked to self-identify episodes of stress. Machine learning algorithms were used to classify self-reported episodes of stress. Comparing baseline sensor data to data in the 20-minute period preceding self-reported stress episodes demonstrated the highest prediction accuracy for stress. With further study, detection of stress via wearable sensors could be used to facilitate evidence-based stress research and just-in-time interventions for emergency physicians and other high-stress professionals.
1. Introduction
Emergency Medicine (EM) physicians care for high acuity patients in a variety of difficult working conditions and have demonstrated significantly higher levels of stress than other medical specialties (Bragard, Dupuis, and Fleet 2015). Multiple factors inherent to EM contribute to this including fluctuating work schedules, pressure to rapidly make critical decisions, volume of cases, exposure to violence, death of patients, and academic responsibilities. A long-term consequence of physician stress, known as “burnout”, has increasingly become a recognized critical issue within the health care system. In 1981, Maslach and Jackson defined burnout as “a syndrome of emotional exhaustion and cynicism” (Maslach and Jackson 1981) which prompted three decades of research on the topic. In physicians, this phenomenon is associated with increased medical errors, depression, substance abuse, mental health issues, early retirement, and an alarming rate of suicide (Drummond 2015; Williams et al. 2007). The current estimate of burnout among United States physicians is estimated at a staggering 50% (Lall et al. 2019; Rothenberger 2017).
Burnout is a multifactorial problem that is difficult to address due to its subjective nature. Individual variations in physician life circumstances, work environments, patient populations, and daily life choices, all influence day-to-day perceptions of stress and well-being. A study evaluating Emergency Medicine physicians and nursing staff found that burnout was associated with increased cognitive and emotional demands, and was coupled with decreases in freedom at work, social support, sense of coherence, and mental health (Ilic et al. 2017). Since these underlying stressors seem to be individualized and numerous, evidence-based recommendations for stress detection and intervention have been limited. A 2016 meta-analysis reviewed 52 studies that looked at structural changes to the work environment and individuals focused interventions. Structural level interventions included shortening shifts, shortening physician rotation times, and unspecified clinical work process modifications. In contrast, individual interventions included facilitated small group curricula, stress management, self-care training, communication skills training, and mindfulness exercises as a means to reduce physician burnout (West et al. 2016). While many of these studies saw a decrease in burnout as measure by a self-administered questionnaire (Maslach Burnout Inventory), we currently lack evidence-based guidelines to determine which interventions would most benefit an individual physician, and which could be effectively deployed in various physician work environment.
Wearable sensors have the potential to provide individualized, objective correlates of stress. These non-invasive devices can collect physiologic changes indicative of sympathetic nervous system (SNS) activity (such as heart rate, electrodermal activity (EDA), skin temperature, electromyography (EMG), and accelerometry) and correlate them with emotional state. Several published studies have explored the use and feasibility of wearable sensors when studying human emotion (Fletcher et al. 2011; Adams et al. 2014; Healey and Picard 2005; Hui and Sherratt 2018). Multiple investigators have specifically evaluated the utility of mobile sensors to detect stress in both controlled and natural environments (Sano et al. 2018; Garcia-Ceja, Osmani, and Mayora 2016). For example, Hui et al., used a controlled environment with audiovisual headsets to evoke specific emotional responses by providing controlled stimuli and found that EDA, heart rate, and skin temperature to be the most useful for detection of emotional response (Hui and Sherratt 2018). Multiple investigators have specifically evaluated the utility of mobile sensors to detect stress in both controlled and natural environments (Sano et al. 2018; Garcia-Ceja, Osmani, and Mayora 2016). Once optimized, sensor-based stress detection strategies can be used to direct interventions to reduce the negative impacts of stress and improve overall emotional health. For example, recognition of stress via a wearable sensor could be used to trigger cognitive behavioral therapy (CBT)-style interventions via a mobile phone application, as has been proposed in other populations (Fletcher et al. 2011).
While strides have been made to use wearable sensors to identify stress in highly controlled environments, limited evidence exists for the application of these technologies to “real world” settings. Liu et al., used a wearable wrist-based sensor to study stress in patients with dementia by correlating staff logs of perceived patient stress/anxiety with wearable sensor data. The investigators found that participants had unique baseline biometric patterns, and that deviations from baseline correlated with observer-reported stress and anxiety (Liu et al. 2018). While these objective measures of stress are promising, the highly controlled nature of such studies limit generalizability.
Interventions designed to combat stress in physicians have been shown to be beneficial in reducing negative consequences (Panagioti et al. 2017), but optimal targets for these interventions are unclear. While periods of objectively detected stress in Emergency Medicine physicians are an attractive target for such interventions, characteristics of the work environment create barriers to the application of stress detection data from more controlled environments. By the nature of their work environment, Emergency Medicine physicians are subject to rapid fluctuations in physical activity and a high baseline level of stress, both which may create challenges for detection paradigms. As an initial step, the present study seeks to determine if physiologic features obtained from a wearable sensor worn by EM physicians during clinical work can detect episodes of stress in this dynamic environment.
2. Methods
2.1. Study Design
This was a prospective observational study approved by the Institutional Review Board of the authors’ institution. Participants were board-certified Emergency Medicine attending (supervising) physicians in a large, urban tertiary care hospital emergency department (ED).
2.2. Hardware
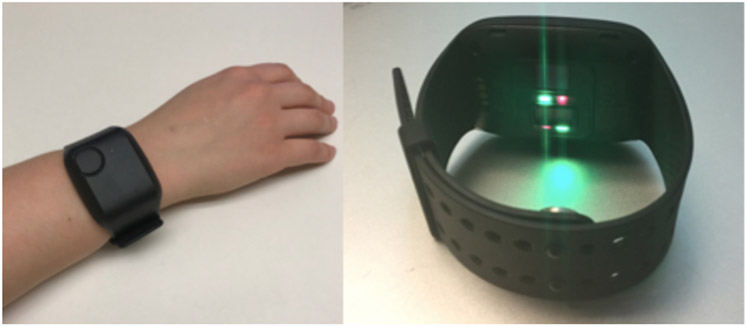
The E4 (Empatica, Milan, Italy), a water-resistant research-grade device, was used for biometric data collection (Figure 1). The device continuously detects and records three dimensional accelerometry, EDA, skin temperature, and heart rate variability. Data was stored in the sensor’s on-board integrated memory until downloaded to a Health Insurance Portability and Accountability Act (HIPAA)-compliant cloud-based server.
Figure 1:
Empatica E4
2.3. Study Protocol
Enrolled participants were asked to wear the E4 on their non-dominant wrist during a total of nine clinical shifts worked in the ED (typically 8-10 hours in duration), over a six-month time period. The collection of data over a prolonged period was employed to mitigate any effect of seasonal changes in baseline stress levels in the work environment. Participants were asked to use the device’s event marker button to annotate any perceived episodes of stress.
2.4. Biometric Data Collection
Data from the E4 was collected continuously during wear. Accelerometry (in units g) was recorded in three axes (x, y, and z axes) at a rate of 32 Hz. Skin temperature (in degrees Celsius) was sampled at a rate of 4 Hz. Electrodermal activity (in microSiemens) was sampled at a rate of 4 Hz. Heart rate (in beats per minute) was obtained via photoplethysmography sensors (PPG) at a sampling frequency of 64 Hz. Event annotations tagged by participants were recorded in a separate time-stamped data file. Empatica software products (Empatica Manager and Empatica Connect) were used for graphical and numerical data acquisition from the E4 device.
2.5. Non-Biometric Data Collection
Demographic data, including ratings of overall job satisfaction and perceived daily level of stress, were collected via a brief paper survey upon study enrollment. Given the subjective nature of emotional states and variation in scenarios that elicit diverse emotional states between individuals (Hui and Sherratt 2018), we used self-reporting as a mechanism to identify periods of stress. Participants were asked to keep a written log with short descriptions of stressful events that they tagged during their shifts. Upon completion of each recorded shift, participants were also asked to complete a brief questionnaire regarding use of the device and overall perceived stress throughout the shift.
2.6. Biometric Data Segmentation
2.6.1. Pre and Post-Stress Segments.
Using the accelerometer, EDA, and heart rate data generated during the data collection period, two 20-minute segments of the data were extracted for each stress event recorded. One 20-minute segment was taken immediately before the stress event annotation (pre-stress), and one 20-minute segment was taken immediately following the stress event annotation (post-stress). In total, 111 20-minute intervals were collected for the post-stress event dataset, and 108 20-minute intervals were collected for the pre-stress event dataset. Some pre and post-stress event segments were not collected for use during machine learning classification, since these segments overlapped with the beginning, end, or invalid (device removal) sections of the signal data.
2.6.2. Baseline Segment.
The baseline dataset was generated by extracting 20-minute data segments from the accelerometer, EDA, and heart rate data during periods where no stress events were reported or suspected. The selection of the start points for these 20-minute intervals was arbitrary, as long as the start points were over an hour before or after a stress event and did not overlap with the start, end, or invalid periods of the signal. Segments from sessions free of stress events were also utilized in the determination of baseline data. In total, 86 baseline intervals were collected.
2.7. Feature Extraction
MATLAB (MathWorks, Natick, MA) was used to fit the instantaneous amplitudes of each participant’s biometric data during the 20-minute segments to a distribution and calculate each segment’s multiscale entropy (MSE) (Costa, Goldberger, and Peng 2005) to test if the MSE and distribution mean, variance, shape, scale, and D ([Shape2 + Scale2]0.5) parameters could be used to detect stress events. Specifically, the data for each 20-minute interval was centered around the mean of the data, and the Hilbert transform (S 1996) was applied to each of these adjusted 20-minute intervals to generate a centered analytic signal (Chintha et al. 2018). The magnitude of the analytic signal’s data points was taken to generate the amplitudes for each point along the signal. These amplitudes were distributed in a similar manner to that of a gamma distribution, hence this data was fitted to a gamma distribution by determining the distribution’s shape and scale parameters. These values were then used to calculate the distribution’s mean, variance, and D values. The MSE value was calculated using the untransformed data for each 20-minute interval.
2.8. Machine Learning Classification Determination
2.8.1. Classification Cases and Parameters.
Using the MATLAB Classification Learner application, three binary classification cases were tested to determine if any of the supported classification models could accurately classify the data for each case. The three cases were: pre-stress event vs post-stress event, baseline vs pre-stress event, and baseline vs post-stress event. For each case, there were five sensor signals analyzed: the accelerometer x-axis (ACC-X), y-axis (ACC-Y), and z-axis signals (ACC-Z), the electrodermal activity sensor signal (EDA), and the heart rate signal (HR). For each of these signals, there were six features used to represent them: the distribution mean, variance, shape, scale, and D parameters, and the MSE value. This resulted in a total of 30 features that could be used to train the 25 models supported by the Classification Learner application. These models fall into the following categories: decision trees, discriminant analysis, logistic regression, naïve Bayes classifiers, support vector machines, nearest neighbor classifiers, and ensemble classifiers.
2.8.2. Classifier Train/Test Method.
Due to the limited size of the dataset, it was not split into testing and training sets. Alternatively, 10-fold cross validation was applied to the entire dataset in order to prevent overfitting the data. This validation process split the randomized dataset into 10 folds, each containing 10% of the dataset. The classifiers were then trained on nine of the folds and tested on the last fold. This process was repeated until each fold was used to test the model, and the resulting classifier’s test error was the average of each of the 10 trained models.
2.8.3. Feature Selection.
The process of selecting features to use during classifier training utilized brute-force feature selection (Rudnicki, Wrzesień and Paja 2015). This method is characterized by adding and removing features one at a time until some of the models’ validation accuracies improve.
2.9. Event Annotation Data Analysis
Thematic analysis was used to code and analyze descriptions of stressful events noted on participant logs. The coding structure was first developed based on deductive codes from the anticipated responses and then inductive codes from review of the annotations themselves. Once the coding scheme was developed, the event logs were coded by two investigators (EK, SC).
3. Results
3.1. Participant Characteristics and Protocol Compliance
Eight participants were enrolled and completed the entire the study protocol (Table 1). Mean age of the sample was 42.9 years (range 34-60 years), and fifty percent of the sample identified as female. Participants reported a mean job satisfaction score of 4.1 (on 1-5 Likert scale with 5 being the highest satisfaction) and reported their mean daily stress level at 3 (on 1-5 Likert scale with 5 being the highest level of daily stress). All participants were married and reported a mean daily work commute of 1.4 hours (range 0.5-2.5 hours).
Table 1.
Study participant characteristics and participation
| Subject | Age | Sex | Total Minutes of Recorded Data |
# of Event Annotations |
|---|---|---|---|---|
| 1 | 38 | F | 4,550 | 10 |
| 2 | 34 | F | 5,483 | 20 |
| 3 | 42 | F | 4,233 | 6 |
| 4 | 48 | M | 5,016 | 21 |
| 5 | 44 | M | 4,563 | 26 |
| 6 | 60 | F | 4,117 | 26 |
| 7 | 40 | M | 4,440 | 4 |
Participants collected an average of 4,582 minutes of data over the duration of the study. Mean number of events tagged per participant were 15 (range 4-26 events). Four sessions (5.5%) were incomplete due to unintentional noncompliance (e.g. participant forgot to power the sensor on at the beginning of the shift, participant turned off the sensor prematurely).
3.2. Machine Learning
3.2.1. Pre-Stress Event Vs Post-Stress Event Analysis.
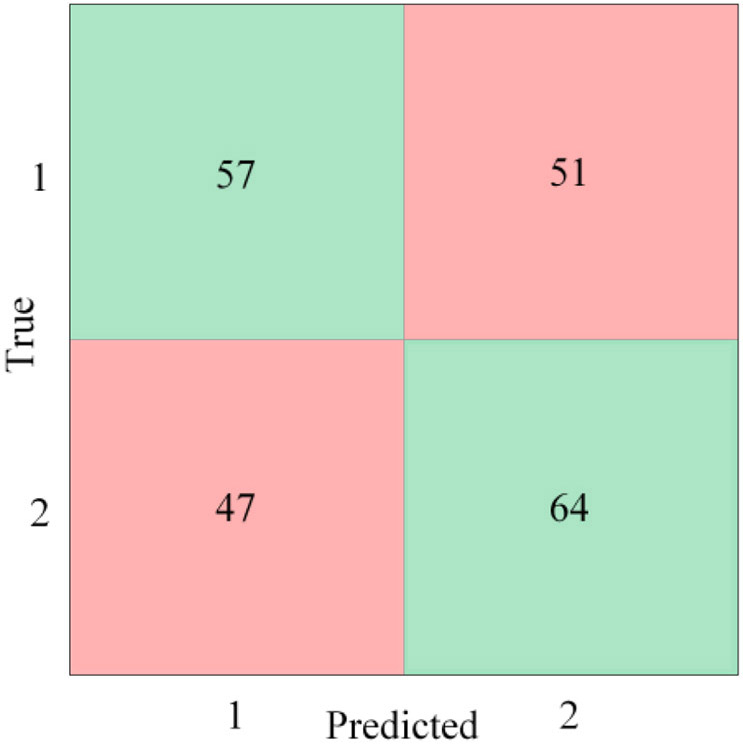
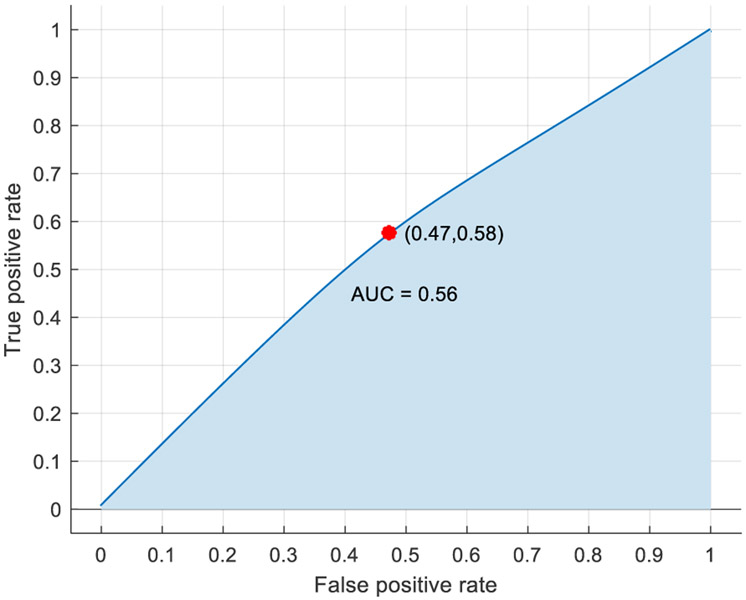
For this analysis, the pre-stress event cases were designated as class 1, while the post-stress event cases were designated as class 2. After multiple feature combinations were tested, a linear discriminant model, trained using the features included in Table 2, provided the highest accuracy rating without being overwhelmingly biased to classify one class over the other. The confusion matrix in Figure 2 shows the number of events correctly (green) and incorrectly (red) classified for each class. Designating the post-stress events as the positive case, the model’s sensitivity (percentage of true positive cases correctly classified) and specificity (percentage of true negative cases correctly classified) were 58% and 53% respectively, while the model’s positive predictive value (percentage of all positive predictions correctly classified) and negative predictive value (percentage of all negative predictions correctly classified) (Parikh et al. 2008) were 56% and 55% respectively. Overall, the model’s accuracy was 54.8%, and the performance of the model is represented graphically by the receiver operating characteristic (ROC) curve with an area under the curve (AUC) of 0.56 (Figure 3). The AUC performance metric can range between 0 and 1, with 1 being ideal.
Table 2.
Features used to train final pre-stress vs post-stress event analysis model
| Data Source | Features |
|---|---|
| ACC-X | Mean, Variance, Shape, Scale, D |
| ACC-Y | Mean, Variance, Scale |
| ACC-Z | Mean, Variance, Shape, Scale |
| EDA | Variance, Shape, Scale, MSE |
| HR | Mean, Shape, Scale, MSE |
Figure 2.
Pre-stress event vs post-stress event confusion matrix
Figure 3.
Pre-stress event vs post-stress event ROC curve
3.2.2. Baseline Vs Pre-Stress Event Analysis.
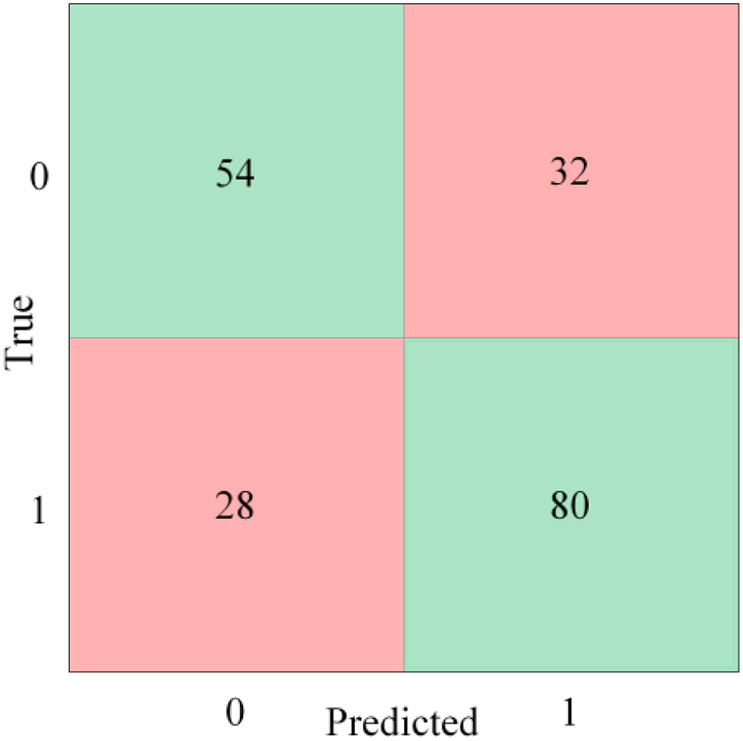
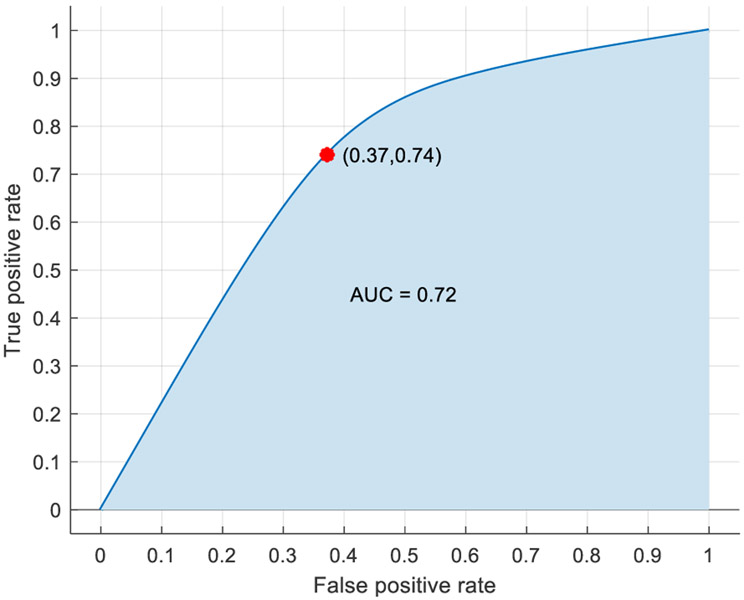
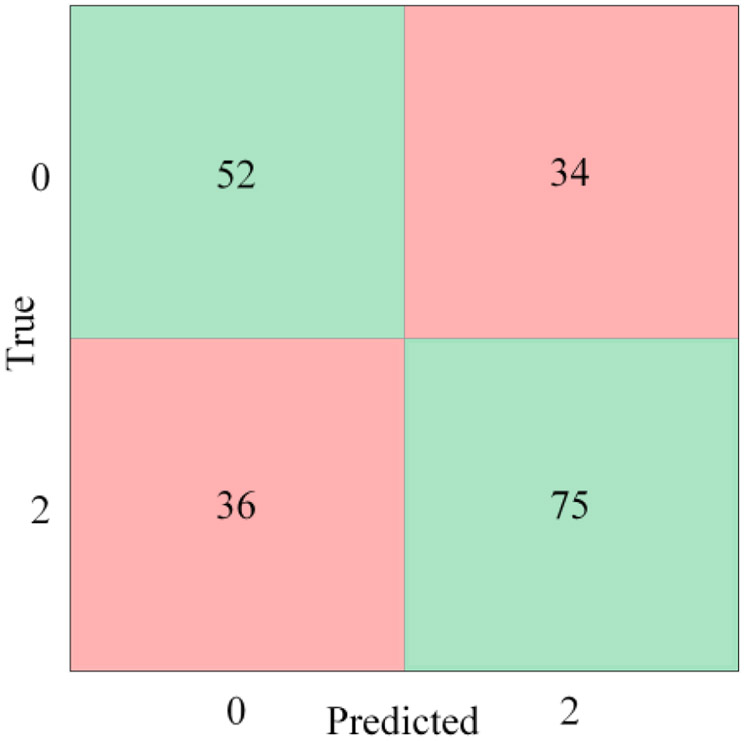
For this analysis, the baseline cases were designated as class 0, while the pre-stress event cases were designated as class 1. After multiple feature combinations were tested, a bagged trees model, trained using the features included in Table 3, provided the highest accuracy rating without being overwhelmingly biased to classify one class over the other (Figure 4). Designating the pre-stress events as the positive case, the model’s sensitivity and specificity were 74% and 63% respectively, while the model’s positive predictive value and negative predictive value were 71% and 66% respectively. Overall, the model’s accuracy was 69.1%, and the performance of the model was represented graphically by the ROC curve with an AUC of 0.72 (Figure 5).
Table 3.
Features used to train final baseline vs pre-stress event analysis model
| Data Source |
Features |
|---|---|
| ACC-X | Mean, Variance, Shape, Scale |
| ACC-Y | Mean, Variance, Shape, Scale |
| ACC-Z | Mean, Variance, Shape, Scale |
| EDA | Variance, Shape, Scale, MSE |
| HR | Mean, Scale, D, MSE |
Figure 4.
Baseline vs pre-stress event confusion matrix
Figure 5.
Baseline vs pre-stress event ROC curve
3.2.3. Baseline vs Post Stress Event Analysis.
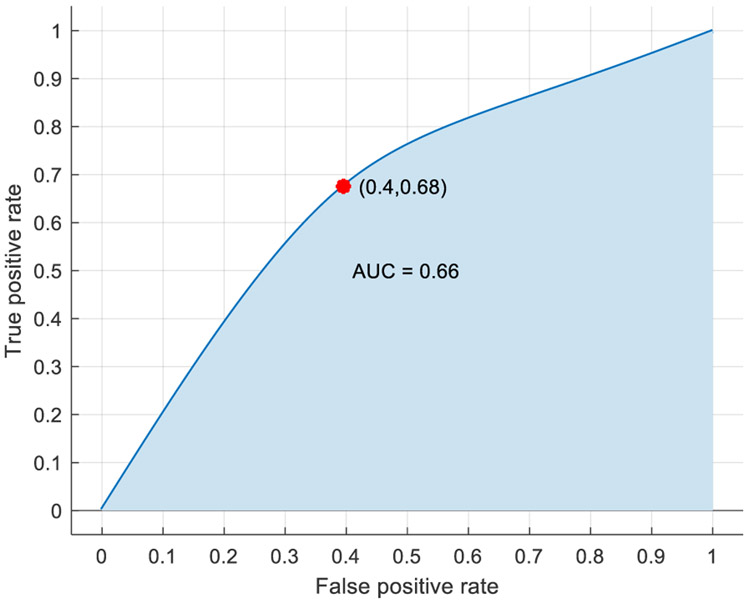
For this analysis, the baseline cases were designated as class 0, while the post-stress event cases were designated as class 2. After multiple feature combinations were tested, a kernel naïve Bayes model, trained using the features included in Table 4, provided the highest accuracy rating without being overwhelmingly biased to classify one class over the other (Figure 6). Designating the post-stress events as the positive case, the model’s sensitivity and specificity were 68% and 60% respectively, while the model’s positive predictive value and negative predictive value were 69% and 59% respectively. Overall, the model’s accuracy was 64.5%, and the performance of the model was represented graphically by the ROC curve with an AUC of 0.66 (Figure 7).
Table 4.
Features used to train final baseline vs post-stress event analysis model
| Data Source | Features |
|---|---|
| ACC-X | Mean, Variance, Shape, Scale, D |
| ACC-Y | Mean, Variance, Shape, Scale |
| ACC-Z | Mean, Variance, Shape, Scale, D |
| EDA | Mean, Variance, D, MSE |
| HR | Mean, Shape, MSE |
Figure 6.
Baseline vs post-stress event confusion matrix
Figure 7.
Baseline vs post-stress event ROC curve
3.3. Content Analysis of Event Annotations
Based on the written logs provided by participants, several themes arose regarding descriptions of self-reported stress events, including patient interactions, encounters with patient family members, co-worker interactions, performance of complex procedures, caring for critically ill patients, physical discomfort, and systems issues. The breakdown of events in each category and illustrative quotes are outlined in Table 5.
Table 5.
Themes of event annotations
| Theme | # of tags |
Illustrative Quotes |
|---|---|---|
| Patient/Family Interactions | 22 |
“Agitated patient-threatened to murder provider”
“Crazy patient. Restraints, police, drugs [sedation] necessary” “Mentally challenged patient yelling at me while his staff member tells me she doesn’t want to take him home” |
| Coworker Interactions | 23 |
“Stressful phone call – arguing with consultant”
“Same intern asked 4 times how Tylenol [acetaminophen] is dosed” “Social worker interrupted conversation, was rude to patients” |
| Performance of Complex Medical Procedures | 9 |
“Difficult intubation” [Trouble placing a breathing tube]
“Stressful central line [Large catheter in the major veins of the body] placement” |
| Critically Ill Patients | 21 |
“STEMI [heart attack] coming…and septic [severe infection] patient”
“Pediatric trauma, stroke activation, and STEMI [heart attack] activation simultaneously” “Patient screaming/vomiting/decompensating, concern for ICH [intracranial bleeding]”. |
| Physical discomfort | 4 |
“Need to eat/use bathroom – too busy”
“I feel palpitations after getting belly pain. [My] kid’s sick with belly aches. I’m thinking I have it too” |
| Systems issues | 21 |
“[ the electronic medical record) is slow again”
“Can’t get into [radiograph image digital review system] or [Microsoft] outlook, intern also can’t get into [radiograph image digital review system]” “I was infuriated with IT and let them know it…”. |
| Other Category/No description | 22 |
4. Discussion
Our data from this pilot study suggest that specific features in wearable sensor data can be used to identify EM physician stress in the clinical environment. Overall, participants were accepting of a wearable sensor to tag stress events during their clinical practice. All participants successfully wore the sensors and recorded sessions during clinical shifts, and there was only a 5% incidence of failure to capture complete data. Using a variety of machine leaning approaches, the best algorithm to detect stress compared to baseline data utilized the data collected twenty minutes prior to a reported stress episode (accuracy of approximately 70%); this suggested that wearable sensors can detect stress before it is reported or even recognized by the individual.
The best performing classification scheme was to use the pre-stress (or more accurately the “pre-annotation”) state compared to baseline, which is intuitively logical. This time likely represented a period of building physiologic stress, where the time of annotation represents when the participant actually recognized the stress. In other words, we suspect that when participants were experiencing a stressful event, the initial focus would be on the situation at hand. Subsequently, they would become consciously aware of their emotional state and engage with the sensor to annotate. Furthermore, ED shifts may represent a period of somewhat chronic stress; the baseline in the ED may not be what and individual’s baseline measurement outside the ED would be. This “elevated baseline” may make detection more difficult by decreasing the delta.
Content analysis of the event annotations confirmed somewhat expected, largely environmental issues that correlate with the detected stress episodes and make emergency physicians an excellent population to target for just-in-time stress reduction interventions. As discussed in the results above, emergency physicians interact with a variety of patients, family members, and other professionals in a rapid fire, high stakes environment. Caring for critically ill patients, exposure to hostility and violence, technical difficulties with electronic medical record systems, and negotiation of an inefficient health care system all contribute to personal stress, while the constant need to multitask amplifies the stress associated with any one of these scenarios. In the future, content analysis could be used to identify stressors and to validate theorized/anecdotal stressors on an individual and institutional level with objective data. These could then be targets for workplace interventions and process improvements geared towards decreasing the number of stress inducing factors in the work environment. The process of identifying and addressing modifiable stressors in an evidenced based fashion has the potential to bring about meaningful change that directly reduces physician stress.
In addition to data gathering and intervention planning, the stress identifying algorithm built through this process offers a means of identifying physician stress in real time. Even while participating in a study that presumably increased awareness of stress, our data suggests that participants may have had a delayed recognition of the stress state. Early recognition would provide a prime target of de-escalation and may increase overall wellness. Other investigators have demonstrated this in various populations. For example, a study by Rajan S. et al., used a wrist-worn sensor, which measured motion in three axes and EDA, on adolescent mothers to demonstrate the ability to detect stress in a real-world scenario (Rajan et al. 2012). In this study, data was streamed directly to the participants’ phone and was accessible to them throughout the recorded session. Multiple study participants reported monitoring their biometric data on their smart phones and using it as a guide for behavioral modifications that they had learned from mindfulness exercises and cognitive behavioral therapy training prior to study participation. Our data could be applied to a similar paradigm but with an automated alert function using our stress detection algorithm. This would be an important tool for helping physicians become more aware of their emotional state and cue them to initiate personal and institutional interventions aimed at decreasing stress in physicians.
Additional work is needed before these finding can impact physician wellness. Larger validation studies with a similar population across various clinical sites is a critical next step. This would allow for refinement of the algorithms. If the pre-event marker vs baseline biometric pattern can be confirmed, this work can be applied to different clinical settings to capture a more diverse population and to understand individual and subgroup level factors that may influence detection accuracy (e.g. gender, race, baseline stress level). The long-term goal of this work is to pair just-in-time interventions to manage physician stress to improve job satisfaction, work productivity, career longevity, and patient care. Decreasing stress can ultimately improve outcomes for physicians and their patients.
5. Limitations
This was a small preliminary that was designed to determine proof of concept; therefore, we were unable to evaluate patterns within subgroups. As such, there may be different features based on gender or perceived level of stress that we were not able to capture. An area of future work would be a similar study using a larger population over several ED sites. This would improve the accuracy of our stress detecting algorithm and provide sufficient power to perform subgroup analyses. The self-report nature of study design creates potential for measurement bias in that participants many have neglected to self-report some stressful events, thus we lack pure ground truth data to validate our measures. Busy EM physicians are already burdened with a tremendous workload (hence the motivation of the study), creating a challenge to obtain perfectly accurate real time annotations. In addition, some forms of stress in the ED are not momentary; for example, caring for a critically ill patient or interacting with a patient’s particularly difficult family member could create stress over a period of hours, creating a challenge in our detection paradigm.
There are also several important limitations in our data capture and classification methods. Due to the self-report nature of the study, some of the time segments selected as the baseline may have overlapped with some unreported stress events, thereby potentially affecting the abilities of the machine learning classifiers to accurately classify a stress event. By performing 10-fold cross-validation during the training of the machine learning classifiers, overfitting of the data should be reduced, but may still be present to a lesser extent when compared to training the models with no validation or test dataset.
6. Conclusion
Wearable sensors have potential to be used in the clinical setting for monitoring of physician stress. Wearable sensor data 20-minutes prior to a self-reported stress episode was indicative of stress when compared to an individual’s baseline. Larger studies are needed to better characterize this phenomenon and to identify opportunities for interventions based on stress detection.
7. Acknowledgements
Dr. Carreiro is funded by NIH/NIDA K23DA045242.
Contributor Information
Eric E. Kaczor, Department of Emergency Medicine, Division of Medical Toxicology, University of Massachusetts, Medical School, Worcester, MA
Stephanie Carreiro, Department of Emergency Medicine, Division of Medical Toxicology, University of Massachusetts Medical, School, Worcester, MA.
Joshua Stapp, Department of Electrical Engineering, University of Texas at Tyler, Tyler, TX.
Brittany Chapman, Department of Emergency Medicine, Division of Medical Toxicology, University of Massachusetts Medical School, Worcester, MA.
Premananda Indic, Department of Electrical Engineering, University of Texas at Tyler, Tyler, TX.
8. References
- Adams Phil, Rabbi Mashfiqui, Rahman Tauhidur, Matthews Mark, Voida Amy, Gay Geri, Choudhury Tanzeem, and Voida Stephen. 2014. "Towards personal stress informatics: comparing minimally invasive techniques for measuring daily stress in the wild." In Proceedings of the 8th International Conference on Pervasive Computing Technologies for Healthcare, 72–79. Oldenburg, Germany: ICST (Institute for Computer Sciences, Social-Informatics and Telecommunications Engineering). [Google Scholar]
- Bragard I, Dupuis G, and Fleet R. 2015. 'Quality of work life, burnout, and stress in emergency department physicians: a qualitative review', Eur J Emerg Med, 22: 227–34. [DOI] [PubMed] [Google Scholar]
- Chintha KK, Indic P, Chapman B, Boyer EW, and Carreiro S. 2018. 'Wearable Biosensors to Evaluate Recurrent Opioid Toxicity After Naloxone Administration: A Hilbert Transform Approach', Proc Annu Hawaii Int Conf Syst Sci, 2018: 3247–52. [PMC free article] [PubMed] [Google Scholar]
- Costa M, Goldberger AL, and Peng CK. 2005. 'Multiscale entropy analysis of biological signals', Phys Rev E Stat Nonlin Soft Matter Phys, 71: 021906. [DOI] [PubMed] [Google Scholar]
- Drummond D 2015. 'Physician Burnout: Its Origin, Symptoms, and Five Main Causes', Fam Pract Manag, 22: 42–7. [PubMed] [Google Scholar]
- Fletcher RR, Tam S, Omojola O, Redemske R, and Kwan J. 2011. "Wearable sensor platform and mobile application for use in cognitive behavioral therapy for drug addiction and PTSD." In 2011 Annual International Conference of the IEEE Engineering in Medicine and Biology Society, 1802–05. [DOI] [PubMed] [Google Scholar]
- Garcia-Ceja E, Osmani V, and Mayora O. 2016. 'Automatic Stress Detection in Working Environments From Smartphones' Accelerometer Data: A First Step', IEEE J Biomed Health Inform, 20: 1053–60. [DOI] [PubMed] [Google Scholar]
- Healey JA, and Picard RW. 2005. 'Detecting stress during real-world driving tasks using physiological sensors', IEEE Transactions on Intelligent Transportation Systems, 6: 156–66. [Google Scholar]
- Hui TKL, and Sherratt RS. 2018. 'Coverage of Emotion Recognition for Common Wearable Biosensors', Biosensors (Basel), 8. [DOI] [PMC free article] [PubMed] [Google Scholar]
- Ilic IM, Arandjelovic MZ, Jovanovic JM, and Nesic MM. 2017. 'Relationships of work-related psychosocial risks, stress, individual factors and burnout - Questionnaire survey among emergency physicians and nurses', Med Pr, 68: 167–78. [DOI] [PubMed] [Google Scholar]
- Lall MD, Gaeta TJ, Chung AS, Dehon E, Malcolm W, Ross A, Way DP, Weichenthal L, and Himelfarb NT. 2019. 'Assessment of Physician Well-being, Part One: Burnout and Other Negative States', West J Emerg Med, 20: 278–90. [DOI] [PMC free article] [PubMed] [Google Scholar]
- Liu X, Wang Q, Liu D, Wang Y, Zhang Y, Bai O, and Sun J. 2018. 'Human emotion classification based on multiple physiological signals by wearable system', Technol Health Care, 26: 459–69. [DOI] [PMC free article] [PubMed] [Google Scholar]
- Maslach Christina, and Jackson Susan E.. 1981. 'The measurement of experienced burnout', Journal of Organizational Behavior, 2: 99–113. [Google Scholar]
- Panagioti M, Panagopoulou E, Bower P, Lewith G, Kontopantelis E, Chew-Graham C, Dawson S, van Marwijk H, Geraghty K, and Esmail A. 2017. 'Controlled Interventions to Reduce Burnout in Physicians: A Systematic Review and Meta-analysis', JAMA Intern Med, 177: 195–205. [DOI] [PubMed] [Google Scholar]
- Parikh R, Mathai A, Parikh S, Chandra Sekhar G, and Thomas R. 2008. 'Understanding and using sensitivity, specificity and predictive values', Indian J Ophthalmol, 56: 45–50. [DOI] [PMC free article] [PubMed] [Google Scholar]
- Rajan S, Leonard N, Fletcher R, Casarjian B, Casarjian R, Cisse C, and Gwadz M. 2012. 'Ambulatory Autonomic Activity Monitoring Among At-Risk Adolescent Mothers', J Mob Technol Med, 1: 25–31. [DOI] [PMC free article] [PubMed] [Google Scholar]
- Rothenberger DA 2017. 'Physician Burnout and Well-Being: A Systematic Review and Framework for Action', Dis Colon Rectum, 60: 567–76. [DOI] [PubMed] [Google Scholar]
- Rudnicki Witold R., Wrzesień Mariusz and Paja Wiesław. 2015. 'All Relevant Feature Selection Methods and Applications.' in Stańczyk Urszula and Jain Lakhmi C. (eds.), Feature Selection for Data and Pattern Recognition (Springer Berlin Heidelberg: Berlin, Heidelberg: ). [Google Scholar]
- Hahn S. 1996. Hilbert Transforms in Signal Processing (Artech House; ). [Google Scholar]
- Sano A, Taylor S, McHill AW, Phillips AJ, Barger LK, Klerman E, and Picard R. 2018. 'Identifying Objective Physiological Markers and Modifiable Behaviors for Self-Reported Stress and Mental Health Status Using Wearable Sensors and Mobile Phones: Observational Study', J Med Internet Res, 20: e210. [DOI] [PMC free article] [PubMed] [Google Scholar]
- West CP, Dyrbye LN, Erwin PJ, and Shanafelt TD. 2016. 'Interventions to prevent and reduce physician burnout: a systematic review and meta-analysis', Lancet, 388: 2272–81. [DOI] [PubMed] [Google Scholar]
- Williams ES, Manwell LB, Konrad TR, and Linzer M. 2007. 'The relationship of organizational culture, stress, satisfaction, and burnout with physician-reported error and suboptimal patient care: results from the MEMO study', Health Care Manage Rev, 32: 203–12. [DOI] [PubMed] [Google Scholar]


