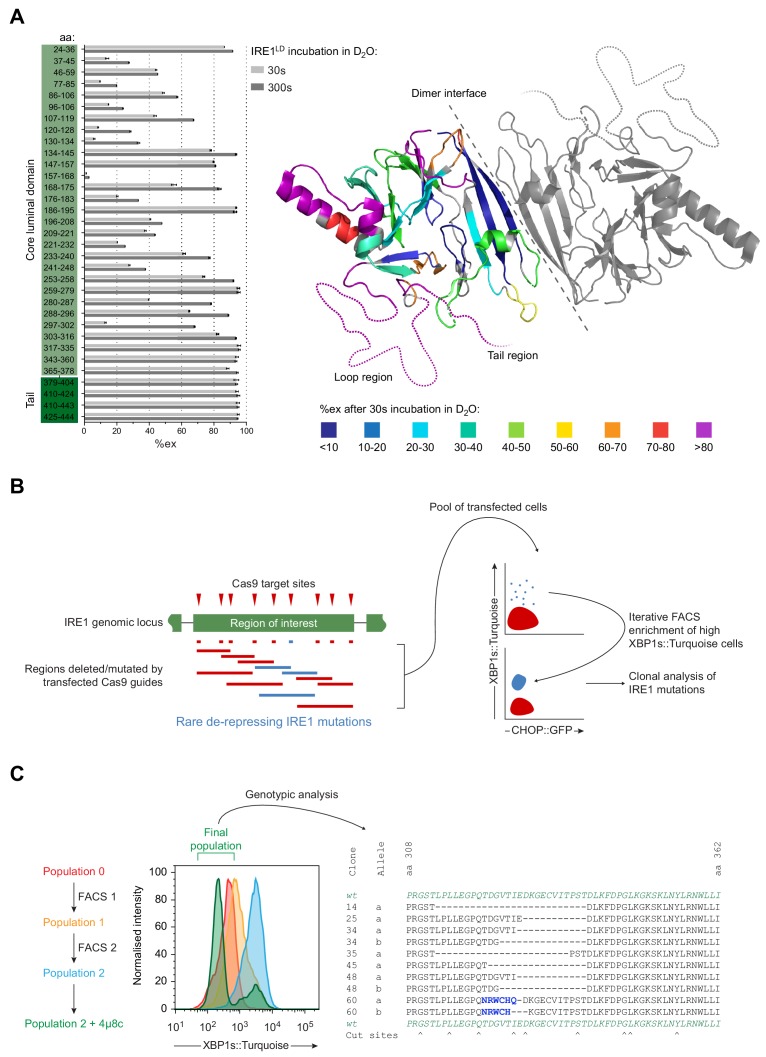
Figure 3. Identification of flexible regions in IRE1LD that are important for the regulation of IRE1 activity in cells.
(A) Left panel shows a bar diagram of the percentage of amide hydrogen exchange (%ex) of the indicated by IRE1LD segments after 30 and 300 s incubation in D2O. The amino acids (aa) covered by the peptic fragments are indicated on the left. Exchange was corrected for back exchange using a fully deuterated IRE1LD preparation. Protein concentration was 5 µM. Shown are the data of three independent experiments (mean ± standard deviation). Right panel shows a cartoon of the IRE1LD dimer (PDB: 2HZ6) with the left protomer coloured according to %ex at 30 s (areas with no sequence coverage are uncoloured). The location of the putative loop (residues 308–357) and the tail (residues 390–444) are schematically represented as dotted lines (see: Figure 3—source data 1) (B) Schematic description of a directed in vivo CRISPR-Cas9 mutagenesis strategy to probe regions of IRE1LD for their relevance to regulating activity in CHO-K1 cells. Cas9 guides (red triangles) targeted sites across the Ern1 genomic locus encoding the protein’s region of interest. Transfection of individual or pairs of guides resulted in a collection of mutations (insertions and deletions, depicted as blue and red lines). Cell harbouring rare de-repressing mutations of IRE1 (blue) were selected by fluorescence-activated cell sorting (FACS) gated on XBP1s::Turquoise high and CHOP::GFP low signals. The resultant clones were isolated and genotyped. (C) Left panel is a histogram of XBP1s::Turquoise intensity of CHO-K1 dual UPR reporter cell populations transfected with guide-Cas9 encoding plasmids targeting a putative unstructured loop (aa 308–357) within IRE1LD (identified in ‘A’). XBP1s::Turquoise bright cells within population 0 were collected by FACS (FACS1) yielding population 1, followed by a second round of enrichment for bright cells (FACS2 yielding population 2). Population 2 was treated with the IRE1 inhibitor 4µ8c to select against clones exhibiting IRE1-independent reporter activity. The final population was genotypically analysed (representative sequences are shown on the right). Frameshift mutations are coloured in blue and Cas9 cut sites are indicated below.


