

Abstract
Caenorhabditis elegans is used extensively as a medical and toxicological model organism. However, little is known about background levels of oxidatively induced DNA damage in the nematode or how culturing methods affect DNA damage levels. The tough C. elegans cuticle makes it challenging to extract genomic DNA without harsh procedures that can artifactually increase DNA damage. Therefore, a mild extraction protocol based on enzymatic digestion of the C. elegans cuticle with high-salt phase-separation of DNA has been developed and optimized. This method allows for efficient extraction of >50 μg DNA using a minimum of 250000 nematodes grown in liquid culture. The extracted DNA exhibited acceptable RNA levels (<10% contamination), functionality in polymerase chain reaction assays, and reproducible DNA fragmentation. Gas chromatography/tandem mass spectrometry (GC-MS/MS) with isotope-dilution measured lower lesion levels in high-salt extracts than in phenol extracts. Phenolic extraction produced a statistically significant increase in 8-hydroxyguanine, a known artifact, and additional artifactual increases in 2,6-diamino-4-hydroxy-5-formamidopyrimidine, 4,6-diamino-5-formamidopyrimidine, and 8-hydroxyadenine. The high-salt DNA extraction procedure utilizes green solvents and reagents and minimizes artifactual DNA damage, making it more suitable for molecular and toxicological studies in C. elegans. This is, to our knowledge, the first use of GC-MS/MS to measure multiple 8,5′-cyclopurine-2′-deoxynucleosides in a toxicologically important terrestrial organism.
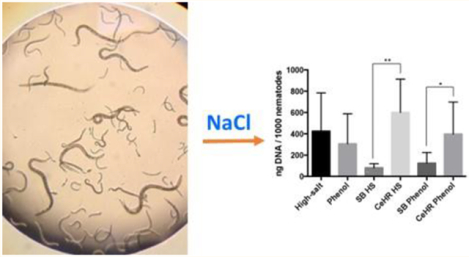
Graphical Abstract
The nematode Caenorhabditis elegans (C. elegans) is used for biomedical, genetic, and toxicological research.1,2 It was the first multicellular organism to have its genome sequenced,3 and it was instrumental in understanding organismal and cellular development4 and RNA interference.5 The use of C. elegans as a model organism is expected to increase as global toxicology testing moves toward nonmammalian-based assays.6–8
C. elegans were first used to study oxidatively induced DNA damage in 1976, following exposure to ionizing radiation.9 Numerous methods, including comet and micronuclei assays and qPCR, have been used to quantify oxidatively induced DNA lesions in C. elegans.10–13 However, these assays do not measure genomic DNA damage in intact nematodes, cannot quantify background levels of DNA damage, or do not provide nucleotide-specific information.14 Nucleotide-specific information can be obtained with high-throughput sequencing,15–17 and 8-hydroxy-2′-deoxyguanosine can be detected with commercial antibody kits.18
MS methods provide simultaneous structural elucidation and accurate quantification of multiple DNA lesions in a given DNA sample.19 They have been used to identify and quantify DNA lesions in biological samples from many species including nematodes exposed to nanosilver20 and in nucleotide excision repair-deficient nematodes.21 However, it is technically challenging to extract intact DNA from C. elegans: the tough exoskeleton consists of extensively cross-linked collagen-like proteins.22 Numerous methods exist for disrupting the cuticle, lysing cells, and extracting DNA.23 These methods are time-consuming, expensive, or have the potential to damage DNA during the extraction process.
Herein, we describe the development and validation of a robust enzymatic digestion and high-salt (HS), liquid-phase separation method for the efficient extraction of total genomic DNA from wild-type C. elegans. Nematodes were grown in either S basal-complete (SB) or in modified C. elegans Habitation and Reproduction (mCeHR) medium24 to evaluate the possible effects of culture medium on endogenous DNA damage levels. The HS extraction method was compared to an established phenol/chloroform (i.e., “phenol”) extraction method25 to assess the quantity and quality of the extracted DNA. Gas chromatography/tandem mass spectrometry (GC-MS/MS) with isotope-dilution was used to measure the levels of oxidatively induced DNA lesions in C. elegans DNA extracts.
EXPERIMENTAL SECTION
Nematodes.
Nematode Growth and Collection
All reagents are ACS grade or higher if not specified. Recipes for all buffers and growth medium are described in our previous work.26 Briefly, C. elegans wildtype (N2) isolate (Caenorhabditis Genetics Center, University of Minnesota) grown on solid nematode growth medium plates were bleached to obtain sterile nematode egg solutions. Eggs were resuspended in modified C. elegans Habitation and Reproduction (mCeHR) medium with 20% fat-free milk and 100 μg/mL tetracycline hydrochloride,24 or in SB medium with 10% volume fraction E. coli OP50 suspension, 1% volume fraction Penicillin–Streptomycin–Amphotericin B Solution (ATCC, Manassas, VA) and 0.5% volume fraction Amphotericin B (MP Biomedicals, Burlingame, CA). Escherichia coli OP50 bacteria stock27 was cultured in Lennox LB Broth (Invitrogen, Carlsbad CA), washed, and resuspended in C. elegans M9 growth buffer. Nematodes liquid cultures were incubated in the dark at 20 °C for 1 week before splitting by a factor of 1:3 into larger volumes of medium for propagation or sample collection. To harvest from mCeHR, nematodes were counted, divided into aliquots of 500000 nematodes, centrifuged to remove medium supernatant, and frozen at −80 °C. Nematodes grown in SB medium were washed via a sucrose float method28 before counting and freezing at −80 °C. All C. elegans counts were performed with a standardized method that utilized 10 × 2 μL aliquots of (shaken) nematode culture pipetted (pipet tip prewetted) onto a glass slide.26 Slides were visualized by light microscopy.
Nematode Cuticle Degradation and DNA Extraction Optimization.
Seven commonly used nematode cuticle degradation/cell lysis methods and three different DNA extraction methods (Supporting Information, Table S1) were tested in pilot studies to determine which combination of methods was most robust and reproducible. Genomic DNA extraction methods included enzymatic digestion,29 grinding in liquid nitrogen coupled with anion-exchange resins,20,21 and a high-salt, mammalian-cell method.30 Lysates were imaged with an automated Zeiss microscope (Axio Vert.A1, Carl Zeiss Microscopy) with a 5× objective lens to qualify degradation. DNA concentrations were measured with a Qubit High Sensitivity dsDNA Assay Kit/Qubit 2.0 fluorometer (Thermo Fisher Scientific, Waltham, MA), a NanoDrop ND-1000 spectrophotometer (Thermo Fisher Scientific, Waltham, MA), and a Beckman Coulter DU 640 spectrophotometer (Beckman, Brea, CA) for comparative purposes; final DNA concentrations represent Beckman Coulter readings.
DNA Extraction and Analysis.
High-Salt (HS) DNA Extraction.
The HS DNA extraction protocol for C. elegans is detailed in the Supporting Information (SI). The protocol was loosely based on a method developed by Miller et al. for extracting genomic DNA from human cells.31 Frozen samples containing ≈500000 nematodes were thawed at 37 °C and pelleted by centrifugation. The nematode pellet was resuspended in 2 mL of lysis buffer (10 mmol/L Tris-HCl pH 8.2, 2 mmol/L EDTA, 0.4 mol/L NaCl, 1% SDS)30 containing 2 mg/mL Proteinase K (Life Technologies, Carlsbad, CA; enzyme added on day of use) in a 15 mL, sterile plastic centrifuge tube rated to 15000 × g (GeneMate by BioExpress, Kaysville, UT). Nematode samples were incubated at 55 °C for 2 h before high-salt phase separation. Approximately 50 μg of genomic DNA was obtained from each DNA sample.
Phenol/Chloroform DNA Extraction.
The phenol/chloroform extraction protocol25 and lysis buffer recipe32 are detailed in the SI. Briefly, nematodes were thawed and pelleted, degraded with Proteinase K and SDS, and treated with RNase A/T1 before liquid-phase extraction with phenol/chloroform/isoamyl alcohol buffered with Tris (Sigma-Aldrich, St. Louis, MO).
Assessment of DNA Quantity and Quality.
The amount (μg) of DNA extracted from nematodes was determined with UV–visible spectrophotometry; the measurement accuracy of the spectrophotometer (Beckman Coulter DU 640, Beckman, Brea, CA) was verified with National Institute of Standards and Technology (NIST) DNA Standard Reference Material (SRM) 2372. RNA levels were measured on a Qubit 2.0 fluorometer with the High Sensitivity RNA Assay Kit (Thermo Fisher Scientific, Waltham MA); DNA samples containing ≤10% total RNA were considered acceptable for further analyses. Protein contamination was measured with a Coomassie Protein Assay Kit (Thermo Fisher Scientific, Waltham MA). DNA fragmentation and size of extracted DNA fragments were measured with pulse-field gel electrophoresis on a 1% agarose gel using a Sage Science PippinPulse PFGE (Beverly, MA) power supply and a Galileo Biosciences gel tank (Cambridge, MA). Polymerase chain reaction (PCR) amplification performed to test DNA quality and functionality used C. elegans-33 and E. coli-specific (Margaret Kline, NIST) primer sequences designed on the Integrated DNA Technologies Web site and ordered from idtDNA.com (Skokie, IL) and Eurofins Genomics (Folsom, CA). Primer sequences are provided in Table S2.
Measurement of DNA Lesions by GC-MS/MS with Isotope-Dilution.
Samples containing 50 μg of genomic DNA extracted from nematodes were digested with E. coli Fpg and E. coli Nth to release lesions, derivatized by trimethylsilylation, and analyzed using GC-MS/MS with isotope-dilution for the measurement of five base lesions:20–35 4,6-diamino-5-formamidopyrimidine (FapyAde), 2,6-diamino4-hydroxy-5-formamidopyrimidine (FapyGua), 8-hydroxyadenine (8-OH-Ade), 5-hydroxycytosine (5-OH-Cyt), and 8hydroxyguanine (8-OH-Gua).
A second set of DNA samples was digested with nuclease P1, phosphodiesterase 1 and alkaline phosphatase, derivatized by trimethylsilylation, and analyzed using GC-MS/MS with isotope-dilution for the determination of (5′R)-8,5′-cyclo-2′deoxyadenosine (R-cdA), (5′S)-8,5′-cyclo-2′-deoxyadenosine (S-cdA), (5′R)-8,5′-cyclo-2′-deoxyguanosine (R-cdG), and (5′S)-cyclo-2′-deoxyguanosine (S-cdG).36–43 The sample preparation and instrumental analysis details for both the base and 8,5′-cyclopurine-2′-deoxynucleoside lesion measurements are fully described in the SI.
Control Experiments: Measurement of DNA Lesions in Human Breast Cells.
Mammary gland epithelial cells (MCF 10A) and mammary gland epithelial adenocarcinoma cells (MCF7) were purchased from ATCC and cultured as in our previous work,44 per manufacturer’s recommendations. The human cells were obtained and utilized according to protocols approved by the NIST Institutional Review Board. DNA was extracted using the HS or phenol/chloroform DNA extraction protocols developed herein. DNA lesion levels were measured utilizing GC-MS/MS as described above.
Statistical Analyses.
GraphPad Prism 7.0 software was used to conduct statistical analyses. Normality of data sets was tested with the Shapiro-Wilk normality test. Statistical significance between DNA extraction yields, protein contamination, the ratio of nucleotide to protein absorbance values (260 nm/280 nm), and DNA lesion levels were analyzed with the Student’s t test (one comparison), or, for more than one comparison, one-way analysis of variance (ANOVA, parametric) or Kruskal–Wallis test (nonparametric); corrections were made for multiple comparisons (Tukey or Dunn tests). Outliers (four samples, total) in the raw DNA lesion data were identified with the Grubb’s outlier test. All reported standard deviations in individual data sets (e.g., error bars) represent one standard deviation.
SAFETY CONSIDERATIONS
No unexpected, new, or significant hazards or risks are associated with this work.
RESULTS AND DISCUSSION
Degradation of Nematodes.
Cuticle degradation/cell lysis is critical for efficient C. elegans DNA extraction. When visualized microscopically and measured spectrophotometrically (Figures 1, S1, and S2), enzymatic digestion with proteinase K resulted in the best nematode cuticle degradation.
Figure 1.
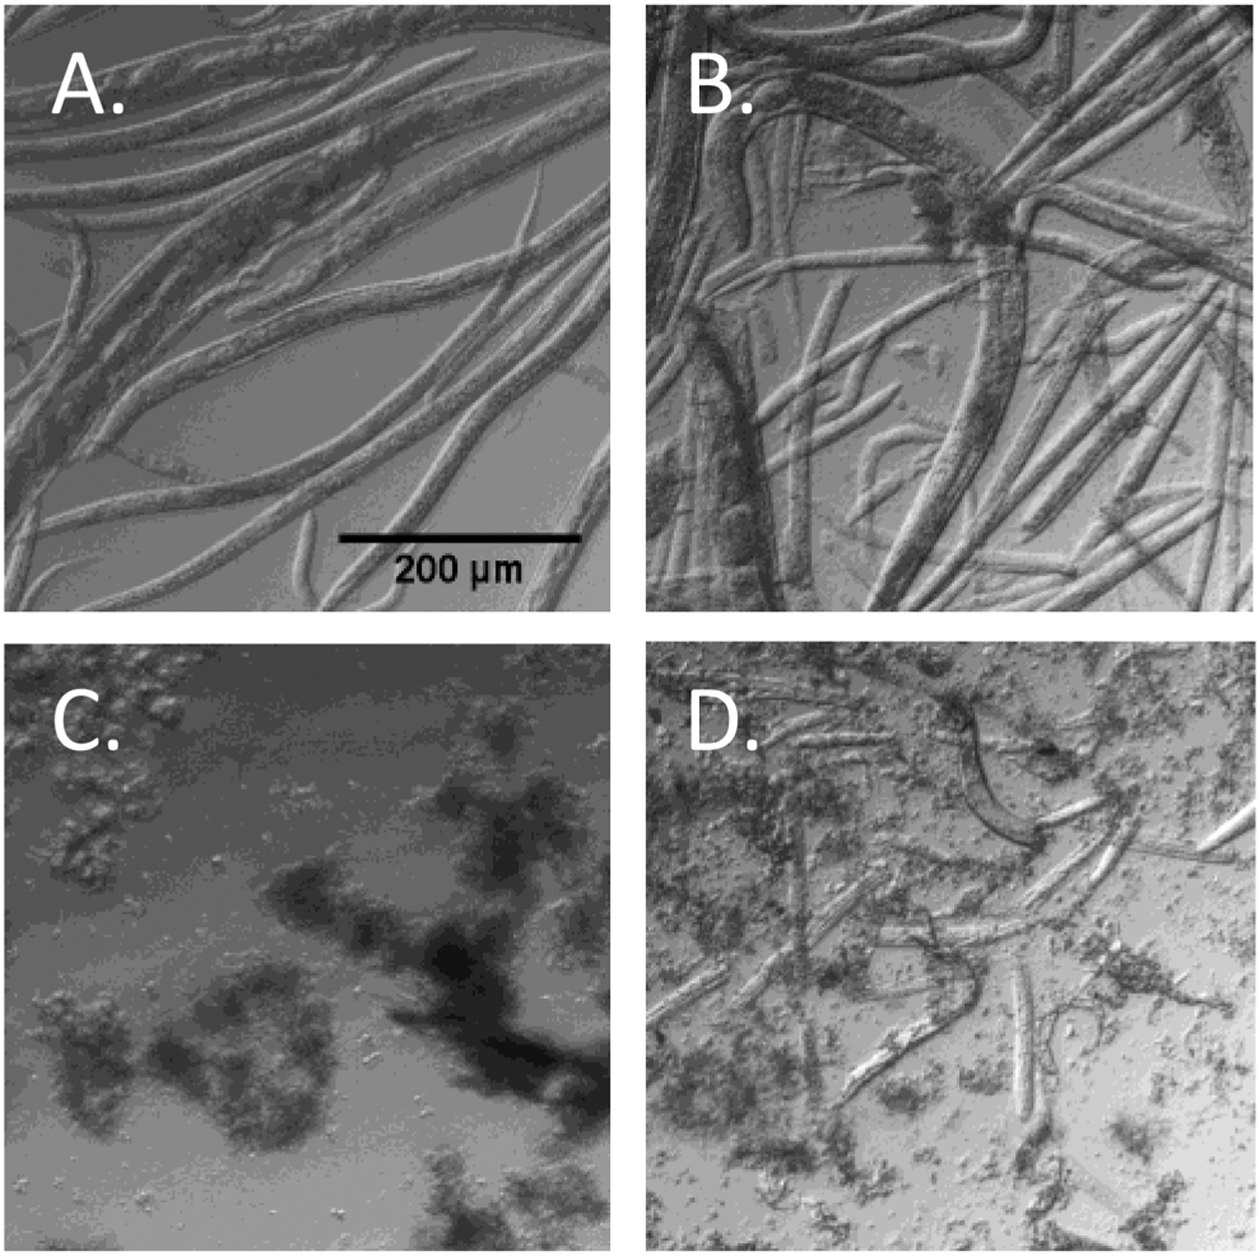
Degradation of nematodes. Bright-field snapshot from a 0.2 mL sample in a 24-well cell culture plate. (A) Control nematodes, frozen at −80 °C and thawed at room temperature. (B) Nematodes frozen in dry ice (−78.5 °C) and thawed at 37 °C, repeated six times. (C) Nematodes digested with mammalian cell lysis buffer containing 2 mg/mL Proteinase K. (D) Nematodes ground with a mortar and pestle in liquid nitrogen.
DNA Yield and Quality.
The HS DNA extraction protocol successfully allowed for reproducible extraction of at least 50 μg of DNA from aliquots of ≈250000 to ≈500000 nematodes. The overall DNA yield (average ng DNA/1000 nematodes ± SD) for the HS DNA extraction method was similar to that obtained using phenol (HS average = 426.4 ± 84.2, phenol average = 306.7 ± 66.3, two-tailed t test, p = 0.2719, n = 18 each, Figure S3). This is equivalent to a yield of approximately 213 μg of DNA from 500000 nematodes for the HS methods and 153.4 μg of DNA from the phenol method. If we assume that in a mixed-population culture there are approximately 2000 somatic and germ cells per nematode, with 0.2 pg DNA per cell, we would expect to obtain 200 μg of DNA per extraction.
Nematodes from mCeHR cultures produced larger DNA yields compared to nematodes from SB cultures with both the HS protocol (two-tailed t test, p = 0.011, n = 6 SB and 12 mCeHR) and the phenol protocol (two-tailed t test, p = 0.0488, n = 6 SB and 12 mCeHR). It is interesting to note that nematode pellets (i.e., 500000 nematodes) from mCeHR cultures were visually larger in size than pellets from nematodes cultured in SB. Nematodes grow at different rates and reproduce at different rates in different media,26,45 but we hoped to control for differences in growth and reproduction by using nonsynchronized, mixed-age cultures and standardized counting methods. Further investigation is needed to understand differences in DNA from nematodes grown in different cultures
The quality of the extracted DNA was evaluated in terms of RNA and protein contamination levels. RNA levels averaged ≤10% RNA (per DNA sample mass). High-salt mCeHR extracts displayed a higher proportion of samples with higher RNA levels (12/29 samples or 41% compared to 0/12 phenol samples). Protein contamination in the DNA extracts was initially higher in the HS extracts than in the phenol extracts (two-tailed t test, phenol mCeHR vs HS mCeHR p ≤ 0.0001, phenol SB vs HS SB p = 0.0462, Figure S4). The purity of DNA extracts was confirmed by ultraviolet absorbance at 260 and 280 nm. Reducing the number of nematodes per sample significantly reduced the protein levels and increased 260/280 ratios, indicating that the extracted DNA obtained via the HS extraction protocol is of similar quality to the DNA obtained using the phenol protocol.
Additional quality metrics included DNA fragmentation and suitability for use in qPCR. DNA extracts from SB and mCeHR cultures using both protocols produced pulse-field gel bands that were similar in size, appearing from approximately 10 to 55 kB (Figure S5). DNA extracted from nematodes grown in both media types was readily amplified with PCR, suggesting that the DNA was suitable for genomic methods such as PCR as well as for analytical assays.
DNA Lesions in Nematode Extracts.
A distinct trend of significantly lower lesion levels in HS extracts compared to the phenol extracts was observed (Figure 2). Summing the total lesion level in DNA extracted with each protocol showed an increased (average ± standard deviation) number of lesions in DNA extracted with phenol (8.74 ± 0.96 lesions/106 bases) compared to HS (6.09 ± 0.86 lesions/106 bases, p = 0.042, n = 74 samples for HS, n = 81 samples for phenol). An increase in 8-OH-Gua levels using the phenolic extraction protocol has been reported previously and is attributable to the ability of phenol to sensitize guanine residues to enhanced damage from oxygen.46,47 In the present study, the levels of 8-OH-Gua were found to be statistically significant and higher in DNA extracted using phenol from nematodes grown in both mCeHR and SB media (p ≤ 0.05 to 0.001, Figure 2A). We also observed an increase in FapyAde and FapyGua, major promutagenic lesions in mammalian cells, in DNA extracted with the phenol extraction protocol from nematodes cultured in both mCeHR and SB media. Interestingly, the observed levels of FapyAde and FapyGua in DNA extracts reached the level of statistical significance (p ≤ 0.05 to 0.01, Figure 2D,E) in nematodes cultured in mCeHR medium, but not in nematodes cultured in SB medium. The level of 8-OH-Ade (Figure 2B) was found to be increased in DNA extracts from nematodes cultured in either mCeHR or SB media due to the phenol extraction protocol. To the best of our knowledge, this is the first report on either eukaryotes or prokaryotes detailing increased oxidatively induced DNA lesions, other than 8-OHGua, via the use of a phenolic extraction protocol.
Figure 2.
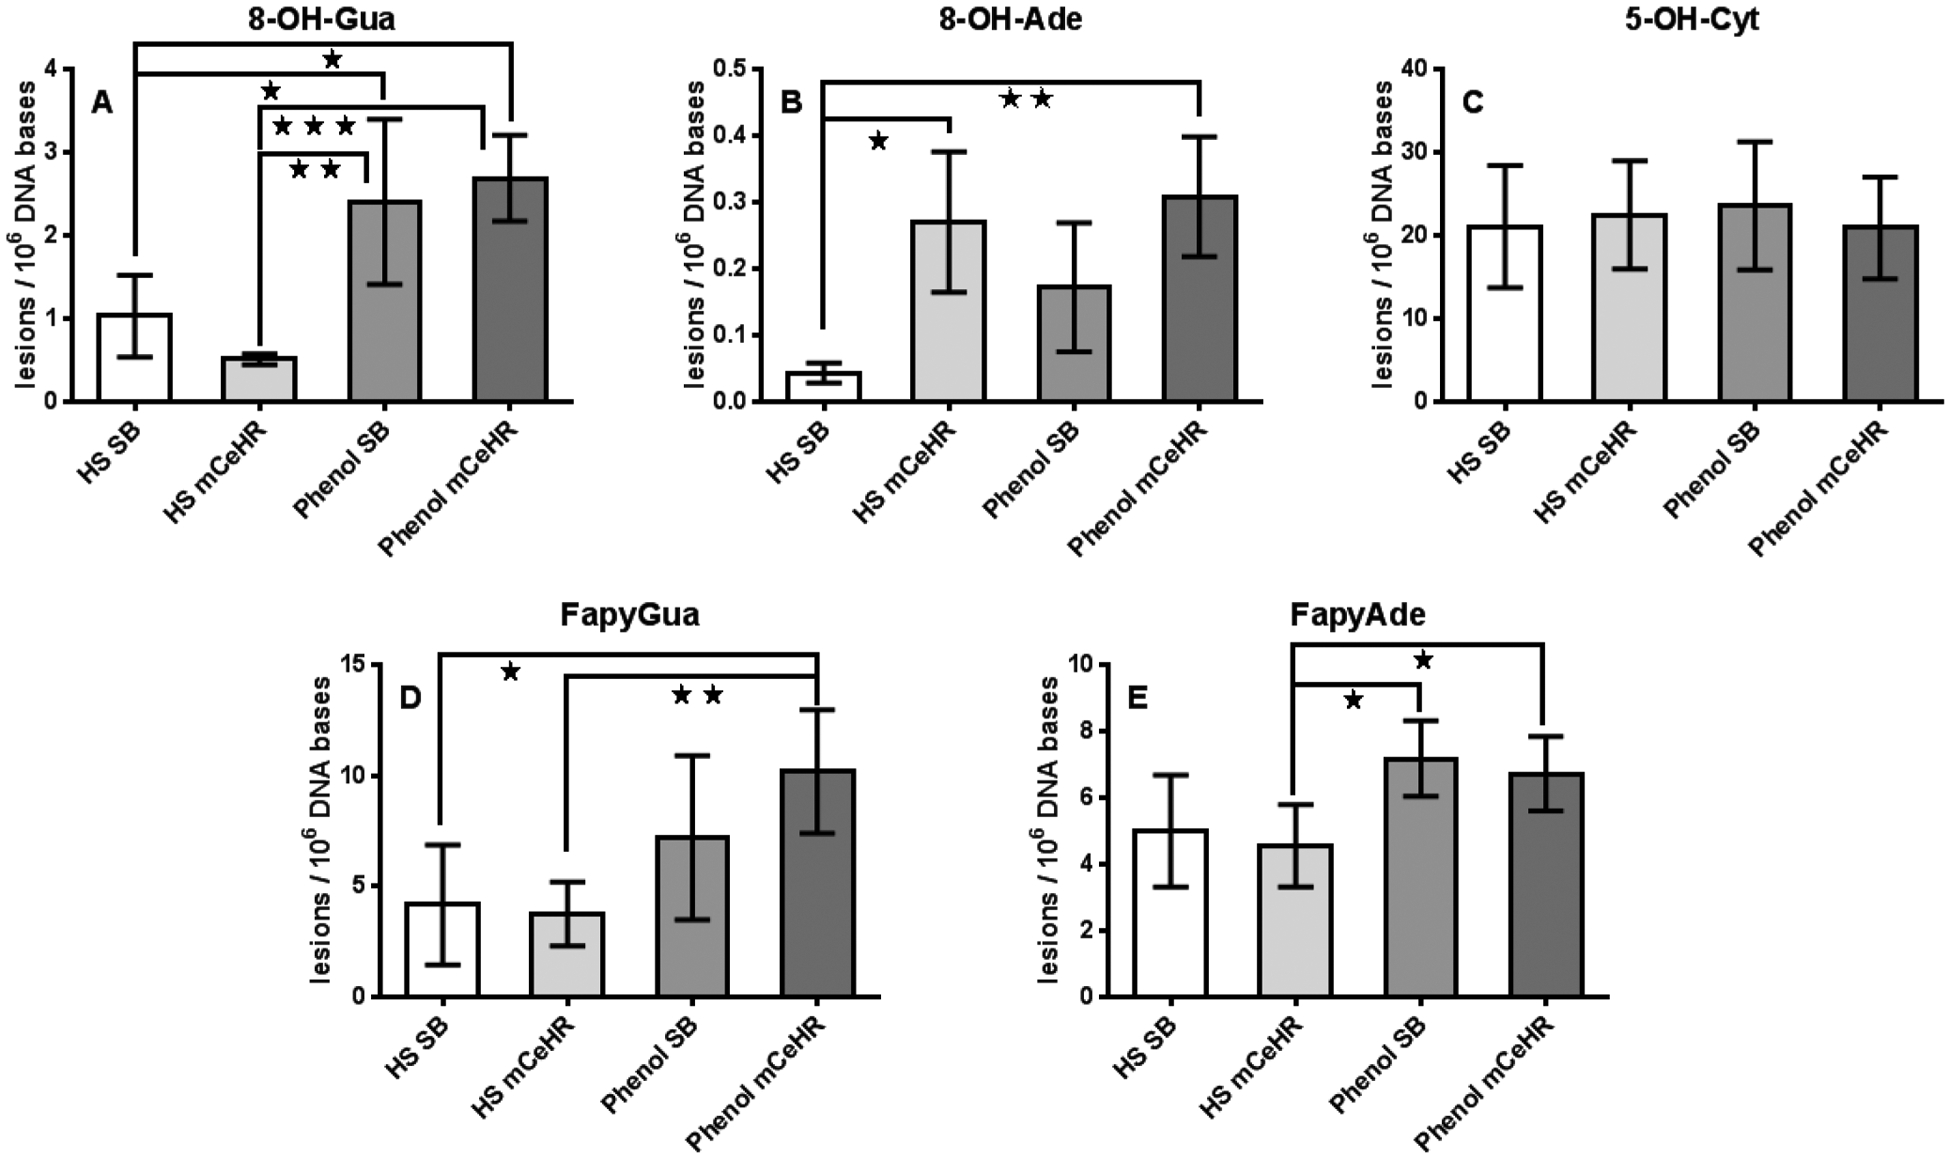
Quantification of DNA base lesions in C. elegans DNA extracts. C. elegans were cultured in either SB or mCeHR media. DNA was extracted with either the HS or the phenol extraction protocol. (A) 8-OH-Gua, (B) 8-OH-Ade, (C) 5-OH-Cyt, (D) FapyGua, and (E) FapyAde. Asterisks indicate statistically significant differences between samples based on the one-way ANOVA. One, two, or three asterisks indicate p ≤ 0.05, 0.01, and 0.001, respectively. All data points represent the mean of the measurements for 3–6 independently prepared samples. The uncertainties are standard deviations.
It is also worthwhile to point out the relative differences between the 8-OH-Gua and 8-OH-Ade levels in the nematode DNA extracts. In general, the oxidatively driven formation of 8OH-Gua from the guanine base is more energetically favorable than the oxidatively driven formation of 8-OH-Ade from the adenine base due to the substantially lower reduction potential of guanine. Thus, when one compares the relative levels of 8OH-Gua/8-OH-Ade (Figure 2) across all four of the culture/DNA extraction conditions (the ratios are 1.9, 8.7, 13.4, and 23.8 for HS-mCeHR, phenol-mCeHR, phenol-SB, and HS-SB, respectively), it is notable that the ratio is always >1, effectively demonstrating the enhanced background levels of 8-OH-Gua in N2 nematodes. The ratio of 8-OH-Gua/8-OH-Ade is the lowest under the HS-mCeHR and phenol-mCeHR extraction conditions and the highest under the phenol-SB and HS-SB extraction conditions which could suggest that the SB nematode culturing conditions might have had an influence on the oxidation of the guanine base. However, the data shown in Figure 2a does not support this hypothesis, and in fact, clearly demonstrates that the presence of phenol in the extraction medium had a more significant effect on the measured levels of 8-OH-Gua than the SB culturing conditions. It is not clear to us why the ratio of 8-OH-Gua/8-OH-Ade is not constant across the culture/DNA extraction conditions since both guanine and adenine are oxidized by the presence of phenol in the extraction medium. The observed differences in the 8-OH-Gua/8-OH-Ade ratios may be due to multiple interacting experimental factors, including the differences in the extraction media, nematode culturing conditions, and the kinetics and extent to which phenol induces the formation of 8-OH-Gua versus 8-OH-Ade in DNA extracts.
The levels of 8-OH-Gua, 8-OH-Ade, FapyAde, and FapyGua in nematode DNA extracted with the HS protocol were significantly lower than those reported by Arczewksa et al. in DNA from nematodes grown on solid agar, ground with a mortar and pestle under liquid nitrogen, and extracted using anion-exchange resins.21 We report 3× lower levels of FapyAde, 9× lower FapyGua, 26× lower levels of 8-OH-Ade, and 62× lower levels of 8-OH-Gua. The total combined lesion level (mean ± standard deviation) was (25.4 ± 4.2) lesions/sample in the Arczewska extracts compared to (3.8 ± 0.9) lesions/sample in the current HS extracts (p ≤ 0.0001, n = 16 Arczewska, n = 37 this work). It is possible that the increase in DNA lesion levels presented in Arczewska’s work was caused by the presence of additional oxygen during the nematode grinding step.
Control experiments were performed in an orthogonal model, MCF7 and MCF-10A human breast cells, to confirm that the phenol extraction protocol increased oxidative damage. For both cell lines, the levels of FapyAde and FapyGua were significantly increased after phenol extraction (Table S3), mimicking the observed increases in FapyAde and FapyGua following nematode extraction with phenol (Table S4). It is important to note that the observed increases in these lesions appears to be independent of nematode culturing conditions (SB vs mCeHR) or cell culturing conditions. 8-OHGua was not increased in the phenol extract from the MCF7 cells but was increased in the phenol extract from the MCF-10A cells, which may be due to the overexpression of DNA repair proteins and a resultant increase in the DNA repair capacity of the cancer cells.48
GC-MS/MS was further utilized to measure the background levels of the 8,5′-cyclopurine-2′-deoxynucleosides in HS and phenol DNA extracts from nematodes grown in mCeHR (Figure 3). The 8,5′-cyclopurine-2′-deoxynucleosides are known to block transcription and to inhibit gene expression in mammalian cells and are typically repaired via the nucleotide excision repair pathway49–54. Neither R-cdA nor S-cdA were detected in nematode extracts using the present methodology (Figure 3A). However, the levels for both R-cdG and S-cdG were detectable and were significantly higher (p = ≤ 0.0001) in phenol extracts than in HS extracts (R-cdG HS n = 5, phenol n = 4; S-cdG HS n = 5, phenol n = 5).
Figure 3.
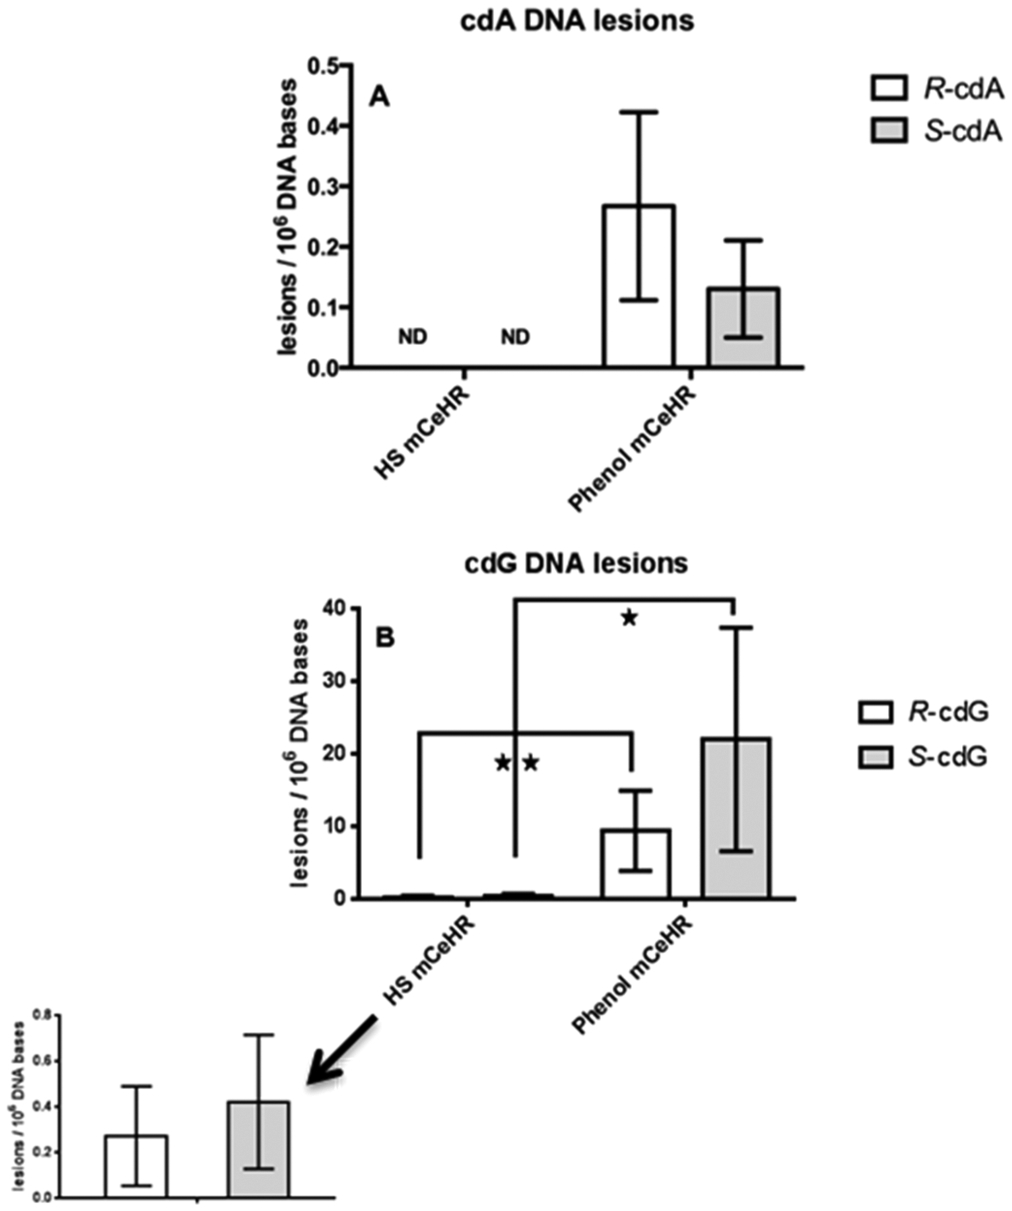
Quantification of 8,5′-cyclopurine-2′-deoxynucleosides in C. elegans DNA extracts. Quantification and comparison of R-cdA, S-cdA, R-cdG, and S-dG levels in C. elegans cultured in mCeHR medium. DNA was extracted using the HS or the phenol extraction protocol. Asterisks indicate statistically significant differences between samples based on the Student’s t test (unpaired, two-tailed). One and two asterisks indicate p ≤ 0.05 and 0.01, respectively. All data points represent the mean of the measurements for 3–6 independently prepared samples. ND: not detected. The uncertainties are standard deviations.
The 8,5′-cyclopurine-2′-deoxynucleoside levels found in the present work were not significantly different from the 8,5′cyclopurine-2′-deoxynucleoside levels previously reported by Arczewksa et al.21 This is noteworthy because Arczewksa et al. utilized a different DNA extraction protocol and DNA lesion measurement technique. Importantly, the non-8,5′-cyclopurine-2′-deoxynucleoside levels in the analytical control samples (DNA lesions measured in calf-thymus DNA using GC-MS/MS, Table S5) in the present work were not significantly different from the levels reported by Arczewska et al. (Table S5). This finding suggests that the differences in the average non-8,5′-cyclopurine-2′-deoxynucleoside nematode levels reported in this work (Figure 3) are due to the nematode culturing or to the DNA extraction protocol.
CONCLUSIONS
The HS DNA extraction method can be reliably utilized to obtain microgram quantities of genomic DNA from cuticular nematodes and, thus, to quantitatively evaluate effects of emerging chemical and biological toxins on DNA. The high quality of the extracted DNA obtained in the present study highlights the method’s potential utility in other DNA damage measurement techniques such as quantitative polymerase chain reaction (qPCR), enzyme-linked immunoabsorbant assays (ELISAs), DNA slot-blot assays, and electrochemical biosensors. The collected data from these measurement techniques would enable a comprehensive hazard assessment of the effects of chemical and biological toxins on the induction of DNA damage in nematode models. The ability to quantitatively study chemical and biological toxicity in the nematode can help to advance the understanding of toxicology and cancer biology in human tissues.
Supplementary Material
ACKNOWLEDGMENTS
The authors would like to acknowledge Dr. Monique E. Johnson for contributions to ensuring optimal nematode health. Three of the authors, L.D.S., C.M.S., and S.K.H., acknowledge funding and support from the National Academy of Sciences - National Research Council Postdoctoral Research Associateship Program. R.G. acknowledges support from the NIST Summer Undergraduate Research Fellowship program. Bristol N2 nematodes were obtained from the Caenorhabditis Genetics Center (CGC) at the University of Minnesota, which is funded by the National Institute of Health Office of Research Infrastructure Programs (P40 OD010440). The NIST DNA Standard Reference Material (SRM) 2372 was provided by Margaret Kline at NIST. Certain commercial equipment, instruments and materials are identified in this paper to specify an experimental procedure as completely as possible. In no case does the identification of particular equipment or materials imply a recommendation or endorsement by the National Institute of Standards and Technology nor does it imply that the materials, instruments, or equipment are necessarily the best available for the purpose.
Footnotes
Supporting Information
The Supporting Information is available free of charge on the ACS Publications website at DOI: 10.1021/acs.analchem.9b01503.
Figures and tables and experimental procedures for DNA extraction methods and GC-MS/MS methods (PDF)
The authors declare no competing financial interest.
REFERENCES
- (1).Hunt PR J. Appl. Toxicol 2017, 37, 50–59. [DOI] [PMC free article] [PubMed] [Google Scholar]
- (2).Leung MC; Williams PL; Benedetto A; Au C; Helmcke KJ; Aschner M; Meyer JN Toxicol. Sci 2008, 106, 5–28. [DOI] [PMC free article] [PubMed] [Google Scholar]
- (3).Celegans Sequencing Consortium. Science 1998, 282, 2012–2018.9851916 [Google Scholar]
- (4).Antoshechkin I; Sternberg PW Nat. Rev. Genet 2007, 8, 518–532. [DOI] [PubMed] [Google Scholar]
- (5).Fire A; Xu S; Montgomery MK; Kostas SA; Driver SE; Mello CC Nature 1998, 391, 806–811. [DOI] [PubMed] [Google Scholar]
- (6).Hagerbaumer A; Hoss S; Heininger P; Traunspurger WJ Nematol. 2015, 47, 11–27. [PMC free article] [PubMed] [Google Scholar]
- (7).Nel A; Xia T; Meng H; Wang X; Lin SJ; Ji ZX; Zhang HY Acc. Chem. Res 2013, 46, 607–621. [DOI] [PMC free article] [PubMed] [Google Scholar]
- (8).Nel AE J. Intern. Med 2013, 274, 561–577. [DOI] [PMC free article] [PubMed] [Google Scholar]
- (9).Herman RK; Albertson DG; Brenner S Genetics 1976, 83, 91–105. [DOI] [PMC free article] [PubMed] [Google Scholar]
- (10).Ayala-Torres S; Chen Y; Svoboda T; Rosenblatt J; Van Houten B Methods 2000, 22, 135–147. [DOI] [PubMed] [Google Scholar]
- (11).Imanikia S; Galea F; Nagy E; Phillips DH; Sturzenbaum SR; Arlt VM Environ. Toxicol. Pharmacol 2016, 45, 356–361. [DOI] [PMC free article] [PubMed] [Google Scholar]
- (12).Meyer JN; Boyd WA; Azzam GA; Haugen AC; Freedman JH; Van Houten B Genome Biol. 2007, 8, R70. [DOI] [PMC free article] [PubMed] [Google Scholar]
- (13).Sobkowiak R; Lesicki A Drug Chem. Toxicol 2009, 32, 252–257. [DOI] [PubMed] [Google Scholar]
- (14).Gonzalez-Hunt CP; Rooney JP; Ryde IT; Anbalagan C; Joglekar R; Meyer JN In Current Protocols in Toxicology; John Wiley & Sons; Duke University, 2016; pp 20.11.21–20.11.25. [DOI] [PMC free article] [PubMed] [Google Scholar]
- (15).Denver DR; Dolan PC; Wilhelm LJ; Sung W; LucasLledo JI; Howe DK; Lewis SC; Okamoto K; Thomas WK; Lynch M; Baer CF Proc. Natl. Acad. Sci. U. S. A 2009, 106, 16310–16314. [DOI] [PMC free article] [PubMed] [Google Scholar]
- (16).Meier B; Gartner A Exp. Cell Res. 2014, 329, 35–41. [DOI] [PMC free article] [PubMed] [Google Scholar]
- (17).Sloan DB; Broz AK; Sharbrough J; Wu ZQ Trends Biotechnol. 2018, 36, 729–740. [DOI] [PMC free article] [PubMed] [Google Scholar]
- (18).Aan GJ; Zainudin MSA; Karim NA; Ngah WZW Clinics (Sao Paulo, Brazil) 2013, 68, 599–604. [DOI] [PMC free article] [PubMed] [Google Scholar]
- (19).Dizdaroglu M; Coskun E; Jaruga P Free Radical Res. 2015, 49, 525–548. [DOI] [PubMed] [Google Scholar]
- (20).Hunt PR; Marquis BJ; Tyner KM; Conklin S; Olejnik N; Nelson BC; Sprando RL J. Appl. Toxicol 2013, 33, 1131–1142. [DOI] [PubMed] [Google Scholar]
- (21).Arczewska KD; Tomazella GG; Lindvall JM; Kassahun H; Maglioni S; Torgovnick A; Henriksson J; Matilainen O; Marquis BJ; Nelson BC; Jaruga P; Babaie E; Holmberg CI; Burglin TR; Ventura N; Thiede B; Nilsen H Nucleic Acids Res. 2013, 41, 5368–5381. [DOI] [PMC free article] [PubMed] [Google Scholar]
- (22).Johnstone IL BioEssays 1994, 16, 171–178. [DOI] [PubMed] [Google Scholar]
- (23).Bhaskaran S; Butler JA; Becerra S; Fassio V; Girotti M; Rea SL Anal. Biochem 2011, 413, 123–132. [DOI] [PMC free article] [PubMed] [Google Scholar]
- (24).Samuel TK; Sinclair JW; Pinter KL; Hamza IJ Visualized Exp. 2014, No. e51796.. [DOI] [PMC free article] [PubMed] [Google Scholar]
- (25).Luke CJ; Pak SC; Askew DJ; Askew YS; Smith JE; Silverman GA Front. Biosci, Landmark Ed. 2006, 11, 581–594. [DOI] [PubMed] [Google Scholar]
- (26).Scanlan LD; Lund SP; Coskun SH; Hanna SK; Johnson ME; Sims CM; Brignoni K; Lapasset P; Petersen EJ; Elliott JT; Nelson BC Sci. Rep 2018, 8, 904. [DOI] [PMC free article] [PubMed] [Google Scholar]
- (27).Brenner S Genetics 1974, 77, 71–94. [DOI] [PMC free article] [PubMed] [Google Scholar]
- (28).Portman DS Profiling Celegans gene expression with DNA microarrays Worm Book; The Celegans Research Community; WormBook, 2006; DOI: 10.1895/wormbook.1.104.1. [DOI] [PMC free article] [PubMed] [Google Scholar]
- (29).Schedl T; Lee MH; Nayak S Worm Genomic DNA Prep; http://genetics.wustl.edu/tslab/protocols/genomic-stuff/wormgenomic-dna-prep/, Accession Date June 14, 2016.
- (30).Jaruga P; Xiao Y; Vartanian V; Lloyd RS; Dizdaroglu M Biochemistry 2010, 49, 1053–1055. [DOI] [PMC free article] [PubMed] [Google Scholar]
- (31).Miller SA; Dykes DD; Polesky HF Nucleic Acids Res 1988, 16, 1215. [DOI] [PMC free article] [PubMed] [Google Scholar]
- (32).Palasterk R In Methods in Cell Biology, Caenorhabditis elegans: Modern Biological Analysis of an Organism; Epstein H, Shakes D, ; Academic Press: San Diego, CA, 1995. [Google Scholar]
- (33).Zhang Y; Chen D; Smith MA; Zhang B; Pan X PLoS One 2012, 7, No. e31849. [DOI] [PMC free article] [PubMed] [Google Scholar]
- (34).Petersen EJ; Tu X; Dizdaroglu M; Zheng M; Nelson BC Small 2013, 9, 205–208. [DOI] [PubMed] [Google Scholar]
- (35).Reddy PT; Jaruga P; Kirkali G; Tuna G; Nelson BC; Dizdaroglu MJ Proteome. Res 2013, 12, 1049–1061. [DOI] [PubMed] [Google Scholar]
- (36).Dirksen ML; Blakely WF; Holwitt E; Dizdaroglu M Int. J. Radiat. Biol 1988, 54, 195–204. [DOI] [PubMed] [Google Scholar]
- (37).Dizdaroglu M Biochem. J 1986, 238, 247–254. [DOI] [PMC free article] [PubMed] [Google Scholar]
- (38).Dizdaroglu M; Jaruga P; Birincioglu M; Rodriguez H Free Radical Biol. Med 2002, 32, 1102–1115. [DOI] [PubMed] [Google Scholar]
- (39).Dizdaroglu M; Jaruga P; Rodriguez H Free Radical Biol. Med 2001, 30, 774–784. [DOI] [PubMed] [Google Scholar]
- (40).Jaruga P; Coskun E; Kimbrough K; Jacob A; Johnson WE; Dizdaroglu M Environ. Toxicol 2017, 32, 2144–2153. [DOI] [PMC free article] [PubMed] [Google Scholar]
- (41).Jaruga P; Kirkali G; Dizdaroglu M Free Radical Biol. Med 2008, 45, 1601–1609. [DOI] [PubMed] [Google Scholar]
- (42).Jaruga P; Rozalski R; Jawien A; Migdalski A; Olinski R; Dizdaroglu M Biochemistry 2012, 51, 1822–1824. [DOI] [PubMed] [Google Scholar]
- (43).Jaruga P; Theruvathu J; Dizdaroglu M; Brooks PJ Nucleic Acids Res. 2004, 32, No. e87. [DOI] [PMC free article] [PubMed] [Google Scholar]
- (44).Coskun E; Jaruga P; Jemth AS; Loseva O; Scanlan LD; Tona A; Lowenthal MS; Helleday T; Dizdaroglu M DNA Repair 2015, 33, 101–110. [DOI] [PubMed] [Google Scholar]
- (45).Szewczyk NJ; Kozak E; Conley CA BMC Biotechnol. 2003, 3, 19. [DOI] [PMC free article] [PubMed] [Google Scholar]
- (46).Claycamp HG Carcinogenesis 1992, 13, 1289–1292. [DOI] [PubMed] [Google Scholar]
- (47).Hamilton ML; Guo Z; Fuller CD; Van Remmen H; Ward WF; Austad SN; Troyer DA; Thompson I; Richardson A Nucleic Acids Res. 2001, 29, 2117–2126. [DOI] [PMC free article] [PubMed] [Google Scholar]
- (48).Dizdaroglu M Mutat. Res., Rev. Mutat. Res 2015, 763, 212–245. [DOI] [PubMed] [Google Scholar]
- (49).Jaruga P; Xiao Y; Nelson BC; Dizdaroglu M Biochem. Biophys. Res. Commun 2009, 386, 656–660. [DOI] [PubMed] [Google Scholar]
- (50).Brooks PJ DNA Repair 2008, 7, 1168–1179. [DOI] [PMC free article] [PubMed] [Google Scholar]
- (51).Chatgilialoglu C; Ferreri C; Geacintov NE; Krokidis MG; Liu Y; Masi A; Shafirovich V; Terzidis MA; Tsegay PS Cells 2019, 8, 513. [DOI] [PMC free article] [PubMed] [Google Scholar]
- (52).Shafirovich V; Kolbanovskiy M; Kropachev K; Liu Z; Cai Y; Terzidis MA; Masi A; Chatgilialoglu C; Amin S; Dadali A; Broyde S; Geacintov NE Biochemistry 2019, 58, 561–574. [DOI] [PMC free article] [PubMed] [Google Scholar]
- (53).Swanson AL; Wang JS; Wang YS Chem. Res. Toxicol 2012, 25, 1682–1691. [DOI] [PMC free article] [PubMed] [Google Scholar]
- (54).You CJ; Swanson AL; Dai XX; Yuan BF; Wang JS; Wang YS J. Biol. Chem 2013, 288, 28548–28556. [DOI] [PMC free article] [PubMed] [Google Scholar]
Associated Data
This section collects any data citations, data availability statements, or supplementary materials included in this article.