

Abstract
Persistent organic pollutants (POPs), such as dichlorodiphenyltrichloroethane (DDT) and other organochlorine compounds, are abundant in the environment and in foodstuffs from the Indian subcontinent. These environmental contaminants have been associated with a higher risk of diabetes in numerous studies. Asian Indians are well known to have a high risk of diabetes compared with other populations, and this risk is also found in migrant populations of Asian Indians in the United States, Europe, and elsewhere. We hypothesized that high plasma concentrations of POPs in Asian Indian migrants are linked to a variety of diabetes-related pathologies and explored the mechanism for the induction of these effects. We measured 30 environmental pollutants in plasma samples obtained from 147 participants in the metabolic syndrome and atherosclerosis in South Asians living in America pilot study using a gas chromatography–tandem mass spectrometry analytical method that uses less than 0.5 mL of plasma. We found that plasma levels of o,p′-DDT and p,p′-DDT were independently associated with both body mass index (BMI) and waist circumference. Doubling the levels of the sums of these DDTs was associated with insulin insensitivity (−0.54 Matsuda index, p = 0.0009), increased adiposity (1.38 kg/m2 BMI and 4.44 cm waist circumference increase, p < 0.0001), circulating insulin (14.3 mIU/L, p = 0.001), hepatic fat (−0.07 HU, p < 0.0001), as well as increased odds of obesity (OR = 2.17, p < 0.001, BMI-based; OR = 2.37, p = 0.001, waist-based), prediabetes (OR = 1.73, p = 0.01), diabetes (OR = 2.02, p = 0.003), and fatty liver (OR = 2.40, p = 0.002) in multivariable models accounting for confounding by age, sex, years in the US, education, fish protein, and a lindane isomer α-hexachlorocyclohexane. Furthermore, p,p′-DDT levels were associated with increased hepatic fat and circulating insulin, as well as decreased insulin sensitivity, independent of obesity and confounders. These findings suggest that p,p′-DDT exposure may contribute to the risk of metabolic disease among Asian Indians by affecting hepatic fat levels independent of obesity.
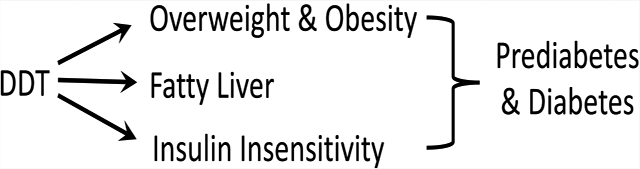
Graphical Abstract
INTRODUCTION
Although the production and use of many persistent organic pollutants (POPs) were initially banned in 2004 under the United Nations Stockholm Convention, they remain a health hazard of concern worldwide due to numerous sources of ongoing exposure.1 For example, POPs are stored in animal fat and bioaccumulate to remain throughout food webs worldwide resulting in POP contamination of human diets even in countries where POPs are banned. Further, POPs remain in production and use in countries that have not ratified the Stockholm Convention, including India and other South Asian countries. For example, polychlorinated biphenyls (PCBs) will not be phased out in India until 2025, and the organochlorine pesticide dichlorodiphenyltrichloroethane (DDT), though banned in some nations, continues to be used for disease vector control throughout the world. Mexico only recently banned the use of DDT, and countries in Africa and Asia continue to use it. India is the largest producer and user of DDT.2,3 It is therefore not surprising that the environment, food products, and human population of the Indian subcontinent including Sri Lanka, Pakistan, and Bangladesh are highly contaminated with DDT beyond the levels typically observed where DDT is not manufactured or used currently, and there is no sign that these levels are declining.4 Further, global migration brings these highly exposed South Asians into countries that banned POPs decades ago. For example, more than 20 years after migrating to the United Kingdom (U.K.), South Asians living in London were reported to have 3- to 30-fold higher circulating levels of POPs including the pesticide DDT and its metabolite dichlorodiphenyldichloroethane (DDE) compared to Europeans in the same city.5
South Asians (individuals from India, Pakistan, Bangladesh, Nepal, Sri Lanka, and Bhutan) make up one-fifth of the world’s population and are one of the fastest-growing immigrant groups in the United States (US). Compared to other race/ethnic groups, South Asians have a much higher risk of diabetes. For example, in an analysis of adults (44–84 years old) with no known cardiovascular disease that were residing in the US from 2010 to 2013, it was reported that South Asians had significantly higher age-adjusted prevalence of diabetes (23%) than other ethnic groups (6% in whites, 18% in African Americans, 17% in Latinos, and 13% in Chinese Americans).6 This difference increased further after adjustment for potential confounders. There are over 80 million diabetic individuals in India itself and many more in the South Asian diaspora, but the reasons for this elevated risk are unclear.6–11 In European and American societies, type 2 diabetes (T2D) is tightly coupled to obesity. For example, a rise in obesity over a few years in Western countries is usually followed by a proportional rise in diabetes.12,13 However, obesity does not entirely explain the higher risk of type 2 diabetes in South Asians, where the increase in diabetes rates is not explained by obesity as much as is generally observed in Western countries.14–16 Extensive consortium studies have been conducted to attribute this risk to unknown biological vulnerability (e.g., genetic polymorphisms and multiomics approaches), but these efforts have explained only a small proportion of the increased type 2 diabetes (T2D) risk.17–19
One possible nongenetic explanation for the increased risk of diabetes in South Asians is a higher body burden of POPs that have been associated with diabetes in numerous studies.20,21 Positive associations between various POPs and T2D have been reported, including many organochlorine pesticides and other compounds, such as trans-nonachlor, DDT, DDE, lindane (γ-hexachlorocyclohexane, γ-HCH), polychlorinated biphenyls (PCBs), dioxins, and dioxin-like chemicals.20,21 A mixture assessment of the National Health and Nutrition Examination Survey (NHANES) also found that these POPs (DDE, many PCBs, dioxins, a furan, and heptachlor epoxide) were significantly associated with the prevalence of T2D.22 Recently, Daniels et al. reported that diabetic South Asian immigrants from Sri Lanka and India to West London, U.K., had a higher body burden of DDE and the lindane contaminant β-HCH than those without diabetes.5
One mechanism of insulin resistance that may be operating with POP exposure is the decreased insulin signaling caused by the lipotoxicity of excess hepatic lipids.23 Experimental evidence from nonhuman primates and rodents strongly supports a role of POPs, e.g., DDT, DDE, PCBs, and polybrominated diphenyl ether flame retardants (PBDEs), in causing increased hepatic lipids and insulin resistance.24–32 Although DDT was undetectable in the only human study of POPs and hepatic fat that we are aware of, PCB 118 was associated with biopsy-diagnosed nonalcoholic steatohepatitis in patients undergoing bariatric surgery.33 We hypothesize that the mechanism by which POPs increase diabetes risk in humans is insulin resistance from excess ectopic fat deposition in the liver. Here, we examine this hypothesis in a US cross-sectional study of Asian Indian immigrants (the metabolic syndrome and atherosclerosis in South Asians living in America (MASALA) pilot study) with extensive clinical and imaging data and have measured a number of chemicals using a gas chromatography–tandem mass spectrometry (GC–MS/MS) analytical method to measure POPs in less than 0.5 mL of plasma.
MATERIALS AND METHODS
Study Design.
The MASALA pilot study design, sampling, recruitment, and enrollment have been described elsewhere.15 Briefly, our sampling frame was created using the South Asian surnames. We obtained the name, address, and telephone number from randomly sampled households from the Bay Area using a commercial mailing list company (Genesys Marketing System Group, Washington, PA). We mailed letters and conducted phone calls to assess study eligibility. After mailing 3484 letters, we were unable to contact 1,897 (54.4%) of families by phone. Of approximately 1587 households reached by phone, 1091 (68.7%) did not have an eligible member primarily due to a young age. Another 346 (21.8%) were not interested, of whom approximately 98 (28%) were eligible for the study. Of all eligible persons, we enrolled 150/248 (60.5%) Asian Indian participants from the San Francisco Bay area of California in this study from August 2006 until October 2007. This rate is similar to the MESA Exam 1 participation rate (59.8%) of those screened and deemed eligible.6 People were eligible if they were between the ages of 45 and 84 years, self-identified as Asian Indian, and were able to speak and read English or Hindi. They were excluded if they had any known cardiovascular disease or had any procedures or surgeries of their heart or blood vessels, were undergoing cancer therapy, were cognitively impaired, had a life expectancy of less than 5 years, planned to move from the San Francisco Bay area, or lived in a nursing home. Age, sex, income, education, and years in the US were self-reported during enrollment. Macronutrient intake was assessed with a food frequency questionnaire developed and validated in South Asians in the study of health assessment and risk in ethnic (SHARE) groups.34 All participants provided consent to the use of their biospecimens for future novel assays that were related to diabetes and other cardiovascular diseases. The MASALA study has had continuous institutional review board’s (IRB) approval from the University of California at San Francisco. The use of the deidentified biospecimens and data was deemed as nonhuman subjects research by the University of California Davis.
Clinical Chemistry and Body Composition of MASALA Participants.
Following a 12 h overnight fast, a 75 g oral glucose tolerance test (OGTT) was administered to all individuals, and blood samples were obtained just before glucose ingestion (time 0) and then 30, 60, 90, and 120 min postchallenge for plasma glucose and serum insulin measurements. OGTT was not performed on participants who were on hypoglycemic medications for diabetes. Fasting plasma glucose levels were analyzed using the hexokinase method using an automated analyzer (YSI 2300 STAT Plus, YSI Life Sciences, Yellow Sprints, OH), and serum insulin was measured by radioimmunoassay (Millipore, St. Charles, MO). Total cholesterol and triglycerides were measured by enzymatic methods (Quest, San Jose, CA).
Glucose tolerance status was determined according to the American Diabetes Association definitions.35 Diabetes was classified by the American Diabetes Association criteria:36 if fasting glucose ≥126 mg/dL and/or 2 h postchallenge glucose ≥200 mg/dL and/or the use of a diabetes medication; prediabetes was classified if fasting glucose was 100–125 mg/dL and/or 2 h glucose was 140–199 mg/dL; normal glucose tolerance was classified for fasting glucose < 100 mg/dL and 2 h glucose < 140 mg/dL. Insulin resistance was estimated by measures that are correlated to the gold-standard euglycemic hyperinsulinemic clamp including fasting insulin37 and the Matsuda index (insulin sensitivity index, ISI).38,39 This index has previously been used on MASALA participants.40
Trained staff measured the participants’ height, weight, and waist circumference. Overweight (≥23 kg/m2) and obesity (≥27.5 kg/m2) utilized the public health action points recommended for many Asian populations by the World Health Organization.41 Participant weight was measured on a standard balance beam scale, and height was measured using a stadiometer. Waist circumference was measured using a Gullick II tape at the site of the maximum circumference midway between the lower ribs and the anterior superior iliac spine. A waist circumference of at least 80 cm in women or at least 90 cm in men was also defined as obese, as recommended for South Asians.42 Assessment of liver attenuation by the use of unenhanced computed tomography (CT) represents an objective and noninvasive means for the detection of asymptomatic hepatic steatosis, whereas clinical risk factor assessment is unreliable.43 Noncontrast computed tomography (CT) images were obtained with a cardiac-gated CT scanner (Phillips 16D) to assess hepatic fat attenuation.16 CT images of liver and spleen density were used to quantify hepatic fat content.43 CT measurements included minimal, maximal, and mean attenuation at a minimum of two liver sites and one spleen measurement. Hepatic fat content was defined by a liver-to-spleen attenuation ratio of Hounsfield units (HUs) < 1, and lower values represent higher amounts of hepatic fat. Steatosis was a dichotomous variable with hepatic fat attenuation < 40 HU.15,44,45
Analytical Chemistry Materials.
Hexane (certified ACS, 98.5% purity), acetone (certified ACS, 99.5% purity), methyl tert-butyl ether (MTBE; HPLC grade, >99% purity), dichloromethane (DCM; Optima grade, 99.9% purity), and anhydrous sodium sulfate (certified ACS, 99% purity) were purchased from Thermo Fisher Scientific (Waltham, MA). The following standard mixtures were purchased from Accustandard (New Haven, CT, product numbers shown in parentheses): AccuGrand 8270 semivolatile standard (M-8270-AG01-ASL), method 525.2 organochlorine pesticides (M-525.2-CP-ASL), PBDE congeners of primary interest calibration mix (BDE-CM), PCB congeners mix 2 (AE-00041), pesticide mix 1 (AE-00010), dioxin mix (M-8280A), WHO/NIST/NOAA congener list (C-WNN), and pesticide/herbicide mix (M-551.1C). Individual standards for PCB congeners 65 and 166 were also purchased from Accustandard. SV calibration mix #5/610 PAH mix (product number: 31011) was purchased from Restek (Bellefonte, PA). Florisil solid-phase extraction (SPE) cartridges (HyperSep) were purchased from Thermo Fisher Scientific. Nitrogen and helium gases (99.999% purity) were purchased from Airgas (Radnor, PA). Charcoal-stripped fetal bovine serum (FBS) was purchased from Sigma-Aldrich.
POP Extraction Procedure.
Liquid–liquid extraction and sample cleanup procedures were based on published methods.46 Briefly, plasma samples (250–500 μL, typically ~400 μL) were taken from participants during the baseline examination (August 2006–October 2007) while the participants were fasting for at least 12 h and stored −80 °C with no thaws prior to POP extraction (2017–2018). Plasma was thawed at room temperature for 30 min and then vortexed twice for 15 s. The sample volume was recorded, and the plasma was transferred to a vial containing 5 mL of 1:1 hexane/acetone and 10 μL of a 70 pg/μL spike solution containing PCB congeners 166 and 65 as internal recovery surrogates. The vials were vortexed and allowed to stand overnight at room temperature. The contents of each vial were loaded, along with two 3 mL rinses with hexane/acetone, onto SPE cartridges preconditioned with 5 mL of MTBE. Analytes were eluted into 40 mL of glass centrifuge tubes with three rinses of 5 mL of MTBE, followed by a single rinse of 5 mL of DCM. Following elution, the glass centrifuge tubes were placed in a nitrogen evaporator (Multivap Evaporator, Organomation, Berlin, MA) operated at 45 °C under a gentle stream of ultrahigh-purity N2 gas until the eluent volume was reduced to ca. 1 mL. The reduced extracts were then transferred to clear autosampler vials along with two 0.5 mL hexane rinses using glass Pasteur pipettes and evaporated to 0.1 mL at 45 °C under a gentle stream of ultrahigh-purity N2 gas (Reacti-Vap, Thermo Fisher Scientific). The extracts were then transferred along with two 50 μL hexane rinses to preweighed amber autosampler vials fitted with 300 μL glass inserts. The vials were capped, weighed, and stored at 4 °C until analysis.
Analytical Chemistry Methods.
Plasma extracts were analyzed using an Agilent 7890 gas chromatograph-7010 C triple quadrupole mass spectrometer (Agilent Technologies, Santa Clara, CA) equipped with a cooled injection system (CIS; GERSTEL, Mülheim an der Ruhr, Germany). Separation was achieved on a 30 m DB-35MS Ultra inert column (Agilent Technologies; 250 μm phase thickness, 0.25 mm inner diameter). Samples (1 μL) were injected into the CIS inlet in split-less mode using an inlet temperature program starting at 70 °C, ramping at a rate of 12 °C/s to 300 °C, and holding at 300 °C for 10 min. Helium served as the carrier gas, delivered at a flow rate of 1 mL/min, and the oven temperature program was 50 °C for 1.3 min, increased at 35 °C/min to 200 °C, increased at 3 °C/min to 290 °C, increased at 10 °C/min to 340 °C, and then held for 5 min. The ion source was operated at a temperature of 230 °C, while the quadrupole detectors were held at 150 °C, with a collision gas (nitrogen) flow of 1.5 mL/min and a quench gas (helium) flow of 2.25 mL/min.
The mass spectrometer was operated in multiple reaction monitoring (MRM) mode with two transitions monitored for each analyte. Transitions and collision energies were optimized using the Agilent MRM acquisition optimization tools software program (version B.07.00). A dwell time of 10 milliseconds was used for all transitions. A list of transitions and collision energies for the 30 POPs and the two PCBs used as internal recovery surrogates is provided in Table S1. MassHunter quantitative data analysis (version B.07.01, Agilent Technologies) was used to integrate and quantitate analyte peak areas. Eleven-point calibration curves over a 6-order-of-magnitude concentration range were prepared by the sequential dilution of a multistandard (i.e., a combination of Accustandard and Restek). To address the potential effects of the background matrix on analyte response, calibration standards were prepared by extracting 400 μL of charcoal-stripped FBS that had been spiked with the analyte mixtures.
Quality Assurance and Quality Control.
Accuracy and reproducibility of the analytical method were determined by routinely measuring POP levels in positive controls consisting of NIST SRM 1958 (Standard Reference Material 1958: Organic Contaminants in Fortified Human Serum, purchased from the National Institute of Standards & Technology, Gaithersburg, MD), for which concentrations have been confirmed by NIST, the US Centers for Disease Control, and an interlaboratory study (see Table S2).47 This approach has been widely used to validate analytical methods for quantifying POPs in plasma and serum samples.48–51 Plasma and serum samples were considered equivalent to each other for the purposes of pollutant analysis.52,53 Quality control cutoffs of ±35% error and a relative standard deviation of <15% were established based on similar studies.49,54–56 Results for compounds with NIST SRM 1958 values outside these cutoffs were not analyzed further (see Results and Discussion). In addition, a charcoal-stripped FBS method blank (negative control) was included in every 20 samples to monitor for sample contamination. Method blank median and interquartile range (IQR) for each compound are reported in Table 1. For one compound, pyrene, the median method blank concentration was over five times the limit of detection (LOD) value and had an interquartile range of 22% of the median value. Therefore, blank subtraction was carried out by subtracting the median method blank value from each measured concentration for pyrene. The LOD for each compound is shown in Table 1 and was estimated as the lowest calibrated level at which analyte peaks met the following four conditions: signal/noise ratio > 3, retention time ± 0.1 min of the highest calibration standard’s retention time, the peak area above that of the instrumental blank (clean solvent), and the qualifier ion ratio within ±20% of the highest calibration standard’s ratio.57 For compounds with <100% detects, the median was computed by substituting LOD/√2 for all nondetects. PCB congeners 65 and 166 were used as internal recovery surrogates because they were not used in commercial PCB formulations. The median recovery for PCB 65 and 166 was 100%, and the average was 103%.
Table 1.
Plasma Levels of 20 Chemicals Measured in 147 Participants in the MASALA Pilot Studya
| chemical name | LOD (ng/mL) | method blank median ± IQR (ng/mL) | Percent detected | median (minimum—maximum) (ng/mL) | median (minimum—maximum) (ng/g lipid) |
|---|---|---|---|---|---|
| α-chlordane | 0.010 | 0.022 ± 0.016 | 100% | 0.0320 [0.0103–0.0938] | 4.80 [1.70–13.3] |
| β-HCH | 0.010 | 0.011 ± 0.014 | 100% | 2.09 [0.0646–131] | 329 [10.0–18,000] |
| δ-HCH | 0.010 | 0.011 ± 0.0079 | 97% | 0.0260[<0.0100–0.0666] | 4.02 [<1.60–10.3] |
| Mirex | 0.0050 | 0.0008 ± 0.0015 | 69% | 0.0069 [<0.0050–0.0378] | 1.14 [<0.810–5.80] |
| trans-nonachlor | 0.0025 | 0.015 ± 0.015 | 100% | 0.110 [0.0229–0.752] | 16.9 [4.60–132] |
| heptachlor | 0.013 | 0.011 ± 0.0070 | 62% | 0.0144 [<0.0130–0.0282] | 2.27 [<2.00–6.90] |
| hexachlorobenzene | 0.013 | 0.098 ± 0.031 | 100% | 0.173 [0.100–0.388] | 28.0 [15.6–101] |
| o,pʹ-DDE | 0.0025 | 0.0060 ± 0.0038 | 100% | 0.0101 [0.0035–0.0583] | 1.70 [0.500–8.90] |
| o,pʹ-DDT | 0.0050 | 0.0047 ± 0.0058 | 99% | 0.0229 [<0.0050–1.37] | 4.20 [<0.810–209] |
| p,pʹ-DDEb | 0.0050 | <0.0001 ± 0.0001 | 100% | 12.1 [0.557–182] | 1,850 [85.1–27,900] |
| p,pʹ-DDTb | 0.0050 | 0.042 ± 0.025 | 100% | 0.280 [0.0567–18.3] | 44.8 [8.67–2,880] |
| PBDE 100 | 0.0032 | 0.058 ± 0.071 | 100% | 0.0856 [0.0061–3.56] | 12.7 [1.00–605] |
| PBDE 153 | 0.016 | 0.042 ± 0.36 | 94% | 0.0921 [<0.0160–1.67] | 14.6 [<2.50–286] |
| PBDE 154 | 0.016 | 0.033 ± 0.10 | 78% | 0.0375 [<0.0160–1.11] | 6.25 [<2.50–182] |
| PCB 126 | 0.0050 | 0.0019 ± 0.0056 | 100% | 0.0450 [0.0247–0.100] | 7.30 [3.10–26.0] |
| PCB 169 | 0.0050 | 0.0018 ± 0.0037 | 89% | 0.0099 [<0.0050–0.0319] | 1.59 [<0.810–5.20] |
| PCB 180 | 0.011 | 0.045 ± 0.012 | 100% | 0.132 [0.0250–0.671] | 21.6 [5.30–97.2] |
| 2,3,7,8-TCDD | 0.0025 | 0.019 ± 0.011 | 100% | 0.0235 [0.0069–0.0497] | 3.80 [0.900–11.5] |
| benzo[a]pyrene | 0.0050 | 0.071 ± 0.024 | 100% | 0.0673 [0.0189–0.232] | NRd |
| pyrenec | 0.50 | 2.7 ± 0.60 | 62% | 0.718 [<0.500–7.49] | NR |
Method blank results are for charcoal-stripped fetal bovine serum (n = 7) extracted alongside samples and are reported as the method blank median ± method blank interquartile range (IQR). Limit of detection (LOD) determined as the lowest calibration standard with signal-to-noise ratio >3.
Concentrations corrected for measured 17% conversion of p,p′-DDT to p,p′-DDE in the column inlet.
Median method blank concentration was subtracted.
Concentrations of polycyclic aromatic hydrocarbons (PAHs) are not typically reported (NR) per lipid weight.
Statistical Analysis.
Volumetric chemical concentrations were adjusted by lipid weight, which was estimated from sample-specific cholesterol and triglyceride measurements according to the Phillips equation.58 All continuous variables were evaluated for normality (PROC UNIVARIATE) and were log base 2 transformed when skew was evidenced visually. POPs for which less than 75% of samples were above the LOD were excluded from further analysis. The MASALA pilot study was composed of 150 subjects. Two samples were compromised during SPE, and one sample was not available for extraction. These samples were excluded from the analysis. Two participants of the remaining 147 were born in the US; thus, their years of residency were equivalent to their age. One subject born outside the US had missing glucose homeostasis parameters, e.g., mean glucose, insulin, and insulin sensitivity. An additional 13 subjects did not have a liver/spleen or fatty liver evaluation, and one of these did not have waist circumference recorded, resulting in 134 observations of these outcomes.
Continuous outcomes (BMI, waist circumference, liver-to-spleen attenuation, glucose, insulin, and insulin sensitivity index) were modeled using generalized linear regression models (PROC GLM, SAS 7.0). Categorical outcomes (normal/prediabetes/diabetes, normal/overweight/obese, normal/fatty liver) were modeled using generalized logistic regression models (PROC LOGISTIC link = glogit). Each POP was evaluated in an unadjusted simple59 model of BMI and waist circumference. POPs that were significantly associated with both adiposity metrics were further evaluated in multivariable models including those of other outcomes.
Variables that were considered plausible confounders included age (years), time residing in the US (years), sex, education attainment (less than or completed high school, less than a bachelors degree, holding a bachelors degree, and more than a bachelors degree), family income (at or less than USD 40 000, USD 40 000–74 999, USD 75 000–99 999, and at or above USD 100 000), total calories per day, total calories from fat per day, total protein from fish per day, and POPs. Correlations among plausible confounders, exposures, and outcomes were evaluated to inform subsequent model building (Pearson for continuous, Spearman for categorical, SAS PROC CORR, visualized in MATLAB). Highly correlated and structurally similar POPs (e.g., p,p′-DDT and o,p′-DDT, herein referred to as DDTs) were summed in analyses to avoid potential colinearity; the one sample with undetected o,p′-DDT was treated as zero for the presentation of those results. Among variables that were significantly correlated with both POPs and outcomes, variables were included in the presented multivariable models if they changed the regression coefficient of a POP by more than 10% compared to those of simple (e.g., one independent POP variable) models and as informed by our directed acyclic graph, which distinguished confounding from mediating variables.60
Several sensitivity analyses were performed. A sensitivity analysis of final confounder-adjusted multivariable models of continuous outcomes was conducted to evaluate the effects of bias resulting from one undetected o,p′-DDT sample. In these two alternative scenarios, the undetected o,p′-DDT was replaced with half of the LOD, or all of the data for the subject was deleted. Because the outcomes are biologically related to lipid homeostasis, the sensitivity of multivariable models to lipid adjustment was also evaluated using log base 2 transformed volumetric wet weights of DDTs with and without total lipids as a separate model term. We evaluated whether our interpretation of DDT effects would change if we used the WHO 1993 BMI cut-points, 30 kg/m2 > overweight ≥ 25 kg/m2 and obese ≥ 30 kg/m2, in multivariable models.41 Some exploratory models of mediation were presented as adjusted by BMI-based categories instead of waist-based categories because one waist value was missing.
RESULTS AND DISCUSSION
Measurement of POPs in MASALA Participants.
Lipid-adjusted and volumetric concentrations of 20 POPs in the plasma for the 147 study participants analyzed by GC–MS/MS are shown in Table 1. The majority of these 20 chemicals, including 2,3,7,8-tetrachlorodibenzo-p-dioxin (2,3,7,8-TCDD) and all isomers of DDT and DDE, were detected in >80% of the samples even though less than 0.5 mL of plasma was used in the analytical procedure. Results for nine of the original 29 chemicals (γ-chlordane, α-HCH, γ-HCH, PBDE 47, PBDE 99, PBDE 183, PCB 118, PCB 153, and PCB 206) were not subjected to further analysis because the NIST SRM 1958 results were outside the acceptable quality control ranges of ±35% error and <15% RSD.49,54–56 Analysis of NIST SRM 1958 for the 20 reported chemicals yielded accuracies within the range of −24–32% error. Precision, as measured by the relative standard deviation, was below 14% for all 20 chemicals. Additional details of the quality assurance data are reported in the Supporting Information, Table S2. We suspect that intersample variance results from life circumstance rather than imprecision given that exposures to pesticides in MASALA and in India vary across 3 orders of magnitude. For example, a review of exposure assessments throughout India documented ∑DDT concentrations in blood ranged from 8 to 3856.7 μg/l (nonlipid-adjusted) and ∑HCH concentrations ranged from 6 to 2633.7 μg/l (nonlipid-adjusted) depending on the occupation, age, and location of the individuals studied.4
Among POPs measured in MASALA, only certain organochlorine pesticides and their metabolites were significantly inversely associated with years in the US (each doubling of β-HCH, p,p′-DDE, p,p′-DDT, o,p′-DDE, and o,p′-DDT was associated with 4.6 (95% CI: −5.9, −3.3), 4.4 (4.5) (95% CI: −6.2, −2.8), 5.2 (95% CI: −6.8, −3.6), 6.1 (95% CI: −10.6, −1.7), and 4.5 (95% CI: −6.3, −2.7) fewer years in the US, respectively). One PCB isomer and trans-nonachlor were positively associated with increased time in the US, where each doubling of PCB 180 or trans-nonachlor was associated with 4.0 (95% CI: 2.0, 6.1) or 4.4 (95% CI: 2.5, 6.2) more years in the US, respectively. None of the PBDE flame retardants, 2,3,7,8-TCDD, or benzo[a]pyrene were significantly associated with time in the US.
The circulating levels of p,p′-DDE and p,p′-DDT in MASALA participants were qualitatively higher than those reported contemporaneously in the US and California. For example, median p,p′-DDE plasma concentrations in MASALA (1850 ng/g lipid, assessment years = 2006–2007) were approximately 8 times higher than both the median p,p′-DDE serum concentrations in the US-population-based survey of the US household population aged 20 years and over (NHANES assessment years = 2003–2004) and the median p,p′-DDE in a cohort of pregnant women, of least 27 years old and mostly Hispanic, residing in an agricultural region in California (CHAMACOS cohort, assessment years = 2009–2011).61,62 Further, compared to MASALA participants, median p,p′-DDT was 12× lower among these California farmworkers62 (2003–2004 NHANES did not detect p,p′-DDT at the 50th percentile).61 Indeed, after 2004, NHANES began pooling POP analyses because the POP levels in the US representative sample continued to drop, suggesting that POP exposure differences between MASALA participants and the US representative sample may currently be larger.61 It is difficult to imagine interstudy characteristics that could account for such large exposure assessment differences. For example, the range years of exposure assessment among these three studies encompass less than one half-life of p,p′-DDE or p,p′-DDT.63 Further, while NHANES was designed to represent the age range of the adult US population, its upper 95th percentile confidence boundary (28.7 ng p,p′-DDT/g serum lipids)61 does not encompass the median (38.3 ng p,p′-DDT/g serum lipids) p,p′-DDT level observed in MASALA participants. This suggests that age-associated POP accumulation may also be an unlikely explanation for the relatively high burden of p,p′-DDE and p,p′-DDT in MASALA participants. Finally, while MASALA participants have a higher prevalence of excess adiposity than participants of NHANES or CHAMACOS, comparing p,p′-DDE and p,p′-DDT concentrations relative to serum lipids across these studies normalizes for the effects of differences in adiposity.64
Despite that MASALA participants have been in the US on average for 26 years, p,p′-DDE and p,p′-DDT levels in MASALA participants more closely resemble those reported in the South Asian diaspora. South Indian (Tamil and Telugu) immigrants to the U.K. had p,p′-DDE and p,p′-DDT serum concentrations over eight times the concentrations observed in whites of European descent;5 MASALA participants had 3.5- and 2-fold higher medians than these immigrants, respectively.
Correlations between individual POPs were evaluated by calculating Pearson’s correlation coefficient between each pair of log-transformed chemicals (Figure 1). DDT and DDE isomer exposures were highly correlated (ρ = 0.7–0.9) with each other. This is consistent with the circulating human DDE levels arising from the metabolism of absorbed DDT rather than from DDE contamination of the food supply. PBDEs were also highly correlated with each other (ρ = 0.7–1.0), which was attributed to the presence of several PBDE homologs in commercial-grade mixtures,4 making coexposure to multiple PBDEs likely. The β-HCH and δ-HCH isomers were not correlated with one another. This finding is not surprising because β-HCH is more persistent in biota and the environment than other HCH isomers, and the δ-HCH isomer is not very abundant in general.65,66 The polycyclic aromatic hydrocarbons (PAHs) pyrene and benzo[a]pyrene were also correlated (ρ = 0.7), which is expected as both are combustion byproducts found in cooked and smoked foodstuffs, cigarette, and wood smoke, and as persistent air pollutants.
Figure 1.

Correlation heatmap of log-transformed chemical concentrations. Colors represent the values of Pearson’s linear correlation coefficient (ρ) between the log-transformed distributions of each pair of compounds. High correlations were observed within compound classes such as PBDE congeners, PAHs, and DDT isomers.
Associations of DDT with Adiposity among the Asian Indians in the US.
The majority of MASALA participants were overweight or obese (Table 2). Given the elevated levels of several POPs in MASALA participants compared to those of others reported in the US, one could hypothesize that elevated POP exposure corresponded generally to an elevated risk of adverse metabolic health, measured as elevated BMI and waist circumference. However, most of the POPs measured in the plasma of MASALA participants were not associated with either BMI or waist circumference in simple single-POP linear regression models (Table 3). The exceptions were p,p′-DDT and o,p′-DDT, which were the only POPs that had positive associations with both measures of adiposity. Hence, the lack of associations between adiposity and other lipophilic chemicals measured in MASALA participants suggests that most POPs are not obesogens. Further, given the wide range of times that MASALA participants have lived in the US (0–52 years, presumably equivalent to the time of the last high DDT exposure), it is unlikely that the associations observed with DDT are due to its lipophilic nature and the different volume of distribution and half-life in subjects who are overweight. Instead, our data suggest that the obesogenic effect of DDT observed in this study is explained by pharmacodynamics rather than pharmacokinetics.64
Table 2.
Descriptive Characteristics of Attributes Subsequently Tabulated
| continuous attributes | MASALA (n = 147) minimum | median | IQR | maximum | MASALA (n = 134 imaging set) minimum | median | IQR | maximum |
|---|---|---|---|---|---|---|---|---|
| fish protein (g/day) | 0 | 0.6 | 3.3 | 27.4 | 0 | 0.8 | 3.2 | 27.4 |
| age (yrs) | 45 | 60 | 12 | 83 | 45 | 60 | 11 | 83 |
| time in US (yrs) | 0 | 26 | 18 | 52 | 0 | 26 | 17 | 52 |
| total cholesterol (mg/dL) | 96 | 185 | 48 | 275 | 96 | 185 | 48 | 275 |
| triglycerides (mg/dL) | 41 | 117 | 73 | 331 | 41 | 116 | 74 | 331 |
| BMI (kg/m2) | 16.6 | 25.6 | 5.8 | 45.4 | 16.6 | 26.0 | 5.9 | 45.4 |
| waist (cm)a | 44.8 | 94.9 | 14.9 | 139.4 | 44.8 | 96.2 | 14.2 | 139.4 |
| liver-to-spleen attenuation (HU) | 0.43 | 1.25 | 0.27 | 1.82 | ||||
| glucose (mg/dL) | 80.6 | 150.9 | 65.5 | 353.2 | 80.6 | 150.2 | 65.4 | 353.2 |
| insulin (mlU/L) | 9.6 | 67.7 | 66.2 | 464.1 | 9.6 | 65.7 | 66.2 | 464.1 |
| ISI (Matsuda) | 0.4 | 3.2 | 2.3 | 18.7 | 0.4 | 3.2 | 2.4 | 18.7 |
| Discrete Attributes | Counts | % | Counts | % | ||||
| Sex | ||||||||
| female | 73 | 49.7 | 65 | 48.5 | ||||
| male | 74 | 50.3 | 69 | 51.5 | ||||
| Education | ||||||||
| <HS | 18 | 12.2 | 16 | 11.9 | ||||
| <bachelors | 16 | 10.9 | 13 | 9.7 | ||||
| bachelors | 34 | 23.1 | 32 | 23.9 | ||||
| >bachelors | 79 | 53.7 | 73 | 54.5 | ||||
| Family Income | ||||||||
| <USD 40k | 23 | 15.6 | 20 | 14.9 | ||||
| USD 40k–74 999 | 27 | 18.4 | 25 | 18.7 | ||||
| USD 75k–99 999 | 21 | 14.3 | 19 | 14.2 | ||||
| >USD 100 000 | 76 | 51.7 | 70 | 52.2 | ||||
| BMI-based Body Composition | ||||||||
| normal | 41 | 27.9 | 35 | 26.1 | ||||
| overweight | 56 | 38.1 | 50 | 37.3 | ||||
| obese | 50 | 34.0 | 49 | 36.6 | ||||
| Waist-based Body Compositiona | ||||||||
| normal | 27 | 18.5 | 22 | 16.5 | ||||
| obese | 119 | 81.5 | 111 | 83.5 | ||||
| Liver Status | ||||||||
| normal | 110 | 82.1 | ||||||
| fatty | 24 | 17.9 | ||||||
| Diabetes Status | ||||||||
| absent | 49 | 33.3 | 46 | 34.3 | ||||
| prediabetic | 56 | 38.1 | 51 | 38.1 | ||||
| diabetic | 42 | 28.6 | 37 | 27.6 | ||||
n = 146 and 133 for waist in MASALA and the imaging subset, respectively.
Table 3.
Simple (Invariable) Models of POPs and Continuous Adiposity Outcomes Measured in MASALA Participants (n = 147 for BMI and 146 for Waist)a
| log-transformed after lipid adjustment | change in BMI (kg/m2) per doubled POP | n | change in Waist circumference (cm) per doubled POP | |||||
|---|---|---|---|---|---|---|---|---|
| slope | 95% CI | value | slope | 95% CI | p-value | n | ||
| α-chlordane | −0.40 | (−1.75, 0.96) | 0.56 | 147 | −0.56 | (−4.11, 2.98) | 0.75 | 146 |
| β-HCH | 0.12 | (−0.30, 0.55) | 0.56 | 147 | 1.68 | (0.60, 2.76) | 0.002 | 146 |
| trans-nonachlor | −0.36 | (−1.16, 0.42) | 0.36 | 147 | 0.89 | (−1.21, 3.00) | 0.40 | 146 |
| hexachlorobenzene | −0.19 | (−1.76, 1.38) | 0.81 | 147 | 1.08 | (−3.03, 5.19) | 0.60 | 146 |
| o,pʹ-DDT | 1.08 | (0.32, 1.84) | 0.005 | 146 | 2.03 | (0.02, 4.05) | 0.048 | 145 |
| o,pʹ-DDE | 0.60 | (1.23, 2.42) | 0.52 | 147 | 1.08 | (−3.69, 5.85) | 0.65 | 146 |
| p,pʹ-DDT | 1.02 | (0.31, 1.73) | 0.005 | 147 | 3.58 | (1.75, 5.40) | 0.0002 | 146 |
| p,pʹ-DDE | 0.68 | (−0.05, 1.42) | 0.07 | 147 | 3.43 | (1.57, 5.29) | 0.0004 | 146 |
| BDE 100 | 0.21 | (−0.17, 0.59) | 0.27 | 147 | 0.87 | (−0.12, 1.86) | 0.08 | 146 |
| BDE 153 | −0.04 | (−0.51, 0.44) | 0.88 | 138 | 0.59 | (−0.65, 1.83) | 0.35 | 137 |
| BDE 154 | −0.05 | (−0.55, 0.45) | 0.85 | 115 | 0.79 | (−0.53, 2.11) | 0.24 | 114 |
| PCB 126 | −0.75 | (−2.53, 1.03) | 0.41 | 147 | 0.82 | (−3.83, 5.48) | 0.73 | 146 |
| PCB 169 | −0.52 | (−2.09, 1.05) | 0.51 | 131 | −0.23 | (−4.31, 3.84) | 0.91 | 131 |
| PCB 180 | −0.38 | (−1.24, 0.48) | 0.39 | 147 | −0.33 | (−2.60, 1.94) | 0.78 | 146 |
| TCDD | −0.15 | (−1.59, 1.29) | 0.84 | 147 | 1.45 | (−2.34, 5.23) | 0.45 | 146 |
| benzo[a]pyrene | 1.29 | (0.10, 2.48) | 0.03 | 147 | 0.22 | (−2.94, 3.37) | 0.89 | 146 |
Significant associations are highlighted with bold text.
Because p,p′-DDT and o,p′-DDT isomers were highly correlated (Figure 1), we performed further analyses that evaluated their sum (termed DDT). DDT was significantly associated with increased adiposity in simple and confounder-adjusted models (models 1 and 2 in Table 4, respectively). As an additional example, between the 25th and 75th percentiles of total DDT exposure in MASALA, there was an associated increased in BMI by 4.43 kg/m2 (95% confidence interval: 1.93, 6.91) and in waist circumference by 13.4 cm increase (95% confidence interval: 7.2, 19.7) in confounder-adjusted models. This association between DDT and adiposity also extended to clinically defined obesity where DDT was associated with increased odds of being overweight (1.83 [1.20, 2.83] for BMI 23–27.5 kg/m2) or obese (2.17 [1.40, 3.36] for BMI > 27.5 kg/m2; and 2.37 [1.42, 3.96] for waist circumference ≥ 80 or >90 cm in women or men, respectively) in confounder-adjusted models. Other POPs, including p,p′-DDE, that were associated with either BMI or waist circumference in (Table 4) simple models were not significant in confounder-adjusted models. This further supports the suggestion that most POPs are not obesogens.
Table 4.
Associations of DDTs (Log Base 2 ng/g Lipids) with Continuous Adiposity (n = 147 for BMI and 146 for Waist)
| Change in BMI (kg/m2) per doubled DDTs | change in Waist circumference (cm) per doubled DDTs | |||||
|---|---|---|---|---|---|---|
| slope | 95% CI | p-value | slope | 95% CI | p-value | |
| model 1a | 0.74 | (0.23, 1.24) | 0.005 | 2.45 | (1.14, 3.76) | 0.0002 |
| model 2b | 1.26 | (0.65, 1.86) | <0.0001 | 3.58 | (2.06, 5.09) | <0.0001 |
Model 1: simple model of DDTs and outcomes.
Model 2: adjusted by confounding variables (age, sex, years in the US, education attainment (less than or completed high school, less than a bachelors degree, holding a bachelors degree, and more than a bachelors degree), and fish protein).
It is difficult to compare the association of DDT and adiposity in MASALA with the published literature as there are very few human populations in which DDT is detected with the frequency required to perform reasonable association analysis. The only other human studies of DDT exposure and adiposity have been in birth cohorts (offspring and mothers). For example, in a study of prenatal exposure to p,p′-DDT at levels nearly 12× lower than in MASALA participants, prenatal p,p′-DDT was associated with the risk of overweight among Spanish children in some secondary analyses (e.g., in boys, in those eating a diet higher in fats).67 In the CHAMACOS study, positive associations were observed between DDT and BMI, waist circumference, and body fat percent.62 However, three studies from the Collaborative Perinatal Project, a US birth cohort with p,p′-DDT levels over 20 times lower than the median in Asian Indians here, found that prenatal p,p′-DDT was not associated with adiposity and/or obesity measures in offspring during their first two decades of life.68–70 Hence, the discrepancy between adiposity associations with p,p′-DDT in these studies may relate to differences in exposure range, exposure age, outcome age, or some combination of these. Additional studies in the broader South Asian population with high DDT exposures should be performed to validate our findings.
We note that the two studies that have examined both DDT exposure and adiposity in experimental animals found that developmental exposure to DDT increased adiposity in adults from subsequent generations in two different rodent species.71,72 Further, a systematic review that applied the National Toxicology Program framework based on the Grading of Recommendations Assessment, Development and Evaluation “GRADE” approach, including a risk of bias assessment, identified 19 in vivo studies and 7 in vitro studies that supported the biological plausibility of the obesogenic effects of DDT.24 These studies revealed that experimental dosing of DDT impaired energy expenditure in vivo and increased adipogenesis in vitro, with molecular changes consistent with these metabolic outcomes. Consistent with this experimental evidence supporting DDT as a presumed obesogen,24 in the present study, we found a positive association between adult DDT blood levels and adiposity, but are unable to presently determine if DDT measured in adults from MASALA was correlated to their prenatal exposure.
Associations of DDT with Hepatic Fat Attenuation among the Asian Indians in the US.
Obesity is characterized by the presence of not only excess lipids in larger adipose depots but also excess fat being present in other tissues as ectopic depots. Nonalcoholic fatty liver disease (NAFLD) is thought to be prevalent in the US but is grossly underdiagnosed. This is because clinical chemistry biomarkers in blood lack specificity to NAFLD, imaging is expensive, and biopsy is painfully invasive. Since high DDT levels were associated with obesity in the present study, and DDT has been shown to increase hepatic fat and induce fatty liver consistently in numerous rodent studies,24 we hypothesized that DDT may also increase the risk of NAFLD in humans. We used CT to measure fat in the liver and spleen of 134 MASALA participants and calculated liver-to-spleen attenuation to determine the presence of fatty liver.15,44,45 This subset of MASALA participants had a very similar distribution of attributes compared to that of the 147 participants analyzed elsewhere. In support of our hypothesis, DDT was associated with a significant decrease in liver-to-spleen attenuation (where a lower attenuation equates to more fat in the liver, model 1; Table 5). Indeed, DDT was associated with a 2.4 increased odds of fatty liver (95% CI: 1.39, 4.14) in confounder-adjusted models (model 2, Table 5).
Table 5.
Associations of DDTs (Log Base 2 ng/g Lipids) with Liver Fat Attenuation and Fatty Liver (n = 134 Subjects)
| change in liver-to-spleen attenuation (HU) per doubled DDTs | odds of fatty liver per doubled DDTs | |||||
|---|---|---|---|---|---|---|
| slope | 95% CI | p-value | odds ratio | 95% CI | p-value | |
| model 11 | −0.035 | (−0.062, −0.009) | 0.009 | 1.40 | (1.07, 1.85) | 0.01 |
| model 22 | −0.051 | (−0.082, −0.020) | 0.001 | 1.66 | (1.11, 2.50) | 0.01 |
| model 33 | −0.042 | (−0.074, −0.010) | 0.01 | 1.52 | (1.0001, 2.30) | 0.0499 |
Model 1: simple model of DDTs and outcomes.
Model 2: adjusted by confounding variables (age, sex, years in the US, education attainment (less than or completed high school, less than a bachelors degree, holding a bachelors degree, and more than a bachelors degree), and fish protein).
Model 2 plus BMI categories: adjusted by age, sex, years in the US, education attainment (less than or completed high school, less than a bachelors degree, holding a bachelors degree, and more than a bachelors degree), fish protein, and obesity/overweight/normal (by BMI >27.5, 27.5–23, or <23 kg/m2, respectively). Note that we adjusted by BMI categories rather than waist circumference categories to maximize sample size.
We continued to explore our hypothesis that obesogenic DDT contributes to ectopic fat accumulation by further adjusting the liver fat models accounting for overweight, obese, or healthy weight status. After this adjustment, the association of DDT and both liver-to-spleen attenuation and odds of fatty liver was modestly attenuated but remained significant (model 3, Table 5). This raises the possibility that DDT primes the liver to be susceptible to fat accumulation through effects that are both dependent and independent of the positive association of DDT on adiposity. Consistent with MASALA, we note that in eight studies identified in a systematic review, rats and mice exposed to a broad range of DDT doses had increased hepatic lipids (e.g., phospholipids, cholesterol, triglycerides), total liver weights, and lipogenic enzymes relative to unexposed control rodents.24 Unfortunately, because none of these rodent studies reported a measurement of total body fat mass,24 we do not know the inter-relationship between the total and hepatic fat mass caused by experimental DDT dosing. Instead, we know that experimental DDT exposure increased lipogenic protein expression (e.g., ACC, ACLY/ATPCL) in the livers of mice.72 Consistent with these protein changes, several isotope tracer studies have demonstrated that DDT increases hepatic lipogenesis.73,74 This experimental evidence suggests that increased hepatic lipogenesis could be a mechanism by which DDT contributes to hepatic fat accumulation.
Associations of DDT with Insulin Insensitivity among the Asian Indians in the US.
A variety of glucose homeostasis parameters were available in MASALA, and we chose to focus on those with continuous measures and no additional missing data. Hence, we evaluated the association of DDT with ISI (Matsuda index) and the metabolic parameters, which underlie this index, e.g., mean glucose and insulin.38–40 DDT was strongly associated with decreased insulin sensitivity in both simple and confounder-adjusted models (models 1 and 2 in Table 6, respectively). These results were consistent with the studies of adult mice where DDT exposure also caused insulin resistance.72 DDT was further associated with 1.55 and 1.72 increased odds of prediabetes and diabetes, respectively, among MASALA participants in confounder-adjusted models (p < 0.05, Table S3). This association agrees with a recent meta-analysis, which found that DDT was significantly associated with an increased summary-odds of T2D.75
Table 6.
Associations of DDTs (Log Base 2 ng/g Lipids) with Biomarkers of Glucose Homeostasis
| change in glucose (mg/dL) per doubled DDTs | change in insulin (mIU/L) per doubled DDTs | change in the Matsuda index per doubled DDTs | ||||||
|---|---|---|---|---|---|---|---|---|
| slope | 95% CI | p-value | slope | 95% CI | p-value | slope | 95% CI | p-value |
| model 1a 2.4 | (−3.8, 8.6) | 0.45 | 9.3 | (2.4, 16.2) | 0.008 | −0.26 | (−0.53, −0.0009) | 0.049 |
| model 2b 5.2 | (−1.6, 12.1) | 0.13 | 12.9 | (4.9, 20.9) | 0.002 | −0.38 | (−0.69, −0.08) | 0.001 |
| model 3c 3.0 | (−4.1, 10.2) | 0.40 | 10.3 | (1.9, 18.7) | 0.02 | −0.22 | (−0.53, 0.10) | 0.17 |
| model 4d 2.5 | (−4.8, 9.7) | 0.50 | 12.4 | (3.6, 21.1) | 0.006 | −0.28 | (−0.60, 0.04) | 0.09 |
| model 5e 0.6 | (−6.9, 8.1) | 0.88 | 10.2 | (1.2, 19.3) | 0.03 | −0.14 | (−0.46, 0.19) | 0.40 |
Model 1: simple model of DDTs and outcomes; n = 147 subjects.
Model 2: adjusted by confounding variables (age, sex, years in the US, education attainment (less than or completed high school, less than a bachelors degree, holding a bachelors degree, and more than a bachelors degree), and fish protein); n = 147 subjects.
Model 2 plus BMI categories: adjusted by age, sex, years in the US, education attainment (less than or completed high school, less than a bachelors degree, holding a bachelors degree, and more than a bachelors degree), fish protein, and obesity/overweight/normal (by BMI >27.5, 27.5–23, or <23 kg/m2, respectively). Note that we adjusted by BMI categories rather than waist circumference categories to maximize sample size; n = 147 subjects.
Model 2 plus fatty liver: adjusted by age, sex, years in the US, education attainment (less than or completed high school, less than a bachelors degree, holding a bachelors degree, and more than a bachelors degree), fish protein, a-HCH, and fatty liver; n = 134 subjects.
Model 2 plus BMI and fatty liver categories adjusted by age, sex, years in the US, education attainment (less than or completed high school, less than a bachelors degree, holding a bachelors degree, and more than a bachelors degree), fish protein, a-HCH, BMI categories, and fatty liver; n = 134 subjects. Note that we adjusted by BMI categories rather than waist circumference categories to maximize sample size; n = 147 subjects.
We next explored how DDT could increase insulin resistance and the odds of diabetes. Although DDT had a positive association with mean glucose, this association was not significant in any of our models (Table 6). Indeed, the reduced insulin sensitivity associated with DDT was not met with any change in glucose but instead was accompanied by a 12.9 mIU/L increase in plasma insulin levels per doubled DDT level in confounder- adjusted models (p = 0.002, model 2; Table 6). A study in nonhuman primates demonstrated that DDT exposure causes excess diabetes comorbid with hepatic steatosis,26 and metabolic research indicates that obesity and fatty liver impair insulin signaling to lead to insulin resistance and diabetes.23,25 However, DDT remained significantly associated with increased insulin levels (about a 10–12 mIU/L insulin increase per doubled DDT concentration) when models accounting for confounding (model 2) were adjusted for hypothesized mediators76–78 [e.g., overweight, obesity, fatty liver (models 3–5, Table 6)]. The positive association between DDT and insulin levels in MASALA participants is consistent with experimental evidence that DDT exposure caused increased circulating insulin in adult mice,72 but is inconsistent with the previous reports that DDT can reduce insulin secretion from human and mouse β cells.79,80 Odds of prediabetes and diabetes associated with DDT were no longer significant when confounder-adjusted models were further adjusted by hypothesized mediators76–78 [e.g., overweight, obesity, fatty liver, and ISI (models 4–7, Table S3)]. These data suggest that DDT may contribute to the odds of diabetes through both excess lipids and insulin resistance.
Numerous sensitivity analyses supported the inferences of this study. The DDT effect size and significance for all continuous outcomes reported here did not change when the undetected o,p′-DDT was replaced with half of the LOD or all of the data for the subject was deleted. The magnitude of DDT vs adiposity associations were tightly upheld in sensitivity analyses where we compared models using DDT adjusted by lipid weight,58 with models using volumetric DDT concentration with and without total lipids as a separate model term (1.36–1.39 kg/m2 change in BMI per doubled DDT or 4.17–4.45 cm change in waist circumference per doubled DDT; Table S4). If we used definitions of obesity and overweight that are insensitive to the distinct risk of being Indian Asian, e.g., 30 kg/m2 > overweight ≥ 25 kg/m2 and obese ≥ 30 kg/m2,41 no significance presented here became insignificant or vice versa, and the effect size estimates were nearly identical. For example, the change in liver-to spleen attenuation (HU) per doubled DDTs was −0.042 (95% CI: −0.073, −0.010), and the odds of fatty liver per doubled DDTs was 1.57 (95% CI: 1.01, 2.43) when the typical 25 and 30 BMI cut-points were substituted into model 3 of Table 5. Further, the change in insulin (mIU/L) per doubled DDTs was 10.1 (95% CI: 1.1, 19.1) when the typical 25 and 30 BMI cut-points were substituted into model 5 of Table 6. Finally, if we substitute the waist-circumference-based obesity variable for the BMI-based obesity and overweight variable, given that estrogen protects against fatty liver and insulin resistance experimentally,81 it is implausible that o,p′-DDT and p,p′-DDT cause the associations observed here through their known activation of the estrogen receptor.82 Future experimental efforts should seek the mechanistic underpinnings of the associations between DDT and adiposity, hepatic fat, and insulin sensitivity seen here. Given steatosis has few approved therapies, there is a potential medical benefit that such mechanistic research could lead to new clinical targets relevant beyond just South Asian patients
This study is limited in sample size and by its cross-sectional design. Exposures and outcomes were measured, not reported, which limits the concern of reporting or recall biases. The analyses further benefit from adjustment by confounding variables typically adjusted for in obesogen analyses, such as age and education.24 Poor diet is a potential source of residual confounding that is not often accounted for in obesogen studies.24 Hence, MASALA was relatively unusual, in that extensive food frequency data was available. This allowed us to determine that the association of DDT with outcomes here was independent of fish consumption, caloric intake, and various dietary fats. Although we did not have physical activity data in MASALA, we suspect this omission was not a strong source of unmeasured confounding given there was no effect of DDT on the physical activity of mice in the only study so far for which this was evaluated,72 and it is implausible that human physical activity levels are associated with their unknown DDT levels. Future studies should evaluate the hypotheses presented here in a larger longitudinal cohort of South Asians, including those with greater metabolic health, to confirm our observations.
Accuracy and precision measurements using NIST SRM 1958 are most applicable when concentrations in the standard reference material are within the same order of magnitude of the concentrations measured in samples. Medians for β-HCH, trans-nonachlor, hexachlorobenzene, p,p′-DDE, p,p′-DDT, and PCB 180 were all >20% of the NIST SRM 1958 certified value. For other chemicals, the median concentrations reported were <20% of the NIST SRM 1958, and therefore their error may be underestimated. Although we could not reach definitive conclusions regarding comparisons of PBDE concentrations to other study populations due to this limitation, because of the qualitatively high levels of PBDE isomers reported herein and their poor characterization in South Asian populations, we recommend that they are included in future biomonitoring of South Asian populations. Another possible limitation of the analytical method is the storage period (ca. 10 years) of the plasma samples between the time of collection and analysis. There is limited documentation on the effects of storage time on measurements of POPs in plasma and serum, but samples stored properly at −80 °C with no thaws are generally considered stable.83 In addition, the studies of POPs in mussel tissue stored at −80 °C over 25 years showed acceptable stability.84
South Asians account for 2% of the US population with over 5.1 million individuals and are the second fastest-growing immigrant group in the US. This study has identified relatively high levels of POPs in South Asians residing in the US. The relatively high levels of DDT among South Asian immigrants in the US. are a cause for increased public health surveillance and awareness given it corresponds to an elevated risk of adverse metabolic health. Overall, the data suggest that DDT is associated with decreased insulin sensitivity, and we suggest that this occurs through excess ectopic fat in Asian Indians leading to an increased risk of diabetes. The findings have public health implications for the ~1.8 billion South Asians throughout the world, especially those in countries still using POPs, and may allow for medical intervention in high-risk individuals with the targets of hepatic fat metabolism examined here.
Supplementary Material
ACKNOWLEDGMENTS
This work is supported by the National Institutes of Health (ES024946 to M.A.L.M.; ES004705 to M.T.S.; MH107205 to K.D.P.) and the USDA National Institute of Food and Agriculture (Hatch 1002182 to M.A.L.M.); the MASALA pilot study was funded by NIH [Grant No K23 HL080026] and NIH UCSF-CTSI Grant No UL1 RR024131.
ABBREVIATIONS
- CT
computed tomography
- DDE
dichlorodiphenyldichloroethane
- DDT
dichlorodiphenyltrichloroethane
- DCM
dichloromethane
- GC–MS/MS
gas chromatography–tandem mass spectrometry
- HCH
hexachlorocyclohexane
- HU
Hounsfield Units
- IRB
Institutional Review Board
- ISI
insulin sensitivity index
- LOD
limit of detection
- MS
mass spectrometry
- MASALA
metabolic syndrome and atherosclerosis in South Asians living in America
- MTBE
methyl tert-butyl ether
- MRM
multiple reaction monitoring
- NHANES
National Health and Nutrition Examination Survey
- OGTT
oral glucose tolerance test
- POPs
persistent organic pollutants
- PBDEs
polybrominated diphenyl ether flame retardants
- PCBs
polychlorinated biphenyls
- PAHs
polycyclic aromatic hydrocarbons
- SPE
solid-phase extraction
- T2D
type 2 diabetes
- U.K.
United Kingdom
- US
United States
Footnotes
Supporting Information
The Supporting Information is available free of charge on the ACS Publications website at DOI: 10.1021/acs.est.9b03373.
Specific details for analytical methods; quality control test results; mass transitions and collision energies used in the MRM mode; MASALA POP concentration comparisons to NHANES; POP sensitivity analyses; and associations with prediabetes and diabetes (PDF)
The authors declare no competing financial interest.
REFERENCES
- (1).Magulova K; Priceputu A Global monitoring plan for persistent organic pollutants (POPs) under the Stockholm Convention: Triggering, streamlining and catalyzing global POPs monitoring. Environ. Pollut 2016, 217, 82–84. [DOI] [PubMed] [Google Scholar]
- (2).Ali U; Syed JH; Malik RN; Katsoyiannis A; Li J; Zhang G; Jones KC Organochlorine pesticides (OCPs) in South Asian region: a review. Sci. Total Environ 2014, 476–477, 705–717. [DOI] [PubMed] [Google Scholar]
- (3).van den Berg H Global status of DDT and its alternatives for use in vector control to prevent disease. Environ. Health Perspect 2009, 117, 1656–1663. [DOI] [PMC free article] [PubMed] [Google Scholar]
- (4).Sharma BM; Bharat GK; Tayal S; Nizzetto L; Cupr P; Larssen T Environment and human exposure to persistent organic pollutants (POPs) in India: a systematic review of recent and historical data. Environ. Int 2014, 66, 48–64. [DOI] [PubMed] [Google Scholar]
- (5).Daniels SI; Chambers JC; Sanchez SS; La Merrill MA; Hubbard AE; Macherone A; McMullin M; Zhang L; Elliott P; Smith MT; Kooner J Elevated Levels of Organochlorine Pesticides in South Asian Immigrants Are Associated With an Increased Risk of Diabetes. J. Endocr. Soc 2018, 2, 832–841. [DOI] [PMC free article] [PubMed] [Google Scholar]
- (6).Kanaya AM; Herrington D; Vittinghoff E; Ewing SK; Liu K; Blaha MJ; Dave SS; Qureshi F; Kandula NR Understanding the high prevalence of diabetes in U.S. south Asians compared with four racial/ethnic groups: the MASALA and MESA studies. Diabetes Care 2014, 37, 1621–1628. [DOI] [PMC free article] [PubMed] [Google Scholar]
- (7).Barnett AH; Dixon AN; Bellary S; Hanif MW; O’Hare JP; Raymond NT; Kumar S Type 2 diabetes and cardiovascular risk in the U.K. south Asian community. Diabetologia 2006, 49, 2234–2246. [DOI] [PubMed] [Google Scholar]
- (8).Tillin T; Hughes AD; Godsland IF; Whincup P; Forouhi NG; Welsh P; Sattar N; McKeigue PM; Chaturvedi N Insulin resistance and truncal obesity as important determinants of the greater incidence of diabetes in Indian Asians and African Caribbeans compared with Europeans: the Southall And Brent REvisited (SABRE) cohort. Diabetes Care 2013, 36, 383–393. [DOI] [PMC free article] [PubMed] [Google Scholar]
- (9).Gujral UP; Pradeepa R; Weber MB; Narayan KM; Mohan V Type 2 diabetes in South Asians: similarities and differences with white Caucasian and other populations. Ann. N. Y. Acad. Sci 2013, 1281, 51–63. [DOI] [PMC free article] [PubMed] [Google Scholar]
- (10).Gujral UP; Narayan KM; Pradeepa RG; Deepa M; Ali MK; Anjana RM; Kandula NR; Mohan V; Kanaya AM Comparing Type 2 Diabetes, Prediabetes, and Their Associated Risk Factors in Asian Indians in India and in the U.S.: The CARRS and MASALA Studies. Diabetes Care 2015, 38, 1312–1318. [DOI] [PMC free article] [PubMed] [Google Scholar]
- (11).Rana A; de Souza RJ; Kandasamy S; Lear SA; Anand SS Cardiovascular risk among South Asians living in Canada: a systematic review and meta-analysis. CMAJ Open 2014, 2, E183–E191. [DOI] [PMC free article] [PubMed] [Google Scholar]
- (12).Seidell JC Obesity, insulin resistance and diabetes–a worldwide epidemic. Br. J. Nutr 2000, 83, S5–S8. [DOI] [PubMed] [Google Scholar]
- (13).Caspard H; Jabbour S; Hammar N; Fenici P; Sheehan JJ; Kosiborod M Recent trends in the prevalence of type 2 diabetes and the association with abdominal obesity lead to growing health disparities in the USA: An analysis of the NHANES surveys from 1999 to 2014. Diabetes Obes. Metab 2018, 20, 667–671. [DOI] [PMC free article] [PubMed] [Google Scholar]
- (14).Singla R; Garg A; Singla S; Gupta Y Temporal Change in Profile of Association between Diabetes, Obesity, and Age of Onset in Urban India: A Brief Report and Review of Literature. Indian J. Endocrinol. Metab 2018, 22, 429–432. [DOI] [PMC free article] [PubMed] [Google Scholar]
- (15).Kanaya AM; Wassel CL; Mathur D; Stewart A; Herrington D; Budoff MJ; Ranpura V; Liu K Prevalence and correlates of diabetes in South asian indians in the United States: findings from the metabolic syndrome and atherosclerosis in South asians living in america study and the multi-ethnic study of atherosclerosis. Metab. Syndr. Relat. Disord 2010, 8, 157–164. [DOI] [PMC free article] [PubMed] [Google Scholar]
- (16).Shah AD; Kandula NR; Lin F; Allison MA; Carr J; Herrington D; Liu K; Kanaya AM Less favorable body composition and adipokines in South Asians compared with other US ethnic groups: results from the MASALA and MESA studies. Int. J. Obes 2016, 40, 639–645. [DOI] [PMC free article] [PubMed] [Google Scholar]
- (17).Kooner JS; Saleheen D; Sim X; Sehmi J; Zhang W; Frossard P; Been LF; Chia KS; Dimas AS; Hassanali N; Jafar T; Jowett JB; Li X; Radha V; Rees SD; Takeuchi F; Young R; Aung T; Basit A; Chidambaram M; Das D; Grundberg E; Hedman AK; Hydrie ZI; Islam M; Khor CC; Kowlessur S; Kristensen MM; Liju S; Lim WY; Matthews DR; Liu J; Morris AP; Nica AC; Pinidiyapathirage JM; Prokopenko I; Rasheed A; Samuel M; Shah N; Shera AS; Small KS; Suo C; Wickremasinghe AR; Wong TY; Yang M; Zhang F; Diagram; MuTher; Abecasis GR; Barnett AH; Caulfield M; Deloukas P; Frayling TM; Froguel P; Kato N; Katulanda P; Kelly MA; Liang J; Mohan V; Sanghera DK; Scott J; Seielstad M; Zimmet PZ; Elliott P; Teo YY; McCarthy MI; Danesh J; Tai ES; Chambers JC Genome-wide association study in individuals of South Asian ancestry identifies six new type 2 diabetes susceptibility loci. Nat. Genet 2011, 43, 984–989. [DOI] [PMC free article] [PubMed] [Google Scholar]
- (18).Anand SS; Meyre D; Pare G; Bailey SD; Xie C; Zhang X; Montpetit A; Desai D; Bosch J; Mohan V; Diaz R; McQueen MJ; Cordell HJ; Keavney B; Yusuf S; Gaudet D; Gerstein H; Engert JC; Epi DGI Genetic information and the prediction of incident type 2 diabetes in a high-risk multiethnic population: the EpiDREAM genetic study. Diabetes Care 2013, 36, 2836–2842. [DOI] [PMC free article] [PubMed] [Google Scholar]
- (19).Chambers JC; Loh M; Lehne B; Drong A; Kriebel J; Motta V; Wahl S; Elliott HR; Rota F; Scott WR; Zhang W; Tan ST; Campanella G; Chadeau-Hyam M; Yengo L; Richmond RC; Adamowicz-Brice M; Afzal U; Bozaoglu K; Mok ZY; Ng HK; Pattou F; Prokisch H; Rozario MA; Tarantini L; Abbott J; Ala-Korpela M; Albetti B; Ammerpohl O; Bertazzi PA; Blancher C; Caiazzo R; Danesh J; Gaunt TR; de Lusignan S; Gieger C; Illig T; Jha S; Jones S; Jowett J; Kangas AJ; Kasturiratne A; Kato N; Kotea N; Kowlessur S; Pitkaniemi J; Punjabi P; Saleheen D; Schafmayer C; Soininen P; Tai ES; Thorand B; Tuomilehto J; Wickremasinghe AR; Kyrtopoulos SA; Aitman TJ; Herder C; Hampe J; Cauchi S; Relton CL; Froguel P; Soong R; Vineis P; Jarvelin MR; Scott J; Grallert H; Bollati V; Elliott P; McCarthy MI; Kooner JS Epigenome-wide association of DNA methylation markers in peripheral blood from Indian Asians and Europeans with incident type 2 diabetes: a nested case-control study. Lancet Diabetes Endocrinol. 2015, 3, 526–534. [DOI] [PMC free article] [PubMed] [Google Scholar]
- (20).Taylor KW; Novak RF; Anderson HA; Birnbaum LS; Blystone C; Devito M; Jacobs D; Kohrle J; Lee DH; Rylander L; Rignell-Hydbom A; Tornero-Velez R; Turyk ME; Boyles AL; Thayer KA; Lind L Evaluation of the association between persistent organic pollutants (POPs) and diabetes in epidemiological studies: a national toxicology program workshop review. Environ. Health Perspect 2013, 121, 774–783. [DOI] [PMC free article] [PubMed] [Google Scholar]
- (21).Lind PM; Lind L Endocrine-disrupting chemicals and risk of diabetes: an evidence-based review. Diabetologia 2018, 61, 1495–1502. [DOI] [PMC free article] [PubMed] [Google Scholar]
- (22).Patel CJ; Bhattacharya J; Butte AJ An environment-wide association study (EWAS) on Type 2 Diabetes Mellitus. PLoS One 2010, 5, No. e10746. [DOI] [PMC free article] [PubMed] [Google Scholar]
- (23).Jelenik T; Kaul K; Sequaris G; Flogel U; Phielix E; Kotzka J; Knebel B; Fahlbusch P; Horbelt T; Lehr S; Reinbeck AL; Muller-Wieland D; Esposito I; Shulman GI; Szendroedi J; Roden M Mechanisms of Insulin Resistance in Primary and Secondary Nonalcoholic Fatty Liver. Diabetes 2017, 66, 2241–2253. [DOI] [PMC free article] [PubMed] [Google Scholar]
- (24).Cano-Sancho G; Salmon AG; La Merrill MA Association between Exposure to p,p’-DDT and Its Metabolite p,p’-DDE with Obesity: Integrated Systematic Review and Meta-Analysis. Environ. Health Perspect 2017, 125, No. 096002. [DOI] [PMC free article] [PubMed] [Google Scholar]
- (25).Ruzzin J; Petersen R; Meugnier E; Madsen L; Lock EJ; Lillefosse H; Ma T; Pesenti S; Sonne SB; Marstrand TT; Malde MK; Du ZY; Chavey C; Fajas L; Lundebye AK; Brand CL; Vidal H; Kristiansen K; Froyland L Persistent organic pollutant exposure leads to insulin resistance syndrome. Environ. Health Perspect 2010, 118, 465–471. [DOI] [PMC free article] [PubMed] [Google Scholar]
- (26).Takayama S; Sieber SM; Dalgard DW; Thorgeirsson UP; Adamson RH Effects of long-term oral administration of DDT on nonhuman primates. J. Cancer Res. Clin. Oncol 1999, 125, 219–225. [DOI] [PMC free article] [PubMed] [Google Scholar]
- (27).Wahlang B; Falkner KC; Gregory B; Ansert D; Young D; Conklin DJ; Bhatnagar A; McClain CJ; Cave M Polychlorinated biphenyl 153 is a diet-dependent obesogen that worsens nonalcoholic fatty liver disease in male C57BL6/J mice. J. Nutr. Biochem 2013, 24, 1587–1595. [DOI] [PMC free article] [PubMed] [Google Scholar]
- (28).Boucher MP; Lefebvre C; Chapados NA The effects of PCB126 on intra-hepatic mechanisms associated with non alcoholic fatty liver disease. J. Diabetes Metab. Disord 2015, 14, No. 88. [DOI] [PMC free article] [PubMed] [Google Scholar]
- (29).Gadupudi GS; Klaren WD; Olivier AK; Klingelhutz AJ; Robertson LW PCB126-Induced Disruption in Gluconeogenesis and Fatty Acid Oxidation Precedes Fatty Liver in Male Rats. Toxicol. Sci 2016, 149, 98–110. [DOI] [PMC free article] [PubMed] [Google Scholar]
- (30).Gadupudi GS; Elser BA; Sandgruber FA; Li X; Gibson-Corley KN; Robertson LW PCB126 Inhibits the Activation of AMPK-CREB Signal Transduction Required for Energy Sensing in Liver. Toxicol. Sci 2018, 163, 440–453. [DOI] [PMC free article] [PubMed] [Google Scholar]
- (31).Shi H; Jan J; Hardesty JE; Falkner KC; Prough RA; Balamurugan AN; Mokshagundam SP; Chari ST; Cave MC Polychlorinated biphenyl exposures differentially regulate hepatic metabolism and pancreatic function: Implications for nonalcoholic steatohepatitis and diabetes. Toxicol. Appl. Pharmacol 2019, 363, 22–33. [DOI] [PMC free article] [PubMed] [Google Scholar]
- (32).Khalil A; Cevik SE; Hung S; Kolla S; Roy MA; Suvorov A Developmental Exposure to 2,2’,4,4’-Tetrabromodiphenyl Ether Permanently Alters Blood-Liver Balance of Lipids in Male Mice. Front. Endocrinol 2018, 9, No. 548. [DOI] [PMC free article] [PubMed] [Google Scholar]
- (33).Rantakokko P; Mannisto V; Airaksinen R; Koponen J; Viluksela M; Kiviranta H; Pihlajamaki J Persistent organic pollutants and non-alcoholic fatty liver disease in morbidly obese patients: a cohort study. Environ. Health 2015, 14, No. 79. [DOI] [PMC free article] [PubMed] [Google Scholar]
- (34).Kelemen LE; Anand SS; Vuksan V; Yi Q; Teo KK; Devanesen S; Yusuf S; Investigators S Development and evaluation of cultural food frequency questionnaires for South Asians, Chinese, and Europeans in North America. J. Am. Diet. Assoc 2003, 103, 1178–1184. [DOI] [PubMed] [Google Scholar]
- (35).American Diabetes, Association. Diagnosis and classification of diabetes mellitus Diabetes Care 2008, 31, S55 S60. [DOI] [PubMed] [Google Scholar]
- (36).American Diabetes Association. Report of the expert committee on the diagnosis and classification of diabetes mellitus Diabetes Care 2003, 26, S5 S20. [DOI] [PubMed] [Google Scholar]
- (37).Laakso M How good a marker is insulin level for insulin resistance? Am. J. Epidemiol 1993, 137, 959–965. [DOI] [PubMed] [Google Scholar]
- (38).Matsuda M; DeFronzo RA Insulin sensitivity indices obtained from oral glucose tolerance testing: comparison with the euglycemic insulin clamp. Diabetes Care 1999, 22, 1462–1470. [DOI] [PubMed] [Google Scholar]
- (39).Bergman RN; Finegood DT; Kahn SE The evolution of beta-cell dysfunction and insulin resistance in type 2 diabetes. Eur. J. Clin. Invest 2002, 32, 35–45. [DOI] [PubMed] [Google Scholar]
- (40).Gujral UP; Narayan KM; Kahn SE; Kanaya AM The relative associations of beta-cell function and insulin sensitivity with glycemic status and incident glycemic progression in migrant Asian Indians in the United States: the MASALA study. J. Diabetes Complications 2014, 28, 45–50. [DOI] [PMC free article] [PubMed] [Google Scholar]
- (41).Consultation, W. H. O. E. Appropriate body-mass index for Asian populations and its implications for policy and intervention strategies. Lancet 2004, 363, 157–163. [DOI] [PubMed] [Google Scholar]
- (42).Zimmet PZ; Alberti KG Introduction: Globalization and the non-communicable disease epidemic. Obesity 2006, 14, 1–3. [DOI] [PubMed] [Google Scholar]
- (43).Boyce CJ; Pickhardt PJ; Kim DH; Taylor AJ; Winter TC; Bruce RJ; Lindstrom MJ; Hinshaw JL Hepatic steatosis (fatty liver disease) in asymptomatic adults identified by unenhanced low-dose CT. Am. J. Roentgenol 2010, 194, 623–628. [DOI] [PubMed] [Google Scholar]
- (44).Jacobs JE; Birnbaum BA; Shapiro MA; Langlotz CP; Slosman F; Rubesin SE; Horii SC Diagnostic criteria for fatty infiltration of the liver on contrast-enhanced helical CT. Am. J. Roentgenol 1998, 171, 659–664. [DOI] [PubMed] [Google Scholar]
- (45).Piekarski J; Goldberg HI; Royal SA; Axel L; Moss AA Difference between liver and spleen CT numbers in the normal adult: its usefulness in predicting the presence of diffuse liver disease. Radiology 1980, 137, 727–729. [DOI] [PubMed] [Google Scholar]
- (46).Hatcher-Martin JM; Gearing M; Steenland K; Levey AI; Miller GW; Pennell KD Association between Polychlorinated Biphenyls and Parkinson’s Disease Neuropathology. NeuroToxicology 2012, 33, 1298–1304. [DOI] [PMC free article] [PubMed] [Google Scholar]
- (47).Technology, N. I. Certificate of Analysis: Standard Reference Material 1958 Organic Contaminants in Fortified Human Serum, 2018. [Google Scholar]
- (48).Guo LC; Pan S; Yu S; Liu T; Xiao J; Zhu B; Qu Y; Huang W; Li M; Li X; Zeng W; Rutherford S; Lin L; Zhang Y; Ma W Human Sex Hormone Disrupting Effects of New Flame Retardants and Their Interactions with Polychlorinated Biphenyls, Polybrominated Diphenyl Ethers, a Case Study in South China. Environ. Sci. Technol 2018, 52, 13935–13941. [DOI] [PubMed] [Google Scholar]
- (49).Hammel SC; Phillips AL; Hoffman K; Stapleton HM Evaluating the Use of Silicone Wristbands To Measure Personal Exposure to Brominated Flame Retardants. Environ. Sci. Technol 2018, 52, 11875–11885. [DOI] [PMC free article] [PubMed] [Google Scholar]
- (50).Liu X; Zhang L; Li J; Wang J; Meng G; Chi M; Zhao Y; Wu Y Relative Effect Potency Estimates for Dioxin-Like Compounds in Pregnant Women with Gestational Diabetes Mellitus and Blood Glucose Outcomes Based on a Nested Case-control Study. Environ. Sci. Technol 2019, 53, 7792–7802. [DOI] [PubMed] [Google Scholar]
- (51).Sethi S; Morgan RK; Feng W; Lin Y; Li X; Luna C; Koch M; Bansal R; Duffel MW; Puschner B; Zoeller RT; Lehmler HJ; Pessah IN; Lein PJ Comparative Analyses of the 12 Most Abundant PCB Congeners Detected in Human Maternal Serum for Activity at the Thyroid Hormone Receptor and Ryanodine Receptor. Environ. Sci. Technol 2019, 53, 3948–3958. [DOI] [PMC free article] [PubMed] [Google Scholar]
- (52).Barr DB; Barr JR; Maggio VL; Whitehead RD Jr; Sadowski MA; Whyatt RM; Needham LL A multi-analyte method for the quantification of contemporary pesticides in human serum and plasma using high-resolution mass spectrometry. J. Chromatogr. B: Anal. Technol. Biomed. Life Sci 2002, 778, 99–111. [DOI] [PubMed] [Google Scholar]
- (53).Uges DR Plasma or serum in therapeutic drug monitoring and clinical toxicology. Pharm. Weekbl., Sci 1988, 10, 185–188. [DOI] [PubMed] [Google Scholar]
- (54).Zong G; Valvi D; Coull B; Goen T; Hu FB; Nielsen F; Grandjean P; Sun Q Persistent organic pollutants and risk of type 2 diabetes: A prospective investigation among middle-aged women in Nurses’ Health Study II. Environ. Int 2018, 114, 334–342. [DOI] [PMC free article] [PubMed] [Google Scholar]
- (55).Vriens A; Nawrot TS; Janssen BG; Baeyens W; Bruckers L; Covaci A; De Craemer S; De Henauw S; Den Hond E; Loots I; Nelen V; Schettgen T; Schoeters G; Martens DS; Plusquin M Exposure to Environmental Pollutants and Their Association with Biomarkers of Aging: A Multipollutant Approach. Environ. Sci. Technol 2019, 53, 5966–5976. [DOI] [PubMed] [Google Scholar]
- (56).Wolf K; Bongaerts BWC; Schneider A; Huth C; Meisinger C; Peters A; Schneider A; Wittsiepe J; Schramm KW; Greiser KH; Hartwig S; Kluttig A; Rathmann W Persistent organic pollutants and the incidence of type 2 diabetes in the CARLA and KORA cohort studies. Environ. Int 2019, 129, 221–228. [DOI] [PubMed] [Google Scholar]
- (57).US Food and Drug Administration. Guidance for Industry: Q2B Validation of Analytical Procedures: Methodology; Rockville: MD, 1996. [Google Scholar]
- (58).Phillips DL; Pirkle JL; Burse VW; Bernert JT Jr; Henderson LO; Needham LL Chlorinated hydrocarbon levels in human serum: effects of fasting and feeding. Arch. Environ. Contam. Toxicol 1989, 18, 495–500. [DOI] [PubMed] [Google Scholar]
- (59).Hidalgo B; Goodman M Multivariate or multivariable regression? Am. J. Public Health 2013, 103, 39–40. [DOI] [PMC free article] [PubMed] [Google Scholar]
- (60).Evans D; Chaix B; Lobbedez T; Verger C; Flahault A Combining directed acyclic graphs and the change-in-estimate procedure as a novel approach to adjustment-variable selection in epidemiology. BMC Med. Res. Methodol 2012, 12, No. 156. [DOI] [PMC free article] [PubMed] [Google Scholar]
- (61).Fourth National Report on Human Exposure to Environmental Chemicals, Updated Tables, January 2019 In Prevention, U. S. D. o. H. a. H. S. C. f. D. C. a., Ed., 2018; Vol. 2. [Google Scholar]
- (62).Warner M; Rauch S; Coker ES; Harley K; Kogut K; Sjodin A; Eskenazi B Obesity in relation to serum persistent organic pollutant concentrations in CHAMACOS women. Environ Epidemiol. 2018, 2, No. e032. [DOI] [PMC free article] [PubMed] [Google Scholar]
- (63).Ritter R; Scheringer M; MacLeod M; Hungerbuhler K Assessment of nonoccupational exposure to DDT in the tropics and the north: relevance of uptake via inhalation from indoor residual spraying. Environ. Health Perspect 2011, 119, 707–712. [DOI] [PMC free article] [PubMed] [Google Scholar]
- (64).La Merrill M; Emond C; Kim MJ; Antignac JP; Le Bizec B; Clement K; Birnbaum LS; Barouki R Toxicological function of adipose tissue: focus on persistent organic pollutants. Environ. Health Perspect 2013, 121, 162–169. [DOI] [PMC free article] [PubMed] [Google Scholar]
- (65).Buser HR; Mueller MD Isomer and Enantioselective Degradation of Hexachlorocyclohexane Isomers in Sewage Sludge under Anaerobic Conditions. Environ. Sci. Technol 1995, 29, 664–672. [DOI] [PubMed] [Google Scholar]
- (66).Li YF Global Technical Hexachlorocyclohexane Usage and Its Contamination Consequences in the Environment: From 1948 to 1997. Sci. Total Environ 1999, 232, 121–158. [Google Scholar]
- (67).Valvi D; Mendez MA; Martinez D; Grimalt JO; Torrent M; Sunyer J; Vrijheid M Prenatal concentrations of polychlorinated biphenyls, DDE, and DDT and overweight in children: a prospective birth cohort study. Environ. Health Perspect 2012, 120, 451–457. [DOI] [PMC free article] [PubMed] [Google Scholar]
- (68).Gladen BC; Klebanoff MA; Hediger ML; Katz SH; Barr DB; Davis MD; Longnecker MP Prenatal DDT exposure in relation to anthropometric and pubertal measures in adolescent males. Environ. Health Perspect 2004, 112, 1761–1767. [DOI] [PMC free article] [PubMed] [Google Scholar]
- (69).Cupul-Uicab LA; Hernandez-Avila M; Terrazas-Medina EA; Pennell ML; Longnecker MP Prenatal exposure to the major DDT metabolite 1,1-dichloro-2,2-bis(p-chlorophenyl)ethylene (DDE) and growth in boys from Mexico. Environ. Res 2010, 110, 595–603. [DOI] [PMC free article] [PubMed] [Google Scholar]
- (70).Cupul-Uicab LA; Klebanoff MA; Brock JW; Longnecker MP Prenatal exposure to persistent organochlorines and childhood obesity in the US collaborative perinatal project. Environ. Health Perspect 2013, 121, 1103–1109. [DOI] [PMC free article] [PubMed] [Google Scholar]
- (71).Skinner MK; Manikkam M; Tracey R; Guerrero-Bosagna C; Haque M; Nilsson EE Ancestral dichlorodiphenyltrichloroethane (DDT) exposure promotes epigenetic transgenerational inheritance of obesity. BMC Med. 2013, 11, 228–244. [DOI] [PMC free article] [PubMed] [Google Scholar]
- (72).La Merrill M; Karey E; Moshier E; Lindtner C; La Frano MR; Newman JW; Buettner C Perinatal exposure of mice to the pesticide DDT impairs energy expenditure and metabolism in adult female offspring. PLoS One 2014, 9, No. e103337. [DOI] [PMC free article] [PubMed] [Google Scholar]
- (73).Nagaoka S; Masaki H; Aoyama Y; Yoshida A Effects of excess dietary tyrosine or certain xenobiotics on the cholesterogenesis in rats. J. Nutr 1986, 116, 726–732. [DOI] [PubMed] [Google Scholar]
- (74).Narayan S; Dani HM; Misra UK Changes in lipid profiles of liver microsomes of rats following intratracheal administration of DDT or endosulfan. J. Environ. Sci. Health, Part B 1990, 25, 243–257. [DOI] [PubMed] [Google Scholar]
- (75).Evangelou E; Ntritsos G; Chondrogiorgi M; Kavvoura FK; Hernandez AF; Ntzani EE; Tzoulaki I Exposure to pesticides and diabetes: A systematic review and meta-analysis. Environ. Int 2016, 91, 60–68. [DOI] [PubMed] [Google Scholar]
- (76).Jornayvaz FR; Birkenfeld AL; Jurczak MJ; Kanda S; Guigni BA; Jiang DC; Zhang D; Lee HY; Samuel VT; Shulman GI Hepatic insulin resistance in mice with hepatic overexpression of diacylglycerol acyltransferase 2. Proc. Natl. Acad. Sci. U.S.A 2011, 108, 5748–5752. [DOI] [PMC free article] [PubMed] [Google Scholar]
- (77).Savage DB; Choi CS; Samuel VT; Liu ZX; Zhang D; Wang A; Zhang XM; Cline GW; Yu XX; Geisler JG; Bhanot S; Monia BP; Shulman GI Reversal of diet-induced hepatic steatosis and hepatic insulin resistance by antisense oligonucleotide inhibitors of acetyl-CoA carboxylases 1 and 2. J. Clin. Invest 2006, 116, 817–824. [DOI] [PMC free article] [PubMed] [Google Scholar]
- (78).Magkos F; Su X; Bradley D; Fabbrini E; Conte C; Eagon JC; Varela JE; Brunt EM; Patterson BW; Klein S Intrahepatic diacylglycerol content is associated with hepatic insulin resistance in obese subjects. Gastroenterology 2012, 142, 1444–1446. [DOI] [PMC free article] [PubMed] [Google Scholar]
- (79).Yau DT; Mennear JH The inhibitory effect of DDT on insulin secretion in mice. Toxicol. Appl. Pharmacol 1977, 39, 81–88. [DOI] [PubMed] [Google Scholar]
- (80).Lee YM; Ha CM; Kim SA; Thoudam T; Yoon YR; Kim DJ; Kim HC; Moon HB; Park S; Lee IK; Lee DH Low-Dose Persistent Organic Pollutants Impair Insulin Secretory Function of Pancreatic beta-Cells: Human and In Vitro Evidence. Diabetes 2017, 66, 2669–2680. [DOI] [PubMed] [Google Scholar]
- (81).Zhu L; Brown WC; Cai Q; Krust A; Chambon P; McGuinness OP; Stafford JM Estrogen treatment after ovariectomy protects against fatty liver and may improve pathway-selective insulin resistance. Diabetes 2013, 62, 424–434. [DOI] [PMC free article] [PubMed] [Google Scholar]
- (82).Loomis D; Guyton K; Grosse Y; El Ghissasi F; Bouvard V; Benbrahim-Tallaa L; Guha N; Mattock H; Straif K; Kogevinas M; Larramendy ML; Stewart BW; Sanderson T; Guenel P; Cocco P; Fukushima S; Cebrian ME; Lopez Carrillo LT; Vermeulen R; Naidoo S; Prapamontol T; Martin FL; Rushton L; Alavanja M; Bosland M; Chhabra RS; Chiu W; De Roos A; Herbert R; La Merrill M; Reif DM; Roy D; Smith MT; Thomas K; Wolff MS Carcinogenicity of lindane, DDT, and 2,4-dichlorophenoxyacetic acid. Lancet Oncol. 2015, 16, No. 891. [DOI] [PubMed] [Google Scholar]
- (83).James RA; Hertz-Picciotto I; Willman E; Keller JA; Charles MJ Determinants of serum polychlorinated biphenyls and organochlorine pesticides measured in women from the child health and development study cohort, 1963–1967. Environ. Health Perspect 2002, 110, 617–624. [DOI] [PMC free article] [PubMed] [Google Scholar]
- (84).Schantz MM; Pugh RS; Pol SSV; Wise SA Long-term stability and temporal trends of organic contaminants in four collections of mussel tissue frozen standard reference materials. Anal. Bioanal. Chem 2015, 407, 3253–3258. [DOI] [PubMed] [Google Scholar]
Associated Data
This section collects any data citations, data availability statements, or supplementary materials included in this article.