Abstract
Background and object: Emerging evidence shows that non-coding RNA functions as new gene regulators and prognostic markers in several cancers, including liver cancer. Here, we focused on the small nucleolar RNA host gene 4 (SNHG4) in liver cancer prognosis based on The Cancer Genome Atlas (TCGA) data.
Methods: The expression data and clinical information were downloaded from TCGA. Chi-square tests evaluated the correlation between SNHG4 expression and clinical parameters. Differences in survival between high and low expression groups (optic cutoff value determined by ROC) from Cox regression analysis were compared, and P-value was calculated by a log-rank test. Kaplan–Meier curves were compared with the log-rank test. GSEA and ceRNA network were conducted to explore the potential mechanism.
Results: Data mining of lncRNA expression data for 371 patients with primary tumor revealed overexpression of SNHG4 in liver cancer. High SNHG4 expression was correlated with histological type (P = 0.01), histologic grade (P = 0.001), stage (P = 0.01), T classification (P = 0.004) and survival status (P = 0.013). Patients with high SNHG4 expression had poor overall survival and relapse-free survival compared with those with low SNHG4 expression. Multivariate analysis identified SNHG4 as an independent prognostic factor of poor survival in liver cancer. GSEA revealed related signaling pathway and ceRNA network explored the further mechanism.
Conclusion: High SNHG4 expression is an independent predictor of poor prognosis in liver cancer.
Keywords: Liver cancer, prognosis, Small Nucleolar RNA Host Gene 4, SNHG4, The Cancer Genome Atlas
Introduction
Liver cancer is one of the most digestive system malignancies in the world [1]. The 5-year survival rate has not improved in spite of recent advance in the treatment of liver cancer. The clinicians apply the histological classification and some biomarkers, such as Ki67, CD34, and AFP, to evaluate patients’ prognosis in the nowadays. However, there is also a challenge for clinicians make a judgment of liver cancer patients’ prognosis. Novel molecular classification for prognosis is urgent.
Non-coding RNA has attracted much attention recently. There have been too many researches about long non-coding RNA and microRNA in the field of oncology. Also, some molecular has been recognized as novel biomarkers for prognosis, including XIST [2], PVT1 [3], and MALT1 [4]. Small nucleolar RNA host gene 4 (SNHG4), a novel non-coding RNA, has first reported in the research of directly irradiated and bystander cells and was found to be up-regulated in irradiated TK6 cells but were repressed in bystander cells [5]. A recent study has revealed that lncRNA SNHG4 was associated with poor survival and recurrence in human osteosarcoma [6].
However, the prognostic role and potential mechanism of SNHG4 in liver cancer remain unclear. In the present study, we explored the SNHG4 expression in liver cancer and compared the relationship between SNHG4 expression and clinical parameters. In the further, we analyzed the effect of SNHG4 on the overall survival and relapse-free survival and made subgroup analysis to explore it in depth. Besides, we studied the related signaling pathway through GSEA and conducted the SNHG4-related ceRNA network.
Materials and methods
Data mining of TCGA database
SNGH4 expression pattern and its prognostic significance were validated from liver cancer tissues paired with normal liver tissues from the TCGA database by RNAseq (IlluminaHiSeq). The optic value of SNGH4 determined by ROC was used as a cutoff for defining the high and low SNGH4 expression groups. HCCDB database (http://lifeome.net/database/hccdb/home.html) was used to validate the results.
Statistical analysis
Statistical analysis was performed using R (version 3.5.1) [7] and R packages including ggplot2 [8], pROC [9], and survival [10]. Patients were divided into two groups (SNHG4 high expression and SNHG4 low expression) by the proper threshold in ROC. Chi-squared tests were applied to assess the association between SNGH4 expression and clinicopathological features. Kaplan–Meier curve compared the overall/relapse-free survival between high and low SNHG4 expression groups with the log-rank test. The independent prognostic value of SNHG4 expression on liver cancer was assessed by univariate and subsequent multivariate Cox regression analysis. Differences were considered significant when P < 0.05.
GSEA
GSEA is a computational method that determines whether an a priori defined set of genes shows statistically significant, concordant differences between two biological states [11,12]. In the present study, GSEA was performed by using the GSEA software 3.0 from the Broad Institute. The gene expression data were RNAseq data from TCGA-LIHC. The gene set of “h.all.v6.2.symbols.gmt”, which summarizes and represents specific, well-defined biological states or processes, was downloaded from the Molecular Signatures Database (http://software.broadinstitute.org/gsea/ msigdb/index.jsp). The normalized enrichment score (NES) was acquired by analyzing with permutations for 1000 times. Gene sets with normal P-value < 0.05 and false discovery rate (FDR) < 0.25 were considered to be significantly enriched.
Conduction of ceRNA network
Differentially expression microRNAs and encoding genes between high SNHG4 group and low SNHG4 group were analyzed using limma packages [13], and adjust P value < 0.05 is presented as significant. The predicted miRNA–mRNA interactions were obtained from starbase v2.0 (http://starbase.sysu.edu.cn/starbase2/index.php) by defeat options [14,15]. The ceRNA network was conducted by merging DEMs, DEGs, and miRNA–mRNA interactions.
Enrichment analysis
Gene Ontology (GO) function and Kyoto Encyclopedia of Genes and Genomes (KEGG) pathway enrichment analysis were performed using the R language Cluster profiler package [16]. The cluster Profiler is a Bioconductor software package that provides statistical analysis of functional clustering of gene sets.
Results
Patient characteristics
The demographic and clinicopathological characteristics gene expression data of 371 patients with liver cancer are analyzed and shown in Table 1.
Table 1. Baseline charateristics of patients with liver cancer.
| Characteristics | Number of patients (%) |
|---|---|
| Age | |
| <55 | 117(31.62) |
| ≥55 | 253(68.38) |
| Gender | |
| FEMALE | 121(32.61) |
| MALE | 250(67.39) |
| Histological type | |
| Fibrolamellar Carcinoma | 3(0.81) |
| Hepatocellular Carcinoma | 361(97.3) |
| Hepatocholangiocarcinoma | 7(1.89) |
| Histologic grade | |
| G1 | 55(14.82) |
| G2 | 177(47.71) |
| G3 | 122(32.88) |
| G4 | 12(3.23) |
| NA | 5(1.35) |
| Stage | |
| I | 171(46.09) |
| II | 86(23.18) |
| III | 85(22.91) |
| IV | 5(1.35) |
| NA | 24(6.47) |
| T classification | |
| T1 | 181(48.79) |
| T2 | 94(25.34) |
| T3 | 80(21.56) |
| T4 | 13(3.5) |
| TX | 1(0.27) |
| NA | 2(0.54) |
| N classification | |
| N0 | 252(67.92) |
| N1 | 4(1.08) |
| NX | 114(30.73) |
| NA | 1(0.27) |
| M classification | |
| M0 | 266(71.7) |
| M1 | 4(1.08) |
| MX | 101(27.22) |
| Radiation therapy | |
| NO | 338(91.11) |
| YES | 8(2.16) |
| NA | 25(6.74) |
| Residual tumor | |
| R0 | 324(87.33) |
| R1 | 17(4.58) |
| R2 | 1(0.27) |
| RX | 22(5.93) |
| NA | 7(1.89) |
| Vital status | |
| DECEASED | 130(35.04) |
| LIVING | 241(64.96) |
| Relapse | |
| NO | 179(56.29) |
| YES | 139(43.71) |
| SNHG4 | |
| High | 75(20.22) |
| Low | 296(79.78) |
SNHG4 expression and association with clinicopathological variables
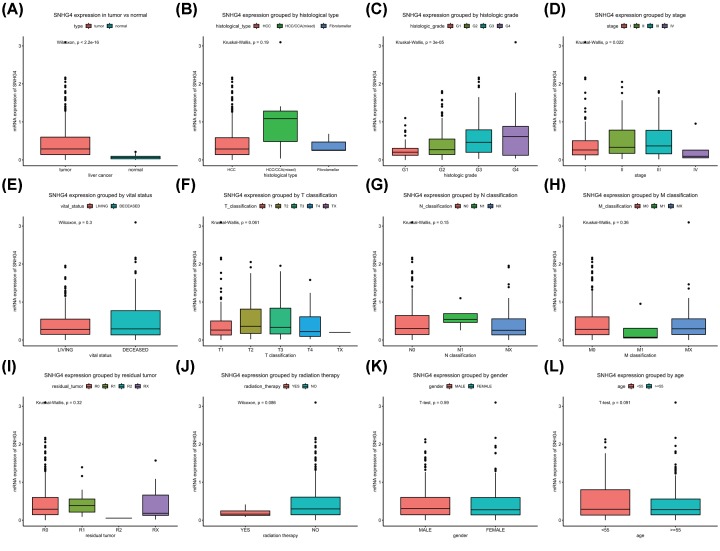
SNHG4 expression was significantly higher in liver cancer tissues (n = 371; P < 0.05) compared with normal liver tissues (n = 50), which was validated by HCCDB database (Supplementary Figure S1). Furthermore, significant differences in SNHG4 expression were found based on histological grade and stage (Figure 1). The patients with liver cancer were divided into high and low SNHG4 expression groups. And their clinicopathological parameters and survival outcomes were described in Table 2. The results proved a correlation between high SNHG4 expression and histological type (P = 0.01), histologic grade (P = 0.001), stage (P = 0.01), T classification (P = 0.004), and survival status (P = 0.013).
Figure 1. SNHG4 expression in liver cancer.
SNHG4 expression in liver cancer versus normal tissue (A) and grouped by histological type (B), histologic grade (C), stage (D), vital status (E), TNM classification (F,G,H), residual tumor (I), radiation therapy (J), gender (K), and age (L).
Table 2. The correlation between SNHG4 expression and clinical parameters.
| Clinical characteristics | Variable | No. of patients | SNHG4 expression | χ2 | P-value | |||
|---|---|---|---|---|---|---|---|---|
| High | % | Low | % | |||||
| Age | <55 | 117 | 31 | (41.33) | 86 | (29.15) | 3.5593 | 0.059 |
| ≥55 | 253 | 44 | (58.67) | 209 | (70.85) | |||
| Gender | FEMALE | 121 | 28 | (37.33) | 93 | (31.42) | 0.7023 | 0.402 |
| MALE | 250 | 47 | (62.67) | 203 | (68.58) | |||
| Histological type | Fibrolamellar | 3 | 0 | (0) | 3 | (1.01) | 12.2954 | 0.010 |
| Hepatocellular | 361 | 70 | (93.33) | 291 | (98.31) | |||
| Hepatocholangiocarcinoma | 7 | 5 | (6.67) | 2 | (0.68) | |||
| Histologic grade | G1 | 55 | 4 | (5.41) | 51 | (17.47) | 16.3367 | 0.001 |
| G2 | 177 | 29 | (39.19) | 148 | (50.68) | |||
| G3 | 122 | 37 | (50) | 85 | (29.11) | |||
| G4 | 12 | 4 | (5.41) | 8 | (2.74) | |||
| Stage | I | 171 | 23 | (32.39) | 148 | (53.62) | 10.4078 | 0.010 |
| II | 86 | 23 | (32.39) | 63 | (22.83) | |||
| III | 85 | 24 | (33.8) | 61 | (22.1) | |||
| IV | 5 | 1 | (1.41) | 4 | (1.45) | |||
| T classification | T1 | 181 | 23 | (30.67) | 158 | (53.74) | 13.4311 | 0.004 |
| T2 | 94 | 26 | (34.67) | 68 | (23.13) | |||
| T3 | 80 | 23 | (30.67) | 57 | (19.39) | |||
| T4 | 13 | 3 | (4) | 10 | (3.4) | |||
| TX | 1 | 0 | (0) | 1 | (0.34) | |||
| N classification | N0 | 252 | 54 | (72) | 198 | (67.12) | 0.7889 | 0.546 |
| N1 | 4 | 1 | (1.33) | 3 | (1.02) | |||
| NX | 114 | 20 | (26.67) | 94 | (31.86) | |||
| M classification | M0 | 266 | 57 | (76) | 209 | (70.61) | 1.0165 | 0.497 |
| M1 | 4 | 1 | (1.33) | 3 | (1.01) | |||
| MX | 101 | 17 | (22.67) | 84 | (28.38) | |||
| Radiation therapy | NO | 338 | 69 | (100) | 269 | (97.11) | 0.9617 | 0.327 |
| YES | 8 | 0 | (0) | 8 | (2.89) | |||
| Residual tumor | R0 | 324 | 66 | (89.19) | 258 | (88.97) | 0.4091 | 0.959 |
| R1 | 17 | 3 | (4.05) | 14 | (4.83) | |||
| R2 | 1 | 0 | (0) | 1 | (0.34) | |||
| RX | 22 | 5 | (6.76) | 17 | (5.86) | |||
| Survival status | DECEASED | 130 | 36 | (48) | 94 | (31.76) | 6.2408 | 0.013 |
| LIVING | 241 | 39 | (52) | 202 | (68.24) | |||
Bold term represents P<0.05.
High SNHG4 expression as an independent prognostic factor for poor overall survival
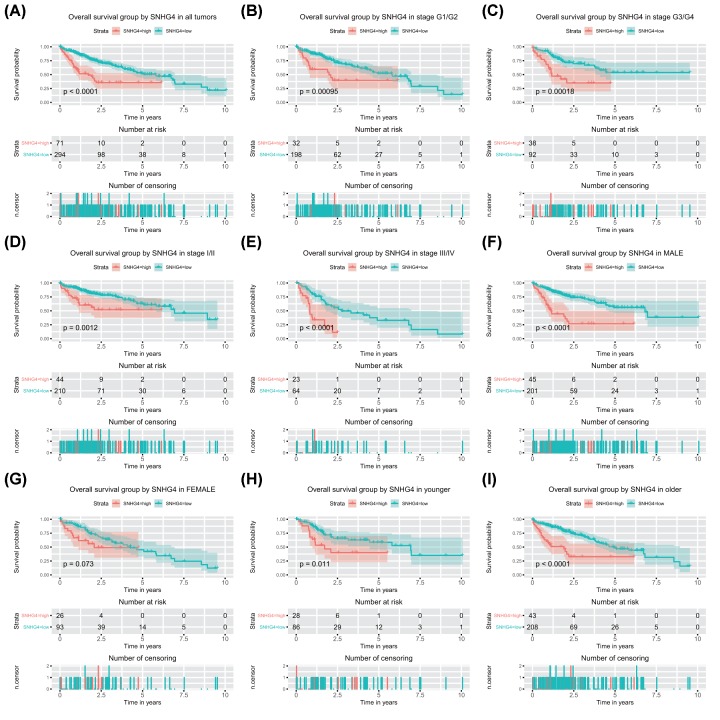
High SNHG4 expression was associated with poor overall survival (P < 0.0001; Figure 2), which was validated by HCCDB database (Supplementary Figure S2). Subsequent subgroup analysis proved that high SNHG4 expression was associated with poor overall survival of patients in all subgroup except for female (P = 0.073; Figure 2). According to univariate analysis, stage, T classification, residual tumor, and SNHG4 expression were associated with poor overall survival (Table 3). Further multivariate analysis determined the independent prognostic value of high SNHG4 expression for poor overall survival of liver cancer (hazard ratio: 2.84, 95% confidence interval: 1.90–4.23, P < 0.001; Table 3).
Figure 2. High SNHG4 expression is correlated with shorter overall survival (OS).
High SNHG4 expression is correlated with shorter OS in patients with liver cancer (A) and the group of G1/G2 (B), G3/G4 (C), stage I/II (D), stage III/IV (E), male (F), female (G), younger (H), and older (I).
Table 3. Univariate and multivariate cox analysis of overall survival.
| Parameters | Univariate analysis | Multivariate analysis | ||||
|---|---|---|---|---|---|---|
| Hazard ratio | 95%CI (lower∼upper) | P-value | Hazard ratio | 95%CI (lower-upper) | P-value | |
| Age | 1.02 | 0.7–1.48 | 0.926 | |||
| Gender | 0.82 | 0.57–1.16 | 0.263 | |||
| Histological type | 0.98 | 0.27–3.63 | 0.982 | |||
| Histologic grade | 1.05 | 0.85–1.31 | 0.651 | |||
| Stage | 1.38 | 1.15–1.65 | 0.001 | 0.86 | 0.68–1.07 | 0.175 |
| T classification | 1.65 | 1.38–1.98 | 0.000 | 1.84 | 1.45–2.34 | 0.000 |
| N classification | 0.71 | 0.5–1.03 | 0.071 | |||
| M classification | 0.70 | 0.48–1.02 | 0.061 | |||
| Radiation therapy | 0.52 | 0.26–1.03 | 0.061 | |||
| Residual tumor | 1.42 | 1.12–1.79 | 0.004 | 1.44 | 1.13–1.85 | 0.003 |
| SNHG4 | 2.83 | 1.91–4.2 | 0.000 | 2.83 | 1.9–4.23 | 0.000 |
High SNHG4 expression as an independent prognostic factor for poor relapse-free survival
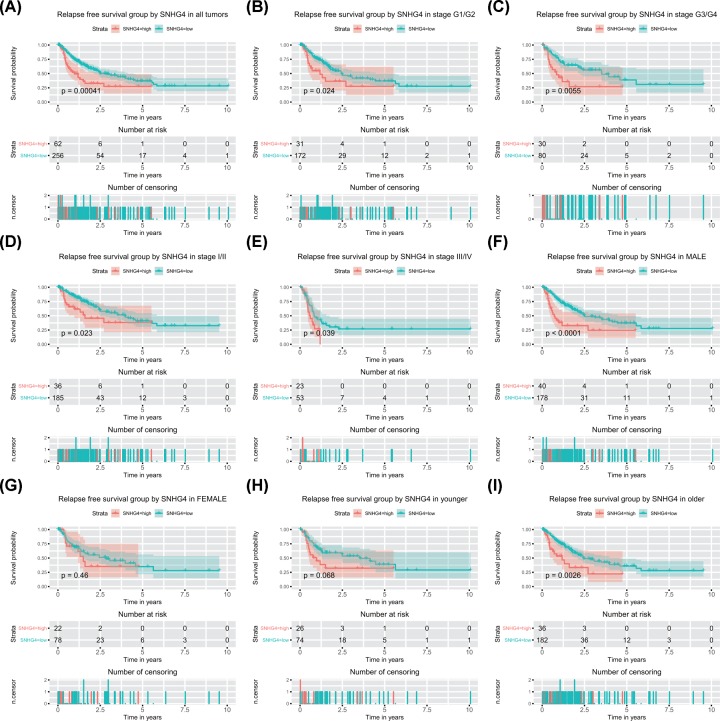
High SNHG4 expression was associated with poor relapse-free survival (P < 0.001; Figure 3). Subsequent subgroup analysis proved that high SNHG4 expression was associated with poor relapse-free survival of patients in all subgroup except for female (P = 0.46; Figure 3) and younger (P = 0.068; Figure 3). According to univariate analysis, stage, T classification, residual tumor, and SNHG4 expression were associated with poor relapse-free survival (Table 4). Further multivariate analysis determined the independent prognostic value of high SNHG4 expression for poor relapse-free survival of liver cancer (hazard ratio: 1.95, 95% confidence interval: 1.29–2.94, P = 0.002; Table 4).
Figure 3. High SNHG4 expression is correlated with shorter relapse-free survival (RFS).
High SNHG4 expression is correlated with shorter RFS in patients with liver cancer(A) and the group of G1/G2 (B), G3/G4 (C), stage I/II (D), stage III/IV (E), male (F), female (G), younger (H), and older (I).
Table 4. Univariable and multivariable cox analysis of relapse-free survival.
| Parameters | Univariate analysis | Multivariate analysis | ||||
|---|---|---|---|---|---|---|
| Hazard ratio | 95%CI (lower∼upper) | P-value | Hazard ratio | 95%CI (lower-upper) | P-value | |
| Age | 0.89 | 0.63–1.27 | 0.521 | |||
| Gender | 0.98 | 0.69–1.4 | 0.919 | |||
| Histological type | 2.03 | 0.66–6.29 | 0.218 | |||
| Histologic grade | 0.98 | 0.8–1.21 | 0.873 | |||
| Stage | 1.66 | 1.38–1.99 | 0.000 | 1.11 | 0.86–1.44 | 0.416 |
| T classification | 1.78 | 1.49–2.12 | 0.000 | 1.65 | 1.26-2.15 | 0.000 |
| N classification | 0.98 | 0.68–1.42 | 0.926 | |||
| M classification | 1.19 | 0.8–1.78 | 0.394 | |||
| Radiation therapy | 0.75 | 0.26–2.17 | 0.592 | |||
| Residual tumor | 1.27 | 1.01–1.61 | 0.042 | 1.37 | 1.08–1.74 | 0.010 |
| SNHG4 | 2.06 | 1.37–3.1 | 0.001 | 1.95 | 1.29–2.96 | 0.002 |
SNHG4-related signaling pathway and ceRNA network
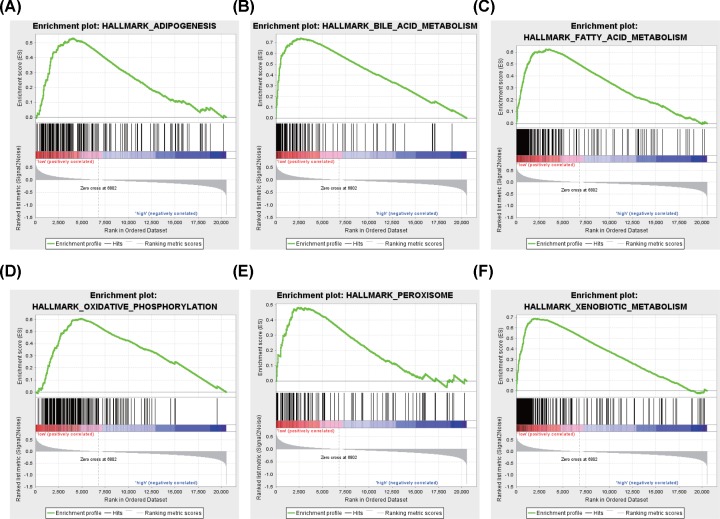
To identify SNHG4-related signaling pathway activated in liver cancer, we conducted the GSEA between low and high SNHG4 expression data sets. Significant differences (FDR < 0.25, NOM P-value < 0.05) in the enrichment of MSigDB Collection (h.all.v6.2.symbols.gmt) and the details are shown in Figure 4 and Table 5. Oxidative phosphorylation, adipogenesis, fatty acid metabolism, bile acid metabolism, xenobiotic metabolism, and peroxisome are differentially enriched in SNHG4 expression-related phenotype.
Figure 4. Enrichment plots from GSEA.
Adipogenesis (A), bile acid metabolism (B), fatty acid metabolism (C), oxidative phosphorylation (D), peroxisome (E), and xenobiotic metabolism (F) are differentially enriched in SNHG4-related liver cancer.
Table 5. Gene sets enriched in expression-related phenotype.
| Gene set | NES | NOM P-val | FDR q-val |
|---|---|---|---|
| HALLMARK_OXIDATIVE_PHOSPHORYLATION | 2.21 | 0.01 | 0.01 |
| HALLMARK_ADIPOGENESIS | 2.19 | 0.00 | 0.00 |
| HALLMARK_FATTY_ACID_METABOLISM | 2.14 | 0.00 | 0.00 |
| HALLMARK_BILE_ACID_METABOLISM | 2.02 | 0.00 | 0.01 |
| HALLMARK_XENOBIOTIC_METABOLISM | 1.97 | 0.00 | 0.01 |
| HALLMARK_PEROXISOME | 1.93 | 0.00 | 0.01 |
NES: normalized enrichment score; NOM: nominal; FDR: false discovery rate. Gene sets with NOM P-val <0.05 and FDR q-val <0.25 are considered as significant.
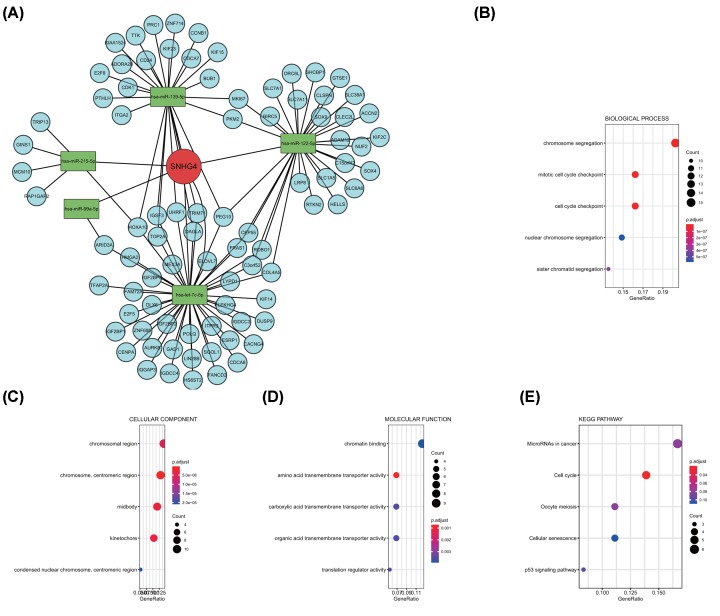
In order to explore the further mechanism of SNHG4, we select 12 down-regulated differentially expression microRNAs (DEMs) and 1142 up-regulated expression encoding genes (DEGs) between low and high SNHG4 expression groups differentially. Next, we merged DEMs, DEGs and predicted miRNA–mRNA targets and conducted the SNHG4-related ceRNA network (Figure 5A). GO and KEGG enrichment analysis revealed the related functions and signaling pathways of mRNAs in the ceRNA network (Figure 5B–E). The correlation between the expression of SNHG4 and mRNAs in the ceRNA network was provided in the Supplementary Information.
Figure 5. SNHG4-related ceRNA network and related signaling pathway.
(A) SNHG4-related ceRNA network was constructed, the red circle represents the lncRNA SNHG4, green rectangles represent the microRNAs, and the blue circle represents the mRNA. GO biological process (B), cellular component (C), molecular function (D), and KEGG (E) enrichment of mRNA in the ceRNA network.
Discussion
Liver cancer is associated with a high mortality rate worldwide. Despite the advance of therapies, the poor prognosis of liver cancer is still inextricability. Therefore, it is important to find reliable biomarkers for diagnosis and prognosis in liver cancer. In recent years, bioinformatics has attracted much attention because of its significance in screening markers. We also have been working on the exploration biomarkers for different types of cancer by bioinformatics [17–31].
In the present study, we found the higher SNHG4 expression in liver cancer, and the relationship between SNHG4 expression and histological type, histologic grade, stage, T classification, and survival status. In the further, we analyzed the effect of SNHG4 on the overall survival and relapse-free survival, and made subgroup analysis to explore it in depth. Besides, we studied the related signaling pathway through GSEA and conducted the SNHG4-related ceRNA network.
Small nuclear RNA host genes (SNHGs), encoded by some lncRNAs, are a class of small RNA molecules and play a role in chemical modifications of other RNAs including rRNAs, tRNAs, and snRNAs. Recently, many studies have found that the aberrant expression of snoRNAs might act as an oncogene in the progression of the tumor. For example, Chen found that SNHG8 overexpressed in non-small cell lung carcinoma (NSCLC) [32], and Dong found that SNHG8 is an oncogene in human hepatocellular carcinoma [33], Meng found SNHG6 promotes glioma tumorigenesis in glioma [34], and Zhu found SNHG4 overexpressed in hepatocellular carcinoma [35]. Consistent with these studies, we found higher SNHG4 expression in liver cancer and it may be a biomarker.
As for the prognostic value of SNHGs, limited studies have deeply explored it. SNHG1, SNHG3, SNHG20 have been separately proved to be a prognostic biomarker in neuroblastoma [36], ovarian cancer [37], and colorectal cancer [38]. Besides, only Zhu made a bioinformatic analysis of lncRNAs and found SNHG4 might be valuable prognostic markers in HCC [35]. In the present study, we also made the same conclusion that SNHG4 expression is an independent predictor of poor prognosis in liver cancer. But we further studied the prognostic value of SNHG4 in the subgroup and found its limitation in female and younger patients, which may contribute to the precision medicine.
Considering for a potential mechanism of SNHG4, related studies were rare. M. Ahmad Chaudhry first found SNHG4 might be involved in the bystander effect, a phenomenon that the irradiated cells communicate with unirradiated cells and induce changes in them [5]. Recently, Rudia Xu found that LncRNA SNHG4 promotes tumor growth by sponging miR-224-3p in osteosarcoma [6]. In the present study, we made the GSEA analysis and found that oxidative phosphorylation, adipogenesis, fatty acid metabolism, bile acid metabolism, xenobiotic metabolism, and peroxisome are differentially enriched in SNHG4 expression-related phenotype. Besides, we conducted the SNHG4-related ceRNA network and provided the clue for the future studies. There are still need to explore the underground mechanism by experiments in this field.
To our knowledge, this is the first study identifying a correlation between the expression level of SNHG4 and the prognosis of patients with liver cancer and exploring related mechanism. The results of our study have shown that the up-regulation of SNHG4 expression is associated with poor survival and has an independent prognostic role in liver cancer. Our study provides a new insight that SNHG4 played a valuable role in the prognosis of liver cancer, which may have an influence on the signaling pathway and laid a foundation for further studies to explore the SNHG4-related ceRNA mechanisms in deep.
Supplementary Material
Acknowledgement
The results shown here are partly based upon data generated by the TCGA Research Network: https://www.cancer.gov/tcga.
Abbreviations
- NSCLC
non-small cell lung carcinoma
- OS
overall survival
- RFS
relapse-free survival
- SNHG4
small nucleolar RNA host gene 4
- TCGA
The Cancer Genome Atlas
Contributor Information
Fang Hua, Email: huafangjdyy@yeah.net.
Yahui Liu, Email: liuyh_2008@yeah.net.
Competing Interests
The authors declare that there are no competing interests associated with the manuscript.
Funding
The authors declare that there are no sources of funding to be acknowledged.
Author Contribution
Yan Jiao and Yanqing Li wrote the manuscript. Yanqing Li, Baoxing Jia, Qingmin Chen, and Guoqiang Pan contributed to data collection and analysis. Yan Jiao and Yahui Liu had a significant role in the study design and manuscript review. Fang Hua revised the manuscript. All authors read and approved the final manuscript.
Ethics Approval
Ethics committee approval was not necessary because all clinical data used in this study were obtained from a public database and are available for research.
References
- 1.Llovet J.M. et al. (2016) Hepatocellular carcinoma. Nat. Rev. Dis. Primers 2, 16018 10.1038/nrdp.2016.18 [DOI] [PubMed] [Google Scholar]
- 2.Cui J. et al. (2018) Potential effect on molecular pathways in different targeted genes in the VEGF family in retina - From the genomic point of view. Exp. Eye Res. 176, 78–87 10.1016/j.exer.2018.06.024 [DOI] [PubMed] [Google Scholar]
- 3.Xiao M. et al. (2018) Prognostic values of long noncoding RNA PVT1 in various carcinomas: An updated systematic review and meta-analysis. Cell Prolif. 51, e12519 10.1111/cpr.12519 [DOI] [PMC free article] [PubMed] [Google Scholar]
- 4.Mei H. et al. (2018) Long noncoding RNA MALAT1 acts as a potential biomarker in cancer diagnosis and detection: a meta-analysis. Biomark. Med. [DOI] [PubMed] [Google Scholar]
- 5.Chaudhry M.A. (2014) Small nucleolar RNA host genes and long non-coding RNA responses in directly irradiated and bystander cells. Cancer Biother. Radiopharm. 29, 135–141 10.1089/cbr.2013.1574 [DOI] [PubMed] [Google Scholar]
- 6.Xu R. et al. (2018) LncRNA SNHG4 promotes tumour growth by sponging miR-224-3p and predicts poor survival and recurrence in human osteosarcoma. Cell Prolif. 51, e12515 10.1111/cpr.12515 [DOI] [PMC free article] [PubMed] [Google Scholar]
- 7.Team, R.D.C.J.C.. (2009) R: A language and environment for statistical computing. Vol. 14, pp. 12–21, R Foundation for Statistical Computing, Vienna, Austria [Google Scholar]
- 8.Wickham H. (2011) Ggplot2:elegant graphics for data analysis. J. Roy. Statist. Soc. Ser. A 174, 245–246 10.1111/j.1467-985X.2010.00676_9.x [DOI] [Google Scholar]
- 9.Robin X.A. et al. (2011) pROC: an open-source package for R and S+ to analyze and compare ROC curves. 12, 77–77 [DOI] [PMC free article] [PubMed] [Google Scholar]
- 10.Therneau T.M. and Grambsch P.M. (2000) Modeling Survival Data: Extending the Cox Model. Vol. 97, pp. 353–354, Springer, New York [Google Scholar]
- 11.Mootha V.K. et al. (2003) PGC-1alpha-responsive genes involved in oxidative phosphorylation are coordinately downregulated in human diabetes. 34, 267–273 [DOI] [PubMed] [Google Scholar]
- 12.Subramanian A. et al. (2005) Gene set enrichment analysis: a knowledge-based approach for interpreting genome-wide expression profiles. Proc. Natl. Acad. Sci. U.S.A. 102, 15545–15550 10.1073/pnas.0506580102 [DOI] [PMC free article] [PubMed] [Google Scholar]
- 13.Ritchie M.E. et al. (2015) limma powers differential expression analyses for RNA-sequencing and microarray studies. Nucleic Acids Res. 43, e47 10.1093/nar/gkv007 [DOI] [PMC free article] [PubMed] [Google Scholar]
- 14.Yang J.H. et al. (2011) starBase: a database for exploring microRNA-mRNA interaction maps from Argonaute CLIP-Seq and Degradome-Seq data. Nucleic Acids Res. 39, D202–D209 10.1093/nar/gkq1056 [DOI] [PMC free article] [PubMed] [Google Scholar]
- 15.Li J.H. et al. (2014) starBase v2.0: decoding miRNA-ceRNA, miRNA-ncRNA and protein-RNA interaction networks from large-scale CLIP-Seq data. Nucleic Acids Res. 42, D92–D97 10.1093/nar/gkt1248 [DOI] [PMC free article] [PubMed] [Google Scholar]
- 16.Yu G. et al. (2012) clusterProfiler: an R package for comparing biological themes among gene clusters. Omics: A J. Integrative Biol. 16, 284–287 10.1089/omi.2011.0118 [DOI] [PMC free article] [PubMed] [Google Scholar]
- 17.Jiao Y. et al. (2018) High EIF2B5 mRNA expression and its prognostic significance in liver cancer: a study based on the TCGA and GEO database. Cancer Manag. Res. 10, 6003–6014 10.2147/CMAR.S185459 [DOI] [PMC free article] [PubMed] [Google Scholar]
- 18.Jiao Y. et al. (2019) Aberrant FAM64A mRNA expression is an independent predictor of poor survival in pancreatic cancer. PLoS One 14, e0211291 10.1371/journal.pone.0211291 [DOI] [PMC free article] [PubMed] [Google Scholar]
- 19.Jiao Y. et al. (2019) PGM5: a novel diagnostic and prognostic biomarker for liver cancer. PeerJ 7, e7070 10.7717/peerj.7070 [DOI] [PMC free article] [PubMed] [Google Scholar]
- 20.Jiao Y. et al. (2019) ITGA3 serves as a diagnostic and prognostic biomarker for pancreatic cancer. Onco. Targets Ther. 12, 4141–4152 10.2147/OTT.S201675 [DOI] [PMC free article] [PubMed] [Google Scholar]
- 21.Jiao Y. et al. (2019) High Trophinin-Associated Protein Expression Is an Independent Predictor of Poor Survival in Liver Cancer. Dig. Dis. Sci. 64, 137–143 10.1007/s10620-018-5315-x [DOI] [PubMed] [Google Scholar]
- 22.Jiao Y. et al. (2019) OGDHL Expression as a Prognostic Biomarker for Liver Cancer Patients. J. Dis. Markers 2019, 9. [DOI] [PMC free article] [PubMed] [Google Scholar]
- 23.Li Y. et al. (2019) High miR-454-3p expression predicts poor prognosis in hepatocellular carcinoma. Cancer Manag. Res. 11, 2795–2802 10.2147/CMAR.S196655 [DOI] [PMC free article] [PubMed] [Google Scholar]
- 24.Li Y. et al. (2019) Expression of La Ribonucleoprotein Domain Family Member 4B (LARP4B) in Liver Cancer and Their Clinical and Prognostic Significance. J. Dis. Markers 2019, 13. [DOI] [PMC free article] [PubMed] [Google Scholar]
- 25.Li Y. et al. (2019) High peroxidasin-like expression is a potential and independent prognostic biomarker in breast cancer. Medicine (Baltimore). 98, e17703 10.1097/MD.0000000000017703 [DOI] [PMC free article] [PubMed] [Google Scholar]
- 26.Hou L. et al. (2019) ATP binding cassette subfamily B member 9 (ABCB9) is a prognostic indicator of overall survival in ovarian cancer. Medicine (Baltimore). 98, e15698 10.1097/MD.0000000000015698 [DOI] [PMC free article] [PubMed] [Google Scholar]
- 27.Zhang X. et al. (2019) Lipocalin-1 Expression as a Prognosticator Marker of Survival in Breast Cancer Patients. Breast Care. 2019, 10.1159/000503168 [DOI] [PMC free article] [PubMed] [Google Scholar]
- 28.Cui Y. et al. (2019) A new prognostic factor of breast cancer: High carboxyl ester lipase expression related to poor survival. Cancer Genet. 239, 54–61 10.1016/j.cancergen.2019.09.005 [DOI] [PubMed] [Google Scholar]
- 29.Cai H. et al. (2019) Low CYP24A1 mRNA expression and its role in prognosis of breast cancer. Sci. Rep. 9, 13714 10.1038/s41598-019-50214-z [DOI] [PMC free article] [PubMed] [Google Scholar]
- 30.Nie Y. et al. (2019) Investigation of the Clinical Significance and Prognostic Value of the lncRNA ACVR2B-As1 in Liver Cancer. J. BioMed. Res. Int. 2019, 13. [DOI] [PMC free article] [PubMed] [Google Scholar]
- 31.Zhou L.L. et al. (2019) Differentially expressed long noncoding RNAs and regulatory mechanism of LINC02407 in human gastric adenocarcinoma. World J. Gastroenterol. 25, 5973–5990 10.3748/wjg.v25.i39.5973 [DOI] [PMC free article] [PubMed] [Google Scholar]
- 32.Chen C. et al. (2018) SNHG8 is identified as a key regulator in non-small-cell lung cancer progression sponging to miR-542-3p by targeting CCND1/CDK6. Onco. Targets Ther. 11, 6081–6090 10.2147/OTT.S170482 [DOI] [PMC free article] [PubMed] [Google Scholar]
- 33.Dong J. et al. (2018) lncRNA SNHG8 Promotes the Tumorigenesis and Metastasis by Sponging miR-149-5p and Predicts Tumor Recurrence in Hepatocellular Carcinoma. Cell. Physiol. Biochem. 51, 2262–2274 10.1159/000495871 [DOI] [PubMed] [Google Scholar]
- 34.Meng Q. et al. (2018) Long non-coding RNA SNHG6 promotes glioma tumorigenesis by sponging miR-101-3p. Int. J. Biol. Markers 33, 148–155 10.1177/1724600817747524 [DOI] [PubMed] [Google Scholar]
- 35.Zhu Q. et al. (2019) Bioinformatic analysis of the prognostic value of the lncRNAs encoding snoRNAs in hepatocellular carcinoma. Biofactors. 45, 244–252 10.1002/biof.1478 [DOI] [PubMed] [Google Scholar]
- 36.Sahu D. et al. (2016) Co-expression analysis identifies long noncoding RNA SNHG1 as a novel predictor for event-free survival in neuroblastoma. Oncotarget 7, 58022–58037 10.18632/oncotarget.11158 [DOI] [PMC free article] [PubMed] [Google Scholar]
- 37.Hong L. et al. (2018) Upregulation of SNHG3 expression associated with poor prognosis and enhances malignant progression of ovarian cancer. Cancer Biomark 22, 367–374 10.3233/CBM-170710 [DOI] [PubMed] [Google Scholar]
- 38.Li C. et al. (2016) Increased long noncoding RNA SNHG20 predicts poor prognosis in colorectal cancer. BMC Cancer 16, 655 10.1186/s12885-016-2719-x [DOI] [PMC free article] [PubMed] [Google Scholar]
Associated Data
This section collects any data citations, data availability statements, or supplementary materials included in this article.


