Abstract
Background
A new regulatory subpopulation of ILCs, ILCreg has been identified in mouse and human intestines. ILCregs share characteristics with both innate lymphoid cells and regulatory cells; however, the significance of CD45+Lin−CD127+IL-10+ ILCregs in patients with AML remains unclear. Intriguingly, ILCregs constitutively express id2, id3, sox4, tgfbr1, tgfbr2, il2rb and il2rg, but the significance of miRNAs associated with these genes has yet to be explored. In this study, we evaluate ILCreg frequency, ILCreg gene-associated miRNA quantification, and its significance in patients with AML and normal donors.
Methods
Using 4 color combinations of surface and intracellular antibody staining, the CD45+Lin−CD127+IL-10+ ILCregs from 12 normal donors and 42 patients newly diagnosed with AML were measured by flow cytometry. Plasma samples and bone marrow cells from 6 normal donors and 9 patients with AML were studied by next-generation sequence miRNAs quantification.
Results
Our results showed that the frequency of ILCregs was 0.8924±1.3791% in bone marrow (BM) cells from normal donors and 0.2434±0.5344% in BM cells from AML patients. The frequency of ILCreg cells in AML patients was significantly lower than that in normal donors (P<0.01). Furthermore, the frequency of the CD45+Lin−CD127+IL-10− subset was 4.0869±6.7701% and 0.2769±0.2526% from normal donors and AML patients, respectively. There was a statistically significant difference of CD45+Lin−CD127+IL-10− cells between normal donors and AML patients (p<0.01). miRNA detection results showed 376 miRNAs from plasma and 182 miRNAs from BM cell samples with expression levels with a statistically significant difference between AML patients and normal donors (both Q and P-value < 0.001). Analysis of miRNAs from ILCregs associated genes including id2, id3, sox4, tgfbr1, tgfbr2, il2rb, and il3rg, from normal donors and AML patients demonstrated 34 miRNA from plasma samples and 14 miRNA segments from BM cell samples with a statistically significant difference between AML patients and normal donors (both Q and P-value <0.001). Among them, 4 miRNAs (hsa-miR-193b-3p, hsa-miR-1270, hsa-miR-210-3p, and hsa-miR-486-3p) were detected in both plasma and BM cell samples.
Conclusion
Our study enumerated ILCregs, then measured miRNAs from those ILCregs in AML samples for the first time. The results demonstrated the deficiency of ILCreg and differential expression of miRNAs in patients with AML.
Keywords: regulatory innate lymphoid cells, ILCregs, flow cytometry, FCM, miRNAs, next generation sequence, acute myeloid leukemia, AML
Introduction
Innate lymphoid cell (ILC) is a kind of innate immune lymphocyte discovered in recent years. Following the traditional classification method of T cells, it has been classified into ILC1, ILC2, and ILC3 subsets: group 1 comprises natural killer (NK) cells and ILC1s, group 2 comprises ILC2, and group 3 comprises ILC3.1 For clarity, the term ILCs will only refer to ILC1, ILC2, and ILC3 not to conventional NK cells. ILCs have been described to have a lymphoid morphology but lack rearranged antigen receptors and can secrete various cytokines.2 Although ILCs express CD127, the cell surface receptors of most hematopoietic lineages (lin) are absent.3 ILC1s are described as CD45+Lin−CD127+CD161+CD117−CRTH2−,4 ILC2s as CD45+Lin−CD127+CD161+CD117±CRTH2+,5 ILC3s as CD45+Lin−CD127+CD161+CD117+CRTH2−,6,7 and NK cells as CD45+Lin−CD161+CD94+CD56+.8 Human ILCs have been identified in various tissues including peripheral blood9 and cord blood.10 Recently, a flow cytometric Optimized Multicolor Immunofluorescence Panel (OMIP) for characterization of human innate lymphoid cells from neonatal and peripheral blood has been suggested.11
In 2017, Wang et al discovered a sub-group of ILC cells with phenotype of Lin-CD45+CD127+IL-10+ by flow cytometry in the intestines of mice and humans and named them regulatory innate lymphoid cells (ILCregs).12,13 While the morphology of these cells has similar characteristics of lymphocytes, they do not express CD4 and FoxP3, and are therefore not Tregs.14 These cells express ILC markers such as CD25 (IL-2Ralpha) and CD90 (Thy1), and over-express IL-2R gamma and SCA-1, but they do not express ILC1 markers (NK1.1, NKp46), ILC2 markers (ST2 and KLRG1), ILC3 markers (NKp46, CD4, and RORγt) and white blood cell markers.15,16 Infusion of ILCregs can prevent congenital colitis, alleviate inflammatory bowel disease, save Rag1 -/-IL10 -/- mice, and amplified in DSS-stimulated models. Flow cytometry assay showed that the highest proportion of the cells in the lamina propria of small intestine was 13.1% and 15.7%, in mice and human, respectively. Immunofluorescence and immunohistochemistry methods were also used to verify the presence of these cells in human and mouse intestines.12,13
Since newly confirmed ILCregs may exist in both mouse and human intestines and bone marrow, the function and mechanism of ILCregs in patients of acute myeloid leukemia are still unclear and no relevant research reports have been reported yet. Therefore, based on the knowledge of ILCregs and AML, we hypothesize that ILCregs may be deficient in the patients of AML. In this study, we explore the expression levels of the CD45+Lin−CD127+IL-10+ ILCregs population and its CD45+Lin−CD127+IL-10− subset population, evaluating the clinical significance between the normal donors and patients with AML by using the 4 color monoclonal antibody combination detected by flow cytometry.
miRNAs are 19–22 nucleotides long non-coding RNAs which regulate the expression of genes by sequence-specific binding to mRNA to either promote or block its translation.17 This is a powerful level of epigenetic control for gene expression that can influence the phenotype of a cell.18 In recent years, regulation of miRNAs is extensively studied for their role in biological processes as well as in the development and progression of various human diseases, miRNAs hold huge potential for diagnostic and prognostic biomarkers as well as predictors of drug response.19 Insights into the roles of miRNAs in development and disease, particularly in cancer have made miRNAs attractive tools and targets for novel therapeutic approaches.20 Some studies have shown miRNAs play a role in blocking differentiation of leukemic cells and promoting their unchecked cell division.21,22
To further explore the importance of miRNA in patients of AML and the relationship of miRNA with the frequency of ILCregs, we used the next-generation sequence (NGS) method to measure the miRNA from both plasma and BM mono-nuclear cell samples. We compared the expression levels of miRNAs from AML patients to normal controls to find a statistically significant increase or decrease in expression levels of approximately 3280 miRNA sequences. Analysis of miRNAs in ILCreg-associated genes yields further information regarding statistically significant changes in expression.
Methods
Patients with Acute Myeloid Leukemia
The bone marrow samples were obtained from 42 patients newly diagnosed with acute myeloid leukemia prior to the induction chemotherapy were obtained following written informed consent from patients and/or their legal guardians at the First Affiliated Hospital of Zhengzhou University from September 2018 to August 2019. Study protocols were approved by Ethics Committee of The First Affiliated Hospital of Zhengzhou University (Zhengzhou, Henan, China) and based on the ethical principles for medical research involving human subjects of the Helsinki Declaration. Diagnosis was done according to the standard diagnosis with MICM criteria based on the 2016 WHO AML Classification23 and the 2017 NCCN Clinical Practice Guidelines.24 All clinical data regarding patients are summarized in Table 1.
Table 1.
Clinical Characteristics of AML Patients
| Total Patients=42 | Mean±SD | Range (%) |
|---|---|---|
| Age (year-old) | 48 | 16-74 |
| Gender Males (n, %) | 20 | 47.62% |
| WBC (x10*9/L) | 30.48±48.82 | 0.32–230.00 |
| Hb (g/L) | 82.01±16.65 | 39.00–123.00 |
| Plate (x10*9/L) | 45.17±42.93 | 5.00–210.00 |
| Blast in BM | 53.10±26.78 | 12.80–96.40 |
| Complex karyotype (%) | 8/42 | 19.1 |
| Fusion Genes (%) | 9/42 | 21.4 |
| Gene mutations (%) | 36/42 | 85.7 |
Control Group
In the control group, 12 bone marrow samples from 6 male and 6 female normal donors with the age of 20–55 years old were obtained following written informed consent from healthy volunteers and tested side by side with some of the AML patients’ samples.
Regulatory Innate Lymphoid Cell Immunophenotyping by Multicolor Flow Cytometry
Freshly obtained samples up to 4 hrs from the collection were processed for flow cytometry assay. Bone marrow samples were collected and cultured in media containing 1:1000 BD GolgiPlug (BD Biosciences, USA) for 4 hr at 37°C. Cells were harvested and stained with surface markers CD45-FITC (BD Biosciences, USA, Cat # 555482), Lineage-APC (BD Biosciences, USA, Cat# 562722), CD127-PE-Cy7 (BD Biosciences, USA, Cat # 560822) for 15 mins. Red blood cells were lysed with lysing buffer (BD Biosciences, USA, Cat # 555899). Cells were then fixed and permeablized by BD Cytofix/Cytoperm buffer set (BD Biosciences, USA, Cat# 555028) after surface marker staining, followed by application of anti-IL-10-PE (BD Biosciences, USA, Cat#554498) antibody (JES5-9D7) staining intracellular IL-10 before analysing through flow cytometry. The readout was done with Beckman Coulter Gallios 4-laser and 10-color model flow cytometer (Beckman Coulter, USA). Data analysis was done by using FlowJo software (BD Biosciences, USA).
Gating Strategy
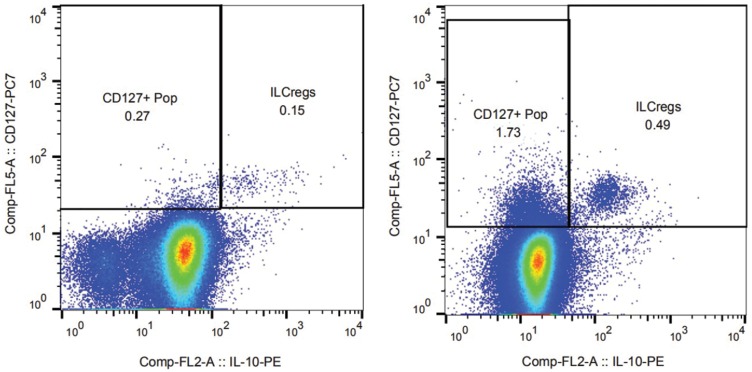
Single-cell populations with SSC vs FSC were selected and were further gated on the CD45+Lin− population. Furthermore, gating of CD127+IL-10+ and CD127+IL-10− sub-population was done by different fluorescence-conjugated antibodies combinations. Regulatory innate lymphoid cells were identified as CD45+Lin−CD127+IL-10+ population. At least a total of 1 million cells were collected for analysis of ILCreg cells. A representative example of ILCreg subpopulation is shown in Figure 1.
Figure 1.
ILCregs from normal donors and AML patients.
Notes: The different expression patterns of ILCregs from normal donors (right panel) and AML patients (left panel) are shown in Figure 1. Single-cell populations with SSC vs FSC were selected and were further gated on the CD45+Lin- population. Furthermore, gating of CD127+IL-10+ and CD127+IL-10- sub-population was done by different fluorescence-conjugated antibodies' combinations. Regulatory innate lymphoid cells were identified as CD45+Lin-CD127+IL-10+ population. At least a total of 1 million cells were collected for analysis of ILCreg cells.
Samples Preparation for RNA Extraction & miRNA Library Construction
Fresh bone marrow samples from 10 AML patients and 6 normal donors were obtained for miRNA testing. Plasma and mono-nuclear cells were collected with Ficoll-Hypaque centrifugation method. Mono-nuclear cells were collected and washed once with PBS. Plasma and mono-nuclear cell samples were put into RNA preparation tubes and stored at −80°C for batch processing. The RNA samples were centrifuged at 12,000×g for 5mins at 4°C. The supernatant was transferred to a new 2.0mL tube which was added 0.3mL of Chloroform/isoamyl alcohol (24:1) per 1.5mL of Trizol reagent. After the mix was centrifuged at 12,000×g for 10mins at 4°C, the aqueous phase was transferred to a new 1.5mL tube which added equal volume of supernatant of isopropyl alcohol. The mix was centrifuged at 12,000×g for 20mins at 4°C and then removed the supernatant. After washed with 1mL 75% ethanol, the RNA pellet was air-dried in the biosafety cabinet and then dissolved by add 25µL~100µL of DEPC-treated water. Subsequently, total RNA was qualified and quantified using a Nano Drop and Agilent 2100 Bioanalyzer (Thermo Fisher Scientific, MA, USA).
Library was prepared with 1μg total RNA for each sample. Total RNA was purified by electrophoretic separation on a 15% urea denaturing polyacrylamide gel electrophoresis (PAGE) gel and small RNA regions corresponding to the 18–30 nt bands in the marker lane (14–30 ssRNA Ladder Marker, TAKARA) were excised and recovered. Then, the 18–30 nt small RNAs were ligated to adenylated 3’ adapters annealed to unique barcodes, followed by the ligation of 5’ adapters. The adapter-ligated small RNAs were subsequently transcribed into cDNA by SuperScript II Reverse Transcriptase (Invitrogen, USA) and then several rounds of PCR amplification with PCR Primer Cocktail and PCR Mix were performed to enrich the cDNA fragments. The PCR products were selected by agarose gel electrophoresis with target fragments 110~130 bp, and then purified by QIAquick Gel Extraction Kit (QIAGEN, Valencia, CA). The yield and quality of the RNA samples was assessed using the Agilent Bioanalyzer prior to library construction using the Illumina TruSeq Small RNA Sample Prep protocol (Illumina; San Diego, California). Multiplexed samples of RNA that exceed quality control metrics (RIN > 6.0) were run on an Illumina NextSeq500 instrument at a targeted depth of 10 million reads per sample. After filtering and trimming of index and adapter sequences, whole-genome alignment of the miR FASTQ reads was performed using the Homo sapiens/hg21 reference genome in the SHRiMPS aligner included in the miRNAs analysis application available in BaseSpace (Illumina), as well as the sRNA Toolbox application suite.
Statistical Analysis
Clinical data, laboratory findings from the patients were collected in the spreadsheet constructed in Microsoft Excel software for Windows 10 (Microsoft). Data were analysed using IBM SPSS Statistics software version 17.0 (IBM, USA). For intra-group comparison, Student’s t-test was used. Significance level was p < 0 05.
The analysis of the RNA-seq data was performed following the pipeline available from the limma packages in the Bioconductor project. Log2counts per million (logCPM) transformation was applied before normalization and linear model fitting. Empirical Bayes moderation was carried out to obtain robust estimates of gene-wise variability and the final p values from the linear model with appropriately designed contrasts were adjusted by the Benjamin–Hochberg procedure for a targeted false discover rate of 0.05. Volcano plots and box plots were used to graphically examine the differences between groups.
Results
Patient Cohort: Clinical Characteristics
A total of 42 newly diagnosed AML patients, including 20 males and 22 females, were included in this study. The clinical manifestations of these patients were summarized (Table 1). The median age at diagnosis was 48 years (range 16–72 years). 12 normal donors including 6 males and 6 females with the age of 20–55 years old were used for controls.
ILCregs Detection by Flow Cytometry
The percentage of individual subpopulations of ILCregs in the bone marrow from patients with acute myeloid leukemia was determined. Using the 4 color monoclonal antibody combination, we measured the ILCregs defined as CD45+Lin−CD127+IL-10+ in the BM from both normal donor and AML patients. The different expression patterns of ILCregs from normal donors (right panel) and AML patients (left panel) are shown in Figure 1.
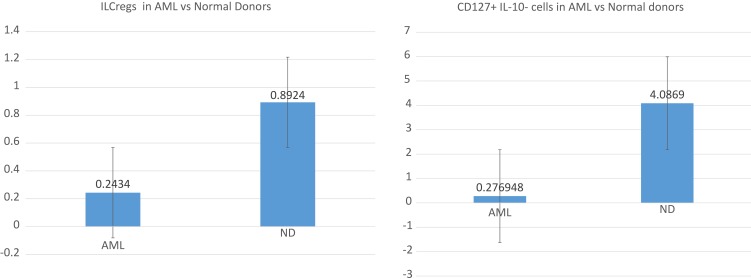
Comparison of ILCreg numbers in the bone marrow between normal donors and patients with acute myeloid leukemia are shown as box plots below (Figure 2). The average frequencies of ILCregs were 0.8924±1.3791% and 0.2434±0.5344% for normal donors and patients with AML, respectively. In comparison with the normal donors, the frequency of ILCregs cells in AML patients was significantly lower (P<0.01). Interestingly, the average frequency of CD45+Lin−CD127+IL-10− subset was 4.0869±6.7701%and 0.2769±0.2526% for normal donors and AML patients, respectively. In comparison with the normal donors, the frequency of CD45+Lin−CD127+IL-10− cells in AML patients was also significantly lower (P<0.01).
Figure 2.
Boxplots showing positive percentages of ILCregs and CD127+IL-10- cells with a statistically significant difference between control and AML patient bone marrow samples.
Notes: In comparison with the normal donors, the frequency of CD45+Lin-CD127+IL-10+ ILCregs and CD45+Lin-CD127+IL-10- cells in AML patients was significantly lower (P<0.01).
miRNAs Sequenced by NGS
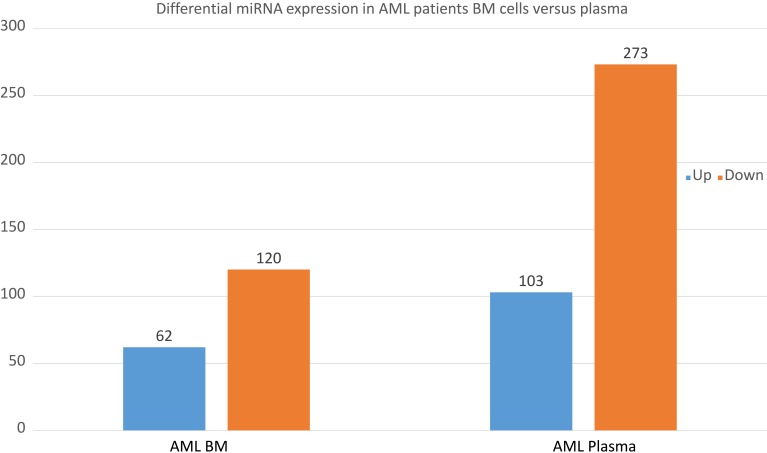
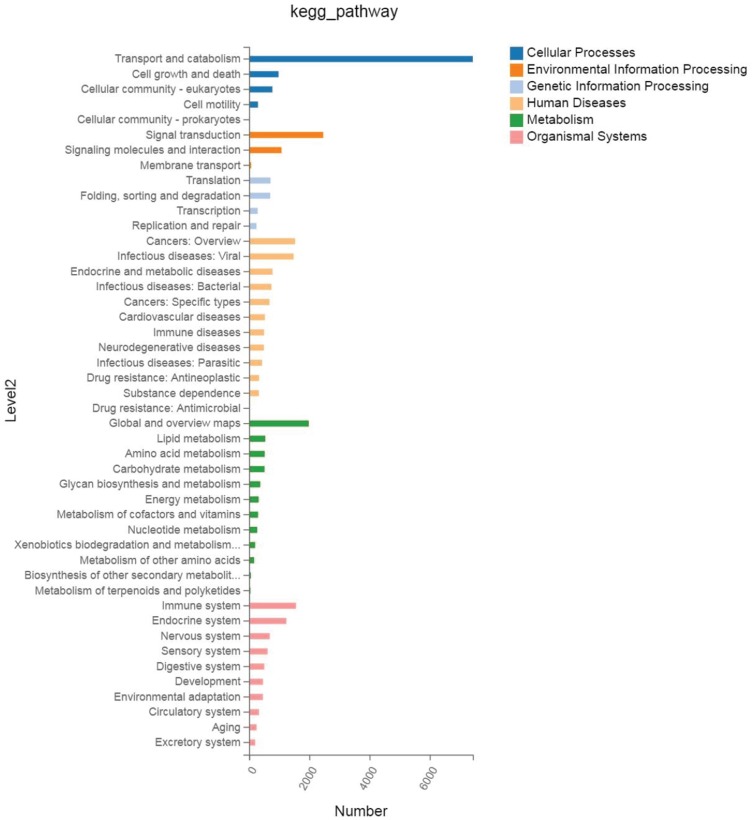
Furthermore, we sequenced miRNAs from both plasma and BM cells samples from 9 patients with newly diagnosed AML and 6 normal donors by using the next-generation sequence method. We obtained sequence for 3280 miRNAs and averaged the amount of each miRNA from 9 AML patients and 6 controls. Levels of miRNA expression were compared with a t-test while the P-values and Q values were calculated for each miRNA. Different miRNA patterns were found from both BM cell samples and plasma samples between the AML patients and normal donors. There were 62 miRNAs up-regulated and 120 miRNAs down-regulated from the AML BM cell samples and 103 miRNAs up-regulated and 273 miRNAs down-regulated from the plasma samples from the box plots shown below (Figure 3). The pathway-related expression patterns were also analyzed and shown below (Figure 4).
Figure 3.
Differential miRNA expression in AML patients BM cells versus plasma.
Notes: Up-regulated and down-regulated genes from the AML BM cell and plasma samples comparing to the normal donors as the box plots shown below (Figure 3 box plots).
Figure 4.
Kegg pathway-related expression patterns were analyzed and shown in AML patients.
In our analysis of plasma samples from 9 AML patients with 6 controls, there were 376 miRNAs with expression levels that showed a statistically significant difference (both Q value and P-value < 0.001). Meanwhile, in the BM cell samples from AML patients and normal controls, there were 182 miRNAs with expression levels that showed a statistically significant difference (both Q value and P-value < 0.001). This was also revealed in a heatmap and cluster analysis of differentially expressed miRNAs of AML patients and normal donors (data not shown). The fold change analysis shows the miRNA differential signature between the AML patients BM cell samples and plasma samples. The color pattern describes the level of expression: red shows miRNAs with down-regulated expression, black shows miRNAs with unchanged expression among the samples, and green shows those miRNAs with up-regulated expression. The size of the branches represents the Euclidian distance of the average expression of the miRNAs.
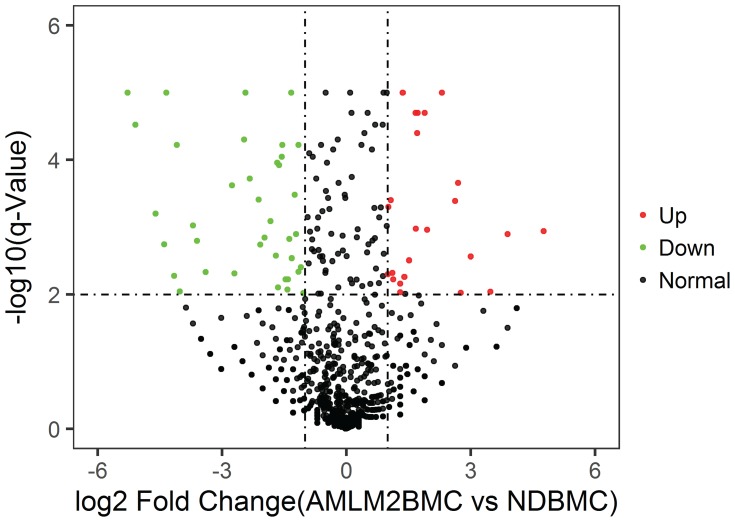
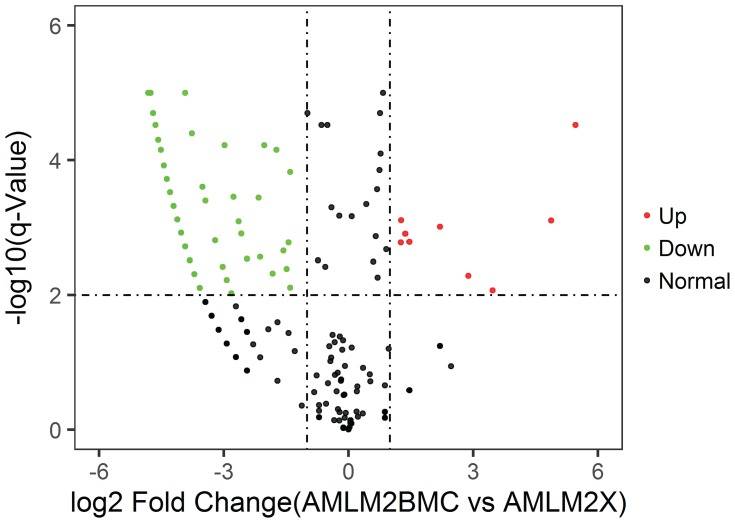
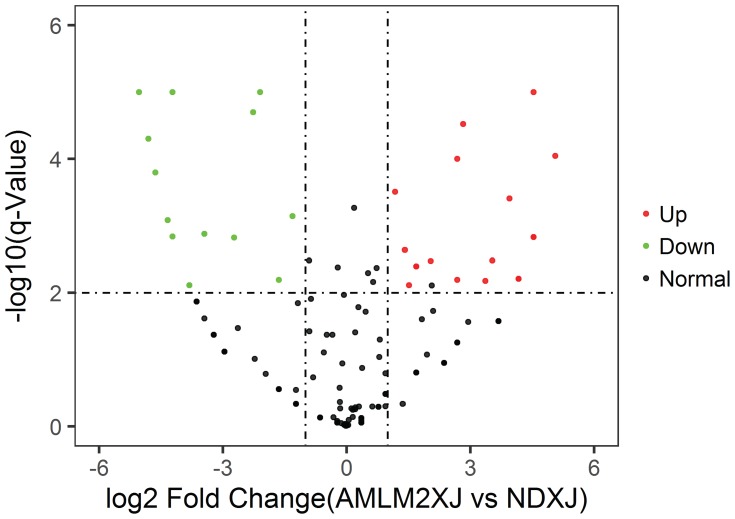
In Figure 5–7, miRNA of BM cell samples from 9 AML patients versus 6 control is shown as below. Log2 Fold Change is shown on the x-axis and –log10 p-value is shown on the y-axis. Points in bold font indicate miRNAs with statistically significant log fold change and adjusted p-value, green color indicated down-regulation and red color indicated up-regulation. Figure 5 shows the volcano plot for the BM cell samples of patients versus controls with 1053 miRNAs having statistically significant change in expression, 56 down-regulated and 24 up-regulated. Similarly, Figure 6 shows the difference of plasma samples from AML patients and normal donors with 135 statistically significant changes in miRNA expression, including 16 down-regulated and 18 up-regulated. Figure 7 shows the volcano plot for the difference of plasma samples and BM cell samples from AML patients with 454 statistically significant changes in miRNA expression, including 162 down-regulated and 9 up-regulated. Clearly, the subset analysis identified a greater number of miRNAs with statistically significant changes in expression in the AML patients.
Figure 5.
Volcano plot: BM cell samples from AML patients vs normal donors.
Notes: BM cell samples from AML patients vs normal donors. Log2 Fold Change is shown on the x-axis and–log10 p-value is shown on the y-axis. Points in bold font indicate miRNAs with statistically significant log fold change and adjusted p-value, green color indicated down-regulation and red color indicated up-regulation.
Figure 7.
Volcano plot: Plasma samples vs BM cell samples from AML patients.
Notes: Difference of plasma samples and BM cell samples from AML patients. Log2 Fold Change is shown on the x-axis and–log10 p-value is shown on the y-axis. Points in bold font indicate miRNAs with statistically significant log fold change and adjusted p-value, green color indicated down-regulation and red color indicated up-regulation.
Figure 6.
Volcano plot: Plasma samples from AML patients vs normal donors.
Notes: Log2 Fold Change is shown on the x-axis and–log10 p-value is shown on the y-axis. Points in bold font indicate miRNAs with statistically significant log fold change and adjusted p-value, green color indicated down-regulation and red color indicated up-regulation.
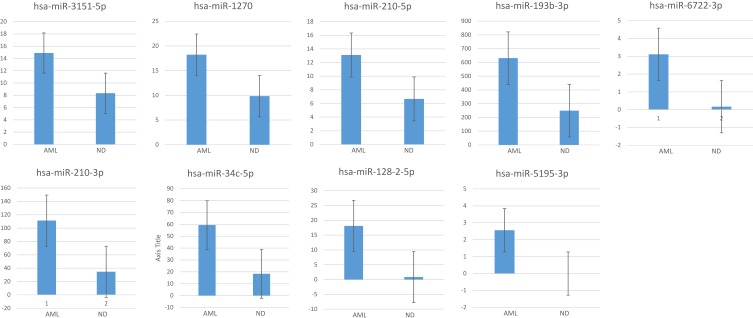
We then performed subset analysis of our data on the miRNAs with the ILCreg associated id2, id3, sox4, tgfbr1, tgfbr2, il2rb and il2rg genes. Results showed 14 miRNAs with a statistically significant difference in expression level (both Q value and P-value < 0.001) from BM cell samples between AML patients and normal donors (Table 2). Meanwhile, there were 34 miRNAs with a statistically significant difference (both Q value and P-value < 0.001). Figure 9 shows greatest increase from BM cell samples when comparing AML patients to controls.
Table 2.
Comparison of BM Cell Sample miRNA Expression Levels Between AML Patients and Normal Donors
| Gene ID | AMLM2_BMC Expression | ND_BMC Expression | AMLM2_BMC Average Read Count | ND_BMC Average Read Count | Log2 (ND_BMC/AMLM2_BMC) | P value(AMLM2_BMC-Vs-ND_BMC) | Q value (AMLM2_BMC-Vs-ND_BMC) |
|---|---|---|---|---|---|---|---|
| hsa-miR-24-3p | 17,801.222 | 38,942.5 | 23,090.778 | 60,768 | 1.11232 | 0 | 0 |
| hsa-miR-370-3p | 8 | 17.167 | 8 | 17.333 | 0.8318 | 1.40E-04 | 5.10E-04 |
| hsa-miR-3074-5p | 5310.222 | 10,925.667 | 5901 | 12,285.5 | 0.77425 | 0 | 0 |
| hsa-miR-342-5p | 1158.111 | 2391 | 1189.667 | 2472.167 | 0.77154 | 0 | 0 |
| hsa-miR-3200-3p | 7.667 | 16 | 8 | 16 | 0.71632 | 0.00133 | 0.00412 |
| hsa-miR-128-1-5p | 1.333 | 2.833 | 1.444 | 2.833 | 0.68831 | 0.19214 | 0.33203 |
| hsa-miR-3154 | 53.778 | 76 | 54 | 76.5 | 0.21882 | 0.01943 | 0.04804 |
| hsa-miR-1275 | 916.111 | 1287.333 | 937.556 | 1318.167 | 0.20788 | 0 | 0 |
| hsa-miR-1271-5p | 233.333 | 311.167 | 236.889 | 317.333 | 0.13811 | 0.00231 | 0.00682 |
| hsa-miR-1307-3p | 1155.111 | 1505.667 | 1195.667 | 1555.333 | 0.09573 | 0 | 1.00E-05 |
| hsa-miR-18a-3p | 251 | 318.333 | 261.556 | 330.167 | 0.0524 | 0.23142 | 0.38122 |
| hsa-miR-212-3p | 50.333 | 61 | 51.333 | 61.833 | −0.01519 | 0.87927 | 0.93717 |
| hsa-miR-339-3p | 487.111 | 583.167 | 499.556 | 593.333 | −0.03548 | 0.27004 | 0.4214 |
| hsa-miR-3187-3p | 77.333 | 89.833 | 78.889 | 91.5 | −0.06973 | 0.39184 | 0.55886 |
| hsa-miR-138-5p | 24.889 | 38.5 | 36.222 | 40 | −0.14055 | 0.24797 | 0.39494 |
| hsa-miR-432-5p | 19.889 | 21.333 | 20 | 21.5 | −0.17934 | 0.27658 | 0.43017 |
| hsa-miR-149-5p | 22.667 | 26.5 | 25.667 | 27.333 | −0.19291 | 0.18593 | 0.32473 |
| hsa-miR-378e | 4.778 | 5 | 5 | 5 | −0.28368 | 0.39806 | 0.56686 |
| hsa-miR-25-5p | 159.556 | 149 | 164.889 | 151.833 | −0.40268 | 0 | 0 |
| hsa-miR-324-3p | 676.333 | 504.833 | 693.778 | 515.333 | −0.71265 | 0 | 0 |
| hsa-miR-324-5p | 549.556 | 356.667 | 561.667 | 361.167 | −0.92073 | 0 | 0 |
| hsa-miR-1270 | 18.222 | 9.833 | 18.667 | 10 | −1.18414 | 0 | 0 |
| hsa-miR-193b-3p | 630.778 | 248.833 | 651.333 | 251.167 | −1.65843 | 0 | 0 |
| hsa-miR-210-3p | 111.222 | 34.667 | 113.111 | 35.5 | −1.95553 | 0 | 0 |
| hsa-miR-34c-5p | 59.333 | 18.333 | 128.889 | 19 | −3.04574 | 0 | 0 |
Figure 9.
Box plots showing greatest increase from AML patient BM cell samples when comparing to controls.
Notes: Box plots showing greatest increase from AML patient BM cell samples when comparing to controls. Y-axis showed average measurement of relative expression level of miRNAs from AML patients and normal donors.
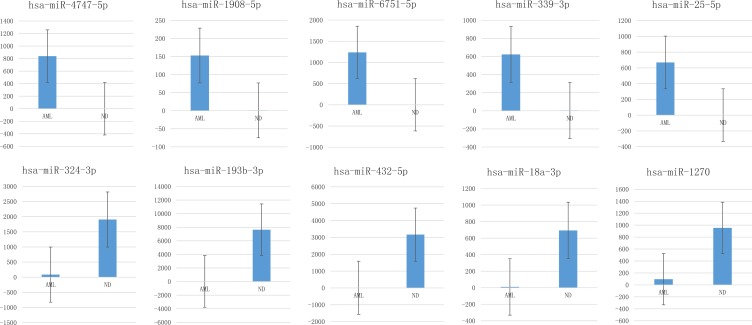
34 miRNA from plasma samples and 14 from BM cell samples that showed a statistically significant difference (both Q value and P-value < 0.001) between AML patients and normal donors are shown in Table 3. The # indicated miRNAs were segments found in both plasma and BM cell samples. miRNAs that have not previously been associated with AML are indicated with asterisks. Figure 8 showed greatest increase and decrease from plasma samples when comparing AML patients to controls.
Table 3.
A Total of 34 miRNA from Plasma Samples and 14 from BM Cell Samples That Showed a Statistically Significant Difference
| Gene ID | Log2 FC(ND_XJ/AMLM2_XJ) | ILCregs Related Genes | Gene ID | Log2 (ND_BMC/AMLM2_BMC) | ILCregs Related Genes |
|---|---|---|---|---|---|
| hsa-miR-1271-5p* | 9.34877 | d2 | hsa-miR-486-3p# | 1.53652 | il2rg |
| hsa-miR-3200-3p | 8.85439 | tgfbr1 | hsa-miR-23a-5p | 1.44084 | il2rg |
| hsa-miR-193b-3p*# | 8.55935 | sox4 | hsa-miR-584-3p | 1.36018 | tgfbr1 |
| hsa-miR-432-5p | 8.36976 | tgfbr2 | hsa-miR-24-3p* | 1.11232 | tgfbr1 |
| hsa-miR-3154* | 6.94874 | id2, sox4 | hsa-miR-3194-3p | 1.07301 | id3 |
| hsa-miR-18a-3p* | 6.14571 | id2 | hsa-miR-3151-5p | −1.11375 | tgfbr2 |
| hsa-miR-1298-5p | 5.75325 | id2 | hsa-miR-1270*# | −1.18414 | sox4 |
| hsa-miR-324-3p | 4.59904 | sox4 | hsa-miR-210-5p* | −1.24805 | sox4 |
| hsa-miR-1270*# | 3.3365 | sox4 | hsa-miR-193b-3p*# | −1.65843 | sox4 |
| hsa-miR-370-3p* | 2.59359 | id2, tgfbr2 | hsa-miR-210-3p*# | −1.95553 | id2 |
| hsa-miR-3074-5p* | 2.1621 | tgfbr2 | hsa-miR-34c-5p* | −3.04574 | tgfbr2 |
| hsa-miR-138-5p* | 2.0674 | id2 | hsa-miR-6722-3p | −4.50607 | tgfbr1 |
| hsa-miR-212-3p*# | 1.79612 | sox4 | hsa-miR-128-2-5p | −4.72552 | sox4 |
| hsa-miR-210-3p* | −1.53215 | id2 | hsa-miR-5195-3p | −5.28368 | tgfbr1 |
| hsa-miR-1275 | −1.6481 | id2, sox4, tgfbr1 | |||
| hsa-miR-3187-3p* | −1.68836 | tgfbr1 | |||
| hsa-miR-491-5p* | −3.06053 | il2rg | |||
| hsa-miR-342-5p* | −3.0985 | tgfbr2 | |||
| hsa-miR-486-3p# | −3.17156 | il2rg | |||
| hsa-miR-378d* | −3.24956 | sox4 | |||
| hsa-miR-101-3p* | −3.45966 | tgfbr1 | |||
| hsa-miR-1268b | −4.92447 | sox4 | |||
| hsa-miR-4722-5p | −4.961 | id3, tgfbr1 | |||
| hsa-miR-1268a | −5.92447 | sox4 | |||
| hsa-miR-3909* | −5.961 | id2 | |||
| hsa-miR-181a-2-3p* | −5.97892 | sox4 | |||
| hsa-miR-339-3p* | −7.23575 | sox4 | |||
| hsa-miR-193b-5p* | −7.41166 | id2 | |||
| hsa-miR-1908-5p | −7.59423 | id2 | |||
| hsa-miR-146b-3p* | −8.42697 | id2 | |||
| hsa-miR-128-1-5p | −9.25745 | sox4 | |||
| hsa-miR-6751-5p | −9.86823 | id3 | |||
| hsa-miR-25-5p | −9.9698 | sox4 | |||
| hsa-miR-4747-5p | −13.08938 | id2 |
Notes: *miRNAs that have not previously been associated with AML are indicated with asterisks. #miRNAs that have been found in both plasma and BM cell samples.
Figure 8.
Box plots showing greatest increase or greatest decrease of miRNAs from plasma samples when comparing AML to controls.
Notes: Box plots showing greatest increase (upper panel) or greatest decrease (lower panel) of miRNAs from AML patient plasma samples when comparing to controls. Y-axis showed average measurement of relative expression level of miRNAs from AML patients and normal donors.
Furthermore, we identified each individual ILCregs-associated genes miRNAs from both plasma and BM cell samples that showed a statistical significance (Table 4). Among these ILCregs associated genes include id2, id3, sox4, tgfbr1, tgfbr2, il2rb and il2rg which all comprise miRNAs that had been found in either plasma or BM cell samples or in both with the exception of the il2rb gene. For id2 gene, only hsa-miR-210-3p miRNA showed a statistically significant difference (both Q value and P-value < 0.001) from BM cell samples between AML patients and normal donors. Consequently, we identified 13 miRNAs related to id2 gene that showed a statistically significant difference (both Q value and P-value < 0.001) from plasma samples between AML patients and normal donors.
Table 4.
ILCregs Associated Genes Related miRNA Expression Patterns from Plasma and BM Cell Samples
| Genes | Samples | Gene Associated miRNAs |
|---|---|---|
| SOX | BM cell samples | hsa-miR-193b-3p; hsa-miR-128-2-5p; hsa-miR-1270; hsa-miR-210-5p |
| Plasma samples | hsa-miR-324-3p; hsa-miR-1268b; hsa-miR-128-1-5p; hsa-miR-193b-3p; hsa-miR-181a-2-3p; hsa-miR-1275; hsa-miR-3154; hsa-miR-1268a; hsa-miR-1270; hsa-miR-339-3p; hsa-miR-378d; hsa-miR-25-5p; hsa-miR-212-3p | |
| ID2 | BM cell samples | hsa-miR-210-3p |
| Plasma samples | hsa-miR-193b-5p; hsa-miR-3909; hsa-miR-138-5p; hsa-miR-4747-5p; hsa-miR-1275; hsa-miR-1298-5p; hsa-miR-1908-5p; hsa-miR-3154; hsa-miR-18a-3p; hsa-miR-1271-5p; hsa-miR-370-3p; hsa-miR-146b-3p; hsa-miR-210-3p | |
| ID3 | BM cell samples | hsa-miR-3194-3p |
| Plasma samples | hsa-miR-6751-5p; hsa-miR-4722-5p | |
| IL2RG | BM cell samples | hsa-miR-23a-5p; hsa-miR-486-3p |
| Plasma samples | hsa-miR-491-5p; hsa-miR-486-3p | |
| TGFBR1 | BM cell samples | hsa-miR-24-3p; hsa-miR-5195-3p; hsa-miR-584-3p; hsa-miR-6722-3p |
| Plasma samples | hsa-miR-101-3p; hsa-miR-1275; hsa-miR-3200-3p; hsa-miR-3187-3p; hsa-miR-4722-5p | |
| TGFBR2 | BM cell samples | hsa-miR-3151-5p; hsa-miR-34c-5p |
| Plasma samples | hsa-miR-432-5p; hsa-miR-342-5p; hsa-miR-370-3p; hsa-miR-3074-5p |
For id3 gene-related miRNAs, only hsa-miR-3194-3p miRNA that showed a statistically significant difference (both Q value and P-value < 0.001) from BM cell samples between AML patients and normal donors. Meanwhile, only hsa-miR-6751-5p and hsa-miR-4722-5p showed a statistically significant difference (both Q value and P-value < 0.001) from plasma samples between AML patients and normal donors.
For il2rg gene-related miRNAs, only hsa-miR-23a-5p and hsa-miR-486-3p miRNAs showed a statistically significant difference (both Q value and P-value < 0.001) from BM cell samples between AML patients and normal donors. Meanwhile, only hsa-miR-491-5p and hsa-miR-486-3p that showed a statistically significant difference (both Q value and P-value < 0.001) from plasma samples between AML patients and normal donors.
For sox4 gene-related miRNAs, four miRNAs hsa-miR-193b-3p, hsa-miR-128-2-5p, hsa-miR-1270, hsa-miR-210-5p miRNAs showed a statistically significant difference (both Q value and P-value < 0.001) from BM cell samples between AML patients and normal donors. Meanwhile, there were 13 miRNAs that showed a statistically significant difference (both Q value and P-value < 0.001) from plasma samples between AML patients and normal donors.
For tgfrb1 gene related miRNAs, four miRNAs hsa-miR-24-3p, hsa-miR-5195-3p, hsa-miR-584-3p, hsa-miR-6722-3p miRNAs showed a statistically significant difference (both Q value and P-value < 0.001) from BM cell samples between AML patients and normal donors. Meanwhile, five hsa-miR-101-3p, hsa-miR-1275, hsa-miR-3200-3p, hsa-miR-3187-3p, hsa-miR-4722-5p miRNAs that showed a statistically significant difference (both Q value and P-value < 0.001) from plasma samples between AML patients and normal donors.
For tgfrb2 gene-related miRNAs, hsa-miR-3151-5p and hsa-miR-34c-5p miRNAs showed a statistically significant difference (both Q value and P-value < 0.001) from BM cell samples between AML patients and normal donors. Meanwhile, hsa-miR-432-5p, hsa-miR-342-5p, hsa-miR-370-3p, hsa-miR-3074-5p miRNAs that showed a statistically significant difference (both Q value and P-value < 0.001) from plasma samples between AML patients and normal donors. No IL2rb-related miRNAs were found in our test.
Discussion
Acute myeloid leukemia (AML) is a clonal neoplastic disease with the proliferation of leukemic myeloid hematopoietic precursor cells and impaired production of normal hematopoiesis.25–27 Research results have confirmed that AML patients have immune system impairment. Regulatory T cells are the most important part of the immune system, which have numerically and functionally deficiencies in AML patients.28–31 These defects are reported to suppress the proliferation and function of T helper cells.32–34 ILC is a kind of innate immune lymphocyte discovered in recent years.35 ILCregs cells, one of its subpopulation, had been discovered in both human and mouse intestines.12,13 The newly discovered ILCregs share the characteristics of innate immune cells and Tregs while playing an important role in the pathogenesis of intestinal inflammatory diseases and other related immune regulation. The function and mechanism of ILCregs in AML are still unclear. Studies have shown that ILCreg cell populations continuously express Tgfbr1, Tgfbr2, Il2rb, and Il2rg, suggesting that ILCregs could respond to TGF-beta and IL-2 signals. IL-10 and TGF-beta 1 are also highly expressed in human ILCregs. 12,13 Although ILCregs had been studied in the intestines of mice and humans, the frequency and expression patterns in patients with AML had not been explored yet. By using the combination of surface markers of CD45, Lin, CD127, and IL-10 for intracellular staining followed by flow cytometry analysis, we were able to detect ILCregs in BM from both normal donors and patients with AML. The frequency of the CD45+Lin−CD127+IL-10+ ILCregs subset populations was significantly decreased in the patients with AML comparing to normal donors. Our results have shown for the first time the enumeration and deficiency of ILCregs in patients with AML.
CD127 had been used by many researchers as the major specific surface marker to distinguish Tregs from normal T cells. Research results have shown that CD25+CD127hi T cells play a role in maintaining non-inflammatory environment by deviating immune responses away from pro-inflammatory Th1 response and encourage an anti-inflammatory Th2-type response.28 A variety of studies have also shown the deficiencies of the regulatory T cells in AML patients.32,34,36,37 CD45+Lin−CD127+IL-10− cell population had not been explored in patients with AML and its function remains unknown. Our results show that in comparison with the normal donors, the frequency of CD45+Lin−CD127+IL-10− cells in AML patients was significantly decreased for BM cells population (P<0.01).
ILCreg cell populations have continuously expressed Tgfbr1, Tgfbr2, Il2rb, and Il2rg,12,13 but the miRNAs related to these genes have not yet been explored. We chose to sequence all miRNAs that were obtained in both plasma and BM cell samples from patients with newly diagnosed AML and controls. We quantified expression of 3280 miRNAs from each patient and control and performed statistical analyses to determine which miRNAs were increased or decreased in AML patients. Interestingly, our results demonstrate that several ILCreg miRNAs have been found from both plasma and BM cell samples with either up-regulated or down-regulated variants. This suggested that these miRNAs may play an important role in the development and function of ILCregs. Future studies in ILCreg regulation may give additional information about the role of ILCregs in the pathogenesis of AML.
Some of the studies have demonstrated that certain miRNAs play an important role in certain malignant diseases such as AML with NPM1+/FLT3+ mutations.38 One of the miRNAs associated with NPM1+/FLT3+ AML, miR-10a-5p showed the most statistically significant adjusted p-value in the yield as well as the highest fold change. This miRNA had been described in patients with NPM1 mutations. It’s noted that high expression levels are associated with good response to induction chemotherapy.39 More recent studies demonstrate a role for miR-10a/b in regulating the proliferation and differentiation of HL-60 leukemic cells in vitro.40 Other literature demonstrate that high expression of miR-338 is associated with poor prognosis in acute myeloid leukemia undergoing chemotherapy.41 However, our results show that certain ILCreg genes targeted miRNAs had been found in both plasma and BM cells samples either up-regulated or down-regulated. These miRNAs may play an important role in the ILCregs’s immuno-modulation.
MiR-181 family has been shown by others to be consistently increased in AML patients.42–44 There are numerous possible target mRNAs for the miR-181 family leading to its interest as a therapeutic target. However, our results did not show the significant difference between AML patients and normal donors from both plasma and BM cell samples. In addition, there are no reported associations between miRNA-181 family and ILCreg associated genes. Another report has shown that miR-199b is consistently decreased in AML,45 but our results did not show the expression difference between AML patients and normal donors. There was another report of increased expression of miR-223-3p in AML patients;46 however, our results did not show significant difference between AML patients and normal donors from both plasma and BM cell samples.
Subset analysis of our data on the miRNAs with the ILCregs associated id2, id3, sox4, tgfbr1, tgfbr2, il2rb and il2rg genes showed that there were 34 miRNA from plasma samples and 14 miRNAs from BM cells samples with expression levels that showed a statistically significant difference between AML patients and normal donors. The first identification of each individual ILCreg miRNA segments with a significant difference from AML patients will be helpful for further research on the ILCregs in AML molecular pathogenesis. However, our data are only a beginning to further studies for large sampling and observation in similar AML patients but at different time points, such as at diagnosis, after complete remission, etc.
Conclusion
Our study enumerates ILCregs, then measures miRNAs from those ILCregs in AML samples. The ILCregs and miRNA deficiencies are detected in patients with AML. Our results demonstrate the deficiency of ILCreg and differential expression of miRNAs in patients with AML.
Ethics Approval and Consent to Participate
Informed consent was obtained from all patients and the protocol was approved by the Ethics Committee of the First Affiliated Hospital of Zhengzhou University.
Consent for Publication
All authors contributed to data analysis, drafting or revising the article, gave final approval of the version to be published, and agree to be accountable for all aspects of the work.
Data Sharing Statement
Data and material will be available upon corresponding author approval. All data sets analyzed for this study are included in the manuscript and the additional files.
Author Contributions
All authors made substantial contributions to conception and design, acquisition of data, or analysis and interpretation of data; took part in drafting the article or revising it critically for important intellectual content; gave final approval of the version to be published; and agree to be accountable for all aspects of the work.
Funding
This study was funded by the Key Scientific Research Project of Henan Provincial Education Department (20A320062 and 19A320046); National Natural Science Foundation of China (U1804192); and Special Talents Project Fund of the First Affiliated Hospital of Zhengzhou University, Zhengzhou, China. The funding bodies did not participate in study design, in data collection, analysis, and interpretation, and in writing the manuscript.
Disclosure
The authors report no conflicts of interest in this work.
References
- 1.Spits H, Artis D, Colonna M, et al. Innate lymphoid cells -a proposal for uniform nomenclature. Nat Rev Immunol. 2013;13(2):145–149. doi: 10.1038/nri3365 [DOI] [PubMed] [Google Scholar]
- 2.Spits H, Cupedo T. Innate lymphoid cells: emerging insights in development, lineage relationships, and function. Annu Rev Immunol. 2012;30(1):647–675. doi: 10.1146/annurev-immunol-020711-075053 [DOI] [PubMed] [Google Scholar]
- 3.Walker JA, Barlow JL, McKenzie ANJ. Innate lymphoid cells -how did we miss them? Nat Rev Immunol. 2013;13(2):75–87. doi: 10.1038/nri3349 [DOI] [PubMed] [Google Scholar]
- 4.Bernink JH, Peters CP, Munneke M, et al. Human type 1 innate lymphoid cells accumulate in inflamed mucosal tissues. Nat Immunol. 2013;14(3):221–229. doi: 10.1038/ni.2534 [DOI] [PubMed] [Google Scholar]
- 5.Mjösberg JM, Trifari S, Crellin NK, et al. Human IL-25- and IL-33-responsive type 2 innate lymphoid cells are defined by expression of CRTH2 and CD161. Nat Immunol. 2011;12:1055–1062. doi: 10.1038/ni.2104 [DOI] [PubMed] [Google Scholar]
- 6.Hoorweg K, Peters CP, Cornelissen F, et al. Functional differences between human NKp44(−) and NKp44(+) RORC(+) innate lymphoid cells. Front Immunol. 2012;3:72. doi: 10.3389/fimmu.2012.00072 [DOI] [PMC free article] [PubMed] [Google Scholar]
- 7.Tang Q, Ahn Y-O, Southern P, Blazar BR, Miller JS, Verneris MR. Development of IL-22–producing NK lineage cells from umbilical cord blood hematopoietic stem cells in the absence of secondary lymphoid tissue. Blood. 2011;117(15):4052–4055. doi: 10.1182/blood-2010-09-303081 [DOI] [PMC free article] [PubMed] [Google Scholar]
- 8.Borrego F, Masilamani M, Kabat J, Sanni TB, Coligan JE. The cell biology of the human natural killer cell CD94/NKG2A inhibitory receptor. Mol Immunol. 2005;42(4):485–488. doi: 10.1016/j.molimm.2004.07.031 [DOI] [PubMed] [Google Scholar]
- 9.Montaldo E, Vacca P, Vitale C, et al. Human innate lymphoid cells. Immunol Lett. 2016;179(Supplement C):2–8. doi: 10.1016/j.imlet.2016.01.007 [DOI] [PubMed] [Google Scholar]
- 10.Lim AI, Li Y, Lopez-Lastra S, et al. Systemic human ILC precursors provide a substrate for tissue ILC differentiation. Cell. 2017;168(6):1086–100.e10. doi: 10.1016/j.cell.2017.02.021 [DOI] [PubMed] [Google Scholar]
- 11.Bianca Bennstein S, Riccarda Manser A, Weinhold S, Scherenschlich N, Uhrberg M. OMIP-055: characterization of human innate lymphoid cells from neonatal and peripheral blood. Cytometry A. 2019. doi: 10.1002/cyto.a.23741 [DOI] [PubMed] [Google Scholar]
- 12.Wang S, Xia P, Chen Y, et al. Regulatory innate lymphoid cells control innate intestinal inflammation. Cell. 2017;171(1):201–216. doi: 10.1016/j.cell.2017.07.027 [DOI] [PubMed] [Google Scholar]
- 13.Zeng B, Shi S, Liu J, Xing F. Commentary: regulatory innate lymphoid cells control innate intestinal inflammation. Front Immunol 2018;9:1522. doi: 10.3389/fimmu.2018.01522 [DOI] [PMC free article] [PubMed] [Google Scholar]
- 14.Sakaguchi S, Yamaguchi T, Nomura T, Ono M. Regulatory T cells and immune tolerance. Cell. 2008;133(5):775–787. doi: 10.1016/j.cell.2008.05.009 [DOI] [PubMed] [Google Scholar]
- 15.Gury-BenAri M, Thaiss CA, Serafini N, et al. The spectrum and regulatory landscape of intestinal innate lymphoid cells are shaped by the microbiome. Cell. 2016;166(5):1231–1246.e13. doi: 10.1016/j.cell.2016.07.043. [DOI] [PubMed] [Google Scholar]
- 16.Robinette ML, Fuchs A, Cortez VS, et al. Transcriptional programs define molecular characteristics of innate lymphoid cell classes and subsets. Nat Immunol. 2015;16(3):306–317. doi: 10.1038/ni.3094. [DOI] [PMC free article] [PubMed] [Google Scholar]
- 17.Bartel DP. MicroRNAs: genomics, biogenesis, mechanism, and function. Cell. 2004;116(2):281–297. doi: 10.1016/S0092-8674(04)00045-5 [DOI] [PubMed] [Google Scholar]
- 18.Baltimore D, Boldin MP, O’connell RM, Rao DS, Taganov KD. MicroRNAs: new regulators of immune cell development and function. Nat Immunol. 2008;9(8):839–845. doi: 10.1038/ni.f.209 [DOI] [PubMed] [Google Scholar]
- 19.Vishnoi A, Rani S. MiRNA biogenesis and regulation of diseases: an overview. Methods Mol Biol. 2017;1509:1–10. [DOI] [PubMed] [Google Scholar]
- 20.Rupaimoole R, Slack FJ. MicroRNA therapeutics: towards a new era for the management of cancer and other diseases. Nat Rev Drug Discov. 2017;16(3):203–222. doi: 10.1038/nrd.2016.246. [DOI] [PubMed] [Google Scholar]
- 21.Wallace JA, O’Connell RM. MicroRNAs and acute myeloid leukemia: therapeutic implications and emerging concepts. Blood. 2017;130(11):1290–1301. doi: 10.1182/blood-2016-10-697698 [DOI] [PMC free article] [PubMed] [Google Scholar]
- 22.Trino S, Lamorte D, Caivano A, et al. MicroRNAs as new biomarkers for diagnosis and prognosis, and as potential therapeutic targets in acute myeloid leukemia. Int J Mol Sci. 2018;19(2):460. doi: 10.3390/ijms19020460 [DOI] [PMC free article] [PubMed] [Google Scholar]
- 23.Arber DA, Orazi A, Hasserjian R, et al. The 2016 revision to the World Health Organization classification of myeloid neoplasms and acute leukemia. Blood. 2016;127(20):2391–2405. doi: 10.1182/blood-2016-03-643544. [DOI] [PubMed] [Google Scholar]
- 24.O’Donnell MR, Tallman MS, Abboud CN, et al. Acute myeloid leukemia, version 3.2017, NCCN clinical practice guidelines in oncology. J Natl Compr Canc Netw. 2017;15(7):926–957. doi: 10.6004/jnccn.2017.0116 [DOI] [PubMed] [Google Scholar]
- 25.Steensma DP, Bejar R, Jaiswal S, et al. Clonal hematopoiesis of indeterminate potential and its distinction from myelodysplastic syndromes. Blood. 2015;126(1):9–16. doi: 10.1182/blood-2015-03-631747 [DOI] [PMC free article] [PubMed] [Google Scholar]
- 26.Bowman RL, Busque L, Levine RL. Clonal hematopoiesis and evolution to hematopoietic malignancies. Cell Stem Cell. 2018;22(2):157–170. doi: 10.1016/j.stem.2018.01.011 [DOI] [PMC free article] [PubMed] [Google Scholar]
- 27.Young AL, Challen GA, Birmann BM, Druley TE. Clonal haematopoiesis harbouring AML-associated mutations is ubiquitous in healthy adults. Nat Commun. 2016;7:12484. doi: 10.1038/ncomms12484 [DOI] [PMC free article] [PubMed] [Google Scholar]
- 28.Wang M, Zhang C, Tian T, et al. Increased regulatory T cells in peripheral blood of acute myeloid leukemia patients rely on tumor necrosis factor (TNF)-α-TNF receptor-2 pathway. Front Immunol. 2018;9:1274. doi: 10.3389/fimmu.2018.01274. [DOI] [PMC free article] [PubMed] [Google Scholar]
- 29.Sander FE, Nilsson M, Rydström A, et al. Role of regulatory T cells in acute myeloid leukemia patients undergoing relapse-preventive immunotherapy. Cancer Immunol Immunother. 2017;66(11):1473–1484. doi: 10.1007/s00262-017-2040-9. [DOI] [PMC free article] [PubMed] [Google Scholar]
- 30.Yang W, Xu Y. Clinical significance of treg cell frequency in acute myeloid leukemia. Int J Hematol. 2013;98(5):558–562. doi: 10.1007/s12185-013-1436-3. [DOI] [PubMed] [Google Scholar]
- 31.Han Y, Dong Y, Yang Q, et al. Acute myeloid leukemia cells express ICOS ligand to promote the expansion of regulatory T cells. Front Immunol. 2018;9:2227. doi: 10.3389/fimmu.2018.02227. [DOI] [PMC free article] [PubMed] [Google Scholar]
- 32.Williams P, Basu S, Garcia-Manero G, et al. The distribution of T-cell subsets and the expression of immune checkpoint receptors and ligands in patients with newly diagnosed and relapsed acute myeloid leukemia. Cancer. 2018;125(9):1470–1481.”. doi: 10.1002/cncr.31896 [DOI] [PMC free article] [PubMed] [Google Scholar]
- 33.Knaus HA, Berglund S, Hackl H, et al. Signatures of CD8þ T cell dysfunction in AML patients and their reversibility with response to chemotherapy. JCI Insight. 2018;3:pii: 120974. doi: 10.1172/jci.insight.120974 [DOI] [PMC free article] [PubMed] [Google Scholar]
- 34.Ustun C, Miller JS, Munn DH, Weisdorf DJ, Blazar BR. Regulatory T cells in acute myelogenous leukemia: is it time for immunomodulation? Blood. 2011;118(19):5084–5095. doi: 10.1182/blood-2011-07-365817 [DOI] [PMC free article] [PubMed] [Google Scholar]
- 35.Bjorklund AK, Forkel M, Picelli S, et al. The heterogeneity of human CD127+ innate lymphoid cells revealed by single-cell RNA sequencing. Nat Immunol. 2016;17(4):451–460. doi: 10.1038/ni.3368 [DOI] [PubMed] [Google Scholar]
- 36.Szczepanski MJ, Szajnik M, Czystowska M, et al. Increased frequency and suppression by regulatory T cells in patients with acute myelogenous leukemia. Clin Cancer Res. 2009;15(10):3325–3332. doi: 10.1158/1078-0432.CCR-08-3010 [DOI] [PMC free article] [PubMed] [Google Scholar]
- 37.Shenghui Z, Yixiang H, Jianbo W, et al. Elevated frequencies of CD4(+) CD25(+) CD127lo regulatory T cells is associated to poor prognosis in patients with acute myeloid leukemia. Int J Cancer. 2011;129(6):1373–1381. doi: 10.1002/ijc.25791 [DOI] [PubMed] [Google Scholar]
- 38.Pandita A, Ramadas P, Poudel A, et al. Differential expression of miRNAs in acute myeloid leukemia quantified by Nextgen sequencing of whole blood samples. PLoS One. 2019;14(3):e0213078. doi: 10.1371/journal.pone.0213078 [DOI] [PMC free article] [PubMed] [Google Scholar]
- 39.Havelange V, Ranganathan P, Geyer S, et al. Implications of the miR-10 family in chemotherapy response of NPM1-mutated AML. Blood. 2014;123(15):2412–2415. doi: 10.1182/blood-2013-10-532374. [DOI] [PMC free article] [PubMed] [Google Scholar]
- 40.Bi L, Sun L, Jin Z, Zhang S, Shen Z. MicroRNA-10a/b are regulators of myeloid differentiation and acute myeloid leukemia. Oncol Lett. 2018;15(4):5611–5619. doi: 10.3892/ol.2018.8050. [DOI] [PMC free article] [PubMed] [Google Scholar]
- 41.Fu L, Qi J, Gao X, et al. High expression of miR-338 is associated with poor prognosis in acute myeloid leukemia undergoing chemotherapy. J Cell Physiol. 2019:1–9. doi: 10.1002/jcp.28676 [DOI] [PubMed] [Google Scholar]
- 42.Marcucci G, Mrozek K, Radmacher MD, Garzon R, Bloomfield CD. The prognostic and functional role of microRNAs in acute myeloid leukemia. Blood. 2011;117(4):1121–1129. doi: 10.1182/blood-2010-09-191312. [DOI] [PMC free article] [PubMed] [Google Scholar]
- 43.Weng H, Lal K, Yang FF, Chen J. The pathological role and prognostic impact of miR-181 in acute myeloid leukemia. Cancer Genetics. 2015;208(5):225–229. doi: 10.1016/j.cancergen.2014.12.006. [DOI] [PMC free article] [PubMed] [Google Scholar]
- 44.Su R, Lin H, Zhang X, et al. MiR-181 family: regulators of myeloid differentiation and acute myeloid leukemia as well as potential therapeutic targets. Oncogene. 2015;34(25):3226–3239. doi: 10.1038/onc.2014.274. [DOI] [PubMed] [Google Scholar]
- 45.Favreau AJ, McGlauflin RE, Duarte CW, Sathyanarayana P. miR-199b, a novel tumor suppressor miRNA in acute myeloid leukemia with prognostic implications. Experimental Hematology & Oncology. 2015;5(1):4. doi: 10.1186/s40164-016-0033-6 [DOI] [PMC free article] [PubMed] [Google Scholar]
- 46.Trissal MC, DeMoya RA, Schmidt AP, Link DC. MicroRNA-223 regulates granulopoiesis but is not required for HSC maintenance in mice. PLoS One. 2015;10(3):e0119304. doi: 10.1371/journal.pone.0119304. [DOI] [PMC free article] [PubMed] [Google Scholar]


