

Summary
High-dimensional single cell profiling coupled with computational modeling is emerging as a powerful tool to elucidate developmental programs directing cell lineages. We introduce tSpace, an algorithm based on the concept of “trajectory space”, in which cells are defined by their distance along nearest neighbor pathways to every other cell in a population. Graphical mapping of cells in trajectory space allows unsupervised reconstruction and exploration of complex developmental sequences. Applied to flow and mass cytometry data, the method faithfully reconstructs thymic T cell development and reveals development and trafficking regulation of tonsillar B cells. Applied to the single cell transcriptome of mouse intestine and C. elegans, the method recapitulates development from intestinal stem cells to specialized epithelial phenotypes more faithfully than existing algorithms and orders C. elegans cells concordantly to the associated embryonic time. tSpace profiling of complex populations is well suited for hypothesis generation in developing cell systems.
Subject Areas: Developmental Biology, Systems Biology, In Silico Biology
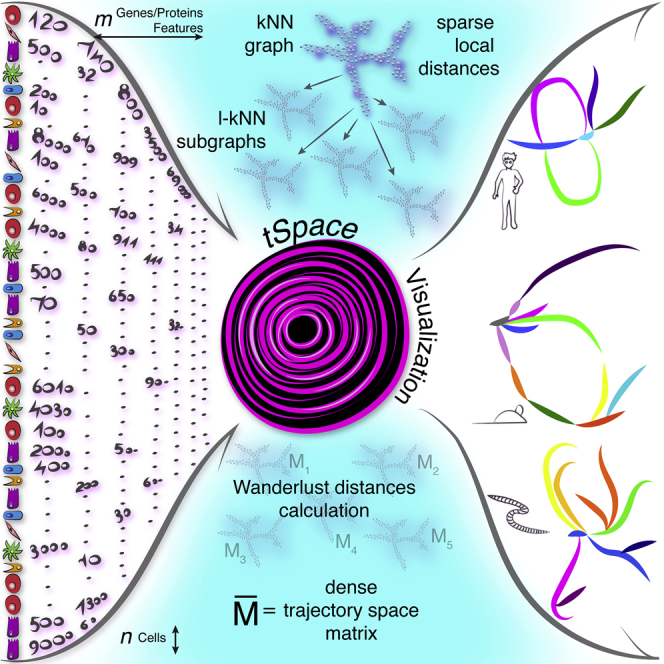
Graphical Abstract
Highlights
-
•
tSpace: trajectory analysis agnostic to biological systems and technology platforms
-
•
tSpace faithfully reconstructs complex developmental trees within one or more tissues
-
•
tSpace reveals rare transient cells usually missed by trajectory inference algorithms
-
•
tSpace confirms known and unveils novel biology in human B cells and mouse intestine
Developmental Biology; Systems Biology; In Silico Biology
Introduction
Precursor cells give rise to differentiated progeny through complex developmental pathways. Single cell technologies hold the promise of elucidating the developmental progression and defining underlying transcriptomic drivers and modulators. Mass cytometry and single cell RNA sequencing (scRNAseq) can capture a high-dimensional profile of a “cellular snapshot” within analyzed tissue that contains all developing, renewing, and differentiated cell populations. High-dimensional profiles of cells can then be computationally aligned to reveal developmental relationships.
Here we show that developmental pathways can be reconstructed from single cell profiles by analyzing cells in “trajectory space,” in which each cell is represented by a profile or vector of its relative distances along nearest neighbor pathways to every other cell. The concept is illustrated in Figure 1A, with a schematic example of several cells derived from cell A and analyzed with two phenotypic markers. Cells H and E are phenotypically similar but arise from different developmental sequences and thus are developmentally distant. A dense matrix of cell-to-cell distances along the developmental pathways is constructed, which when visualized with standard dimensionality reduction tools (e.g., principal component analysis [PCA]) can be used to explore cell relationships in this novel trajectory space. As illustrated, the method reconstitutes the correct branching developmental sequences of cells in the simple example.
Figure 1.

tSpace Concept and Application on Thymic T cells: tSpace Reveals Developmental Trajectories and Recovers Expression Patterns of Markers of T Cell Differentiation
(A) The schematic example illustrates the concept of trajectory space. The “cells” are marked with the letters A–I, and their developmental sequences are marked with arrows. Matrix of cell-to-cell distances along developmental paths is created (each cell is one unit from its nearest neighbor). Visualization of cell positions in this “trajectory space,” here using PCA, recapitulates the branches. Note that E and H, although similar phenotypically, are most distant in trajectory space, reflecting their developmental pathways.
(B) Unsupervised tSpace analysis of thymic mouse thymocytes accurately recapitulates thymic T cell development.
(C) t-SNE of thymic T cells defines clusters but not developmental relationships.
(D) Isolated trajectory from DN2 precursors to CD4 thymic emigrants.
(E) Smoothed expressions of measured markers along isolated trajectory (shown in D) reveals patterns of protein regulation during T cell differentiation. The identities of manually defined cell subsets as well as cell density along the isolated trajectory are shown for reference above the heatmap. DN, double-negative T cells; CD4 emig., CD4+ T cell poised emigrants; CD8 emig., CD8+ T cell poised emigrants.
Results and Discussion
Trajectory Space Concept and tSpace Algorithm
To implement the concept, we developed a tSpace algorithm. Its application to single cell datasets relies on the assumptions that (1) developmental processes are gradual, (2) all developmental stages are represented in the data, and (3) markers used to profile cells are regulated and sufficiently informative to distinguish different developmental pathways. Starting with cell profiles (phenotypes), tSpace identifies the K nearest neighbors of every cell, constructs a nearest neighbor (NN) graph that provides connections to all cells in the dataset, calculates distances from each cell to every other cell in the population along NN connections, and exports a dense matrix of N × T dimensions (number of cells N × number of calculated “trajectories” T, vectors of cell-to-cell distances within the manifold). Unlike other tools, tSpace determines the distances within the KNN graph using Wanderlust (Bendall et al., 2014), an algorithm that takes advantage of subgraphs and waypoints and implements a weighting scheme to reduce “short-circuits” in selecting optimal paths. The Wanderlust algorithm has been described in detail (Bendall et al., 2014). It significantly improves the definition of branching pathways even in simple flow cytometry datasets (Figure S1). We outline the effects of varying user-defined Wanderlust parameters on tSpace in the Supplemental Information (Figure S2). tSpace detection of developmental relationships is robust over a range of input parameters, allowing implementation of default settings that work well in different applications. The tSpace output provides principal component and UMAP embedding of cells in trajectory space, suitable for visualization and biological exploration of developmental pathways. The cell-to-cell distances, when exported, provide quantitative measures of phenotype change within the manifold based on user-selected metrics, useful for “pseudotime” ordering and analysis of, e.g., gene/protein expression changes along isolated linear developmental sequences. The use of unified metric-defined distances enables comparison of protein or gene expression dynamics along different trajectories on a common axis.
For samples with large cell numbers (N), tSpace has the option of calculating fewer trajectories, but it is important that these trajectories start from cells well distributed throughout phenotypical space. K-means clustering identifies groups of cells that are well distributed within phenotypic space, and we calculate trajectories from one cell from each such cluster. The clusters are not used for further analysis. As illustration of this feature, tSpace accurately recapitulates simple branching developmental paths from as few as 25–100 trajectories (Figure S1).
To evaluate the algorithm, we applied tSpace to developing populations of lymphocytes analyzed by flow or mass cytometry, small intestine epithelial cells, and C. elegans analyzed by scRNAseq.
tSpace Analysis of Mouse Thymic T Cells
T cell development in the thymus is well established and allows validation of tSpace in a defined system. We generated flow cytometric profiles of mouse thymocytes using a panel of 13 antibodies (Transparent Methods). Our panel detects early T cell populations (so-called double-negative populations DN1-DN4, which lack CD4 and CD8 and are distinguished by CD44 and CD25 expression), double-positive (DP) CD4+CD8+ cells, and CD4 or CD8 single-positive (SP) T cells including poised thymic emigrant phenotype cells, regulatory T cells (CD4+, CD25+, Foxp3+), and a small fraction of SP T cells expressing CD44, an activation and memory marker. We manually gated on these subsets and labeled them (Figure S3) (Shah and Zuniga-Pflucker, 2014). Unsupervised tSpace analysis reveals the expected bifurcation of CD4 versus CD8 lineages from the dominant DP population in thymopoiesis and correctly positions T cells from early (DN2) to mature thymic emigrant phenotype T cells in known developmental relationships (Figure 1B). DN1 cells were not present in the dataset. In addition to the expected major bifurcation of CD4 versus CD8 cells arising from the dominant DP pool, the analysis reveals branching of regulatory T cells (Foxp3+) from the SP CD4 stage of CD4 branch. In contrast to methods based on or using clustering for visualization (e.g., PAGA, SPADE, p-Creode, see comparisons in Supplemental Information), tSpace highlights a developmental continuum of cells allowing exploration of intermediate populations. For example, tSpace visualizes DP cells in transition to the more mature SP CD4 and CD8 T cells. The transitional cells co-express CD4 and CD8, but some have upregulated TCRβ and CD3ε, a characteristic of positively selected cells (Brodeur et al., 2009). Conventional clustering, based on measured markers using t-SNE, identifies the major subsets, but does not clarify developmental relationships (Figure 1C).
The tSpace output allows evaluation of expression of markers along developmental paths. To illustrate this for CD4 cell differentiation, we manually gated on cells along the path from DN2 cell to CD4 thymic poised emigrants (Figure 1D). We identified and averaged trajectories in the exported tSpace matrix (Transparent Methods) that started from early DN2 cells, and displayed marker expression along their trajectory distance from DN2 cells in a heatmap (Figure 1E). The results capture regulation of marker proteins as cells progress toward maturity, recapitulating known phenotypic progression of thymic T cell development and highlighting details of transitional states. For example, protein expression trends confirm upregulation of the chemokine receptor CCR9 in DN3 cells but reveal notably stronger expression in DN4-DP transitioning cells. CCR9 binds CCL25 expressed by thymic epithelial cells and promotes T cell cortical positioning (Wurbel et al., 2006).
tSpace Analysis of B Cell Differentiation in Tonsils and Inter-organ Trajectories with Blood
Single cell analyses hold the potential to provide insights into patterns of cell development in settings not accessible to experimental manipulation, as in the human. We applied tSpace to the development of B cells in human tonsils. Naive (IgD+) B cell differentiation toward immunoglobulin A or G (IgA, IgG) class switched memory or plasma cells has been investigated. However, the sequence of class switch- and fate-determining decision points and trafficking receptor induction remain poorly defined (Dufaud et al., 2017, Silva and Klein, 2015). We used a panel of mass-labeled antibodies that detects ∼25 markers of B cell subsets and maturation (Transparent Methods) to stain human tonsil lymphocytes. We applied tSpace (Figure 2A) to tonsil and blood B cells and subsequently used conservative gates based on antibody staining to highlight classically defined B cell subsets for visualization in the tSpace projections (Figure S4). Cells not falling within the conservative subset gates, which include bridging populations representing transitional phenotypes, are not labeled.
Figure 2.

tSpace Analysis of B Cell Differentiation in Tonsils and Inter-organ Trajectories with Blood
(A) tSpace unravels maturation paths of B cells starting from naive B cells in tonsil throughout GC into memory B cells and plasmablasts (PB). Magenta arrows mark suggested directionalities based on known biology.
(B) tPC1 and tPC2 reveal branches and potential developmental relationships in tonsillar B cell maturation.
(C) tPC3 and tPC4 reveal branches and potential developmental relationships in tonsillar B cell maturation. Ellipses show 80% confidence intervals for indicated clusters.
(D) Blood (BL) PB align as an extension of tonsillar PB trajectories, whereas recirculating blood memory B cells overlap with the major tonsil memory cell clouds. Tonsil B cells are in light gray.
tSpace analysis recapitulates developmental sequences leading from naive IgD+ B cells to tonsil IgG and IgA class switched effector cells. The first trajectory space principal component (tPC1) delineates the transition from naive to germinal center cells (GCC); tPC2, the differentiation of memory or plasma cells (Figures 2B and S5A); and tPC3 and tPC4 pathways, to IgA versus IgG class switched cells (Figure 2C). The distance of cells from naive B cells within the trajectory space manifold is illustrated in Figure S5B. A broad strand of cells connects naive IgD+ B cells to proliferating germinal center (GC) centroblasts and centrocytes (Figures 2A and S5A). Along this path from naive cells, IgD is downregulated and CD77 is upregulated as cells transition to centroblasts (Figures S5A, S5C, and S5D). There are clear, well-delineated trajectories from GCC to class switched plasmablast (PB): CD38, present on activated B cells and GCC, is further induced (Figures S5C and S5D), whereas CD20 is lost (not shown), recapitulating established patterns of antigen regulation in plasma cell development.
The regulation of trafficking receptors during B cell activation, isotype switching, and plasma cell generation in human lymphoid tissues has not been resolved. We evaluated chemoattractant and adhesion receptor expression by cells along the trajectory from naive B cells through the GC population to mature PBs. Early naive cells express CXCR5, which mediates lymphoid follicle homing, CCR6 (Figure S5C and S5D), and CCR7 (not shown). These trafficking receptors are downregulated in the transition to GCC, consistent with observations that GCC are non-migratory (Reichert et al., 1983). CD22 (Siglec2), a B cell-specific lectin that moderates B cell activation and also participates in B cell trafficking to gut-associated lymphoid tissues (Lee et al., 2014), is maintained on GCC but lost during terminal PB differentiation (Figures S5C and S5D). Induction of IgA or IgG occurs after initial upregulation of the GC marker CD77, consistent with the known role of GC in isotype switching (Figures S5C and S5D) (Kraal et al., 1982). Homing receptors for extra-lymphoid tissue effector sites appear to be induced rapidly upon exit of cells from the GC (CD77+) pool. CCR10, a chemoattractant receptor implicated in PB migration to pulmonary and colon mucosae, is upregulated along both IgG and IgA PB lineages, whereas β7 integrin, a component of the intestinal homing receptor, is highly upregulated in the IgA but not IgG trajectory (Figures S5C and S5D). Isotype-selective upregulation of tissue-specific adhesion receptors within a single inductive tissue has not been observed previously: the mechanisms involved may underlie the selectivity of local IgA secretion for mucosal tissues. CXCR3, implicated in lymphocyte homing to inflamed tissues (Rott et al., 1996, Seong et al., 2017), is coordinately upregulated in a minor subset of PB and by memory B cells (Figure S5A). Many tonsil memory B cells also express cutaneous lymphocyte antigen (CLA), a homing receptor for the vascular addressin CD62E associated with squamous epithelial surfaces including the oral mucosa; CLA was present on some blood PBs (not shown), but was not detected on PB branches in the tonsil.
In contrast to some other tools, tSpace does not constrain or force cells into specific developmental sequences or paths, but instead positions each cell in context with all others even when cell transitions are biologically diffuse. This is illustrated by the dispersed distribution of class switched IgG+ and IgA+ memory B cells in trajectory space (Figures 2C and S5A; and best visualized in 3D embedding, Video S1): memory cells constitute a “cloud” of cells, some of which appear to arise from the GC pool as mentioned, whereas others are closer in trajectory space to the path from naive B cells to GCs. Cell alignment in trajectory space does not intrinsically provide directional information, thus cells bridging the main memory cell population with GCs may reflect recruitment of memory cells into the active GC, or generation of memory cells from the GC reaction. The surprising alignment of many IgG- and IgA-expressing cells between naive and memory populations (adjacent to the naive to GC path; Figure S5A) suggests that, in steady-state human tonsil, activated B cells may undergo IgA or IgG class switching and conversion to memory cells without transiting through the GC reaction. Although class switch recombination is normally attributed to the GC reaction, in some mouse models class switching can occur before GC formation, and it is observed in T-independent B cell responses as well (Stavnezer and Schrader, 2014). Low expression of CD27 (Figure S5A) and retention of naive markers CCR6 and CXCR5 on the class switched cells adjacent to the “naive to GC” sequence is consistent with this interpretation (not shown). In contrast to their IgG and IgA class switched counterparts, IgM memory cells (CD27+, CD38-) are more closely connected to naive (IgM+, IgD+, CD27-, CD38-) cells in most tSpace principal components (tPCs), with tPC2 specifically expanding this trajectory (Figure 2B and Video S1). Thus, tSpace recapitulates known pathways of tonsil B cell development and differentiation, presents evidence that human B cells can follow alternative developmental paths that have only been described in animal studies, and reveals developmental stage(s) and transitions at which tissue- and inflammation-specific trafficking receptors are induced.
Rotation of the 3D imbedding facilitates visualization of naive B cell trunk, germinal center, memory B cell and plasmablast populations and their relationships, and the position of intermediate populations. Naive blood and tonsil B cells and memory IgA and IgG B cell pools exchange between blood and tonsil, and are intermixed in the projection. In contrast, developing plasmablasts mature in the tonsil and migrate into the blood: alignment in trajectory space links terminal tonsil plasmablast development directly to their blood counterparts.
Developing PBs generated in lymphoid tissues leave their sites of antigen activation and circulate via the blood to distant effector sites. We reasoned that trajectories might link terminally differentiated cells, ready to exit their site of generation, with progeny cells in blood. Indeed, when we applied tSpace to combined blood and tonsil B cells datasets, blood PB aligned at the termini of tonsillar IgG and IgA PB branches (Figure 2D and Video S2). In contrast to the unidirectional path of maturing PBs, blood memory B cells and naive IgD+ B cells exchange between blood and lymphoid tissues through recirculation. Consistent with intermixing, these subsets overlap extensively with their tonsillar counterparts in trajectory space (Figure 2D). These results show that tSpace can unfold inter-organ transitions and elucidate developmentally programmed migration patterns of immune cells in settings wherein experimental analyses of leukocyte trafficking are challenging, as in humans.
tSpace Analysis of Mouse Small Intestine Reveals Rare Enteroendocrine Progenitor Population and Defines Transcription Factor Modules of Intestinal Differentiation
scRNAseq is emerging as a powerful tool for the characterization of cell populations and provides rich cellular profiles for studying cell relationships. We applied tSpace to published scRNAseq data from mouse intestinal epithelial cells using 2,420 variable genes (Yan et al., 2017) (Transparent Methods). Intestinal epithelium forms the single cell layer separating the lumen of small intestine from intestinal lamina propria. Almost all cells in the epithelium have a short lifespan of about 4–7 days (Barker et al., 2012), and continuous renewal is driven by division of Lgr5+ crypt base columnar (CBC) cells residing at the bottom of the intestinal crypts. Transit-amplifying (TA) cells within the crypt differentiate into absorptive (enterocyte) or secretory (goblet, Paneth, tuft and enteroendocrine [EE] cell) lineages. tSpace delineates absorptive/enterocyte and secretory/EE developmental paths (Figures 3A, S6A, and S6B). Goblet and Paneth cells define short branches from the proliferating TA pool.
Figure 3.

tSpace Analysis of Mouse Small Intestinal Epithelial Cells
(A) tSpace separates trajectories to enterocytes, enteroendocrine (EE), Paneth, and goblet cells. CBC and TA subsets were defined by our analysis, as described in Figure S7; other subsets are labeled as in Yan et al. (2017). Shaded rectangle highlights the position of short-lived EE progenitors (slEEP) cells.
(B) Isolated enterocyte trajectory.
(C) Isolated EE trajectory.
(D) Expression patterns of selected genes (Clevers, 2013) (known markers or regulators of intestinal crypt development; expanded gene list in Figure S8A) along the isolated trajectories.
(E) Four detected transcription factor modules in early trajectories, identified by comparing gene expression between cells at similar stages in the two trajectories (Transparent Methods): M1 comprises TFs involved in cell cycle and genome integrity expressed in precursor populations (early in the shared trajectory). M2 and M3-M4 differentiate the two lineages and comprise TF's that may determine cell fate or specialization (see text). Cell stage (Transparent Methods) and cell identities defined in this study (Cell type) or in Yan et al. (Orig. labels) are indicated above the heatmap. ND, fully differentiated enterocytes, not used in trajectory alignment.
(F) Summary of differences between two branches suggested by gene regulation along the trajectories. Different genes in the transforming growth factor-β and circadian rhythm pathways are expressed in the two lineages (genes in blue above the cartoon). TFs enriched in the EE branch are involved in endocrine secretory cell development, whereas TFs associated with enterocyte commitment include regulators of lipid/cholesterol metabolism. Expression of Dll1 and Sox4 in EE development and Alpi in enterocyte differentiation mark specific progenitor cells located within the +4/+5 position in the intestinal crypt according to the literature (van Es et al., 2012, Gracz et al., 2018, Tetteh et al., 2016); clear peaks are seen in their expression along the trajectories (Figures 3D and 3E) near the TA to differentiated cell transitions, likely representing these specific progenitor populations.
The ability of tSpace to position all cells in developmental relationships allows additional interesting insights. tSpace trajectories reveal a common “trunk” leading to secretory and absorptive branches, but many slow-cycling CBC (sc-CBC) and cycling TA (c-TA) cells (defined Figure S7) actually segregate to the early EE or enterocyte branches, suggesting that they are already developing toward if not committed to EE or enterocyte fates. To illustrate the application of tSpace to explore developmental progression of gene expression in this context, we isolated trajectories within the tSpace distance matrix starting from the Lgr5+ CBC cell population, gated on cells of the enterocyte branch and cells within the early segment of the EE branch preceding EE3 (Figures 3B and 3C), and plotted gene expression of cells versus their trajectory distance from CBC cells (Figure 3D). We focused initially on genes for known hallmarks of intestinal differentiation (Figures 3D and S8A) (Clevers, 2013). The analysis confirms Ascl2 (van der Flier et al., 2009b), OlfM4 (van der Flier et al., 2009a), and Prom1 (Zhu et al., 2009) as robust markers of the presumptive crypt populations (CBC to TA cells) and reveals that the expression of Prom1 extends into the TA pool, confirming previous findings (Itzkovitz et al., 2011) (Figures 3D and S8A). The Wnt agonist Lgr5 and its homolog Lgr4 are in resting CBC and dividing sc-CBC cells, but the analysis shows that Lgr4 expression is retained in post-mitotic cells differentiating toward absorptive enterocytes from c-TA, suggesting that in addition to its known role in proliferation of TA cells (Mustata et al., 2011) it may contribute to enterocyte fate or specification.
Further examination revealed Dll1-expressing cells in trajectory space between CBC cells and mature EE populations (Figure 3A, shaded gray rectangle, Figure 3D). These cells express genes that define short-lived enteroendocrine progenitors (slEEP) (van Es et al., 2012), which upregulate EE lineage specification genes Neurog3, Neurod1, and Neurod2 (Figure 3D) (Jenny et al., 2002, Schonhoff et al., 2004). Consistent with their location in tSpace projection, sIEEP are well-documented precursors of EE cells (Barker et al., 2012, van Es et al., 2012, Schonhoff et al., 2004). The EE branch proceeds through EE3 cells, recently identified as EE intermediates, giving rise to specialized mature EE subsets (Yan et al., 2017) (for cell labels see Transparent Methods and Figure S7). Interestingly, sparse intermediates link a single tuft cell population to both CBC/TA and to EE3 cells (best visualized when UMAP is applied to trajectory space matrix, Figures S6A and S6B). Although the number of intermediate cells linking these two pathways to tuft cells would suggest caution in interpretation, it is noteworthy that a dual origin of tuft cells (directly from Lgr5+ CBC cells but also from EE3 EE cells) has been proposed from multiple lines of evidence (Gerbe et al., 2012, Yan et al., 2017). tSpace performed well when compared with SPADE, a minimum spanning tree (MST) algorithm applied to visualize trajectory relationships in the original analysis of this scRNAseq dataset. SPADE (Yan et al., 2017) and tSpace both delineate the major CBC to enterocyte and EE branches, the relationship of goblet and Paneth cells to CBC/TA, and the terminal branching of EE subsets. SPADE generates a 2D representation of an MST structure, an approach that is inherently challenged by non-tree-like developmental paths, such as the paths from EE3 and CBC that converge on tuft cells (Figures 3A, S6A, and S6B). tSpace identified a single tuft cell pool with dual connections, whereas SPADE analysis forced tufts cells into two disconnected populations, one arising from CBC cells and the other from intermediates leading to EE3 cells. SPADE also failed to detect or properly position slEEP on the path to EE cells (Yan et al., 2017). In contrast to tSpace, which positions each cell in trajectory space, SPADE and related MST algorithms rely on prior definition of cell clusters and limited gene sets, features that run the risk of missing or mislabeling important cell intermediates (Yan et al., 2017). sIEEP were defined either as cycling CBC or goblet cells in the published analysis and were subsumed in biologically inappropriate clusters (Figures S7A, S7B, S7D, and S8A see original labels).
Overall, cell positioning in trajectory space and the patterns of gene expression reflect observations from decades of research on intestinal development, and also suggest refinements to current understanding. Many TA cells express gene programs leading to secretory versus absorptive phenotypes (Figures 3D and S8A), indicating that fate selection is already initiated within the dividing (TA) pool that arises from Lgr5+ CBC. A global survey of transcription factor (TF) expression during early specification of secretory versus absorptive fates has not been described. We evaluated gene expression along tSpace-defined developmental sequences to identify TF that might specify and/or control downstream cell specialization. Four distinct TF modules were identified (Transparent Methods) based on their patterns of regulation along early EE or enterocyte branches (M1–M4, Figures 3E and S8C). Genes for proliferation and DNA maintenance (M1, e.g., Ccna2, Cdk2, Fancd2, Rbl1) are expressed by dividing sc-CBC and TA “early” along the trajectory, as expected. A second module of TF genes is also expressed by early cells but is maintained selectively in the EE branch: these include TFs associated with endocrine and pancreatic development (e.g., Foxa2, Foxa3, Neurog3, Sox4, Sox9) that may coordinate secretory pathways within intestinal EE cells (Tabula Muris Consortium et al., 2018). Interestingly, among these, tSpace revealed an unexpectedly high and selective expression of Sox4 in slEEP cells, suggesting it as a novel candidate contributor to EE specification (Figures 3E, S7C, and S7E): this prediction has been subsequently confirmed (Gracz et al., 2018). Module 3 and 4 TFs are expressed preferentially in the enterocyte branch. They include TF involved in lipid and cholesterol metabolism required for mature enterocytes (e.g., Cebpb, Klf5, Nr5a2, Figures 3E and S8C) (Degirolamo et al., 2015, Yen et al., 2014), and also Nfe2l2 and Maf associated with the activation of Nfe2l2/Nrf2-antioxidant response element (ARE) pathway (Itoh et al., 1997). Enterocytes utilize short fatty acids as a source of energy; fatty acid metabolism generates reactive oxygen species (ROS), and ROS are also abundant in the intestinal lumen. Upregulation of the Nfe2l2-ARE pathway may help protect differentiating enterocytes from oxidative damage (Ferrebee et al., 2018). The analysis also identified Isx and Ski (both within M3) as putative novel markers of TA cells within the early enterocyte developmental branch; lack of specific markers has hindered isolation of TA cells and further probing of their plasticity.
Benchmarking of tSpace Performance Using a Developmentally Timed C. elegans Dataset
Finally, we benchmarked tSpace using C. elegans scRNAseq (Packer et al., 2019), a dataset that can be considered the gold standard for developmental trajectory inference benchmarking because each cell is associated with actual developmental time. We run tSpace analysis using all 86,024 cells and 75 PCs in gene expression space (Transparent Methods). tSpace provides connections to all cell types, unlike UMAP, the method used by Packer et al. (Figures 4A and 4B). Using UMAP on gene profiles looks similar, as expected, to the UMAP in Packer et al. (2019) Major cell populations are well separated from each other without indication of developmental relations: for example, groups of muscle and pharynx cell types are disconnected from the rest of the cells, as well as intestine or hypodermis and seam cells. Conversely, tSpace analysis using 1,000 trajectories aligns all cells in the correct order as examined by plotting raw embryonal time associated with every cell in the dataset (Figure 4B) and separates all major cell lineages (Figures 4B, inset, and 4C). tSpace alignments using 50 trajectories still retained distinct branching of all major cellular lineages and the correct developmental connections between the cells (Figures 4D–4G). As few as 50 trajectories permits tSpace to order cells correctly (Figure 4D), but alignments using 100 and 500 trajectories showed progressive improvement in resolution and connection between cell types (e.g., compare intestinal cells marked with an arrow Figures 4D–4F). Thus, although tSpace ran into memory limitations when the trajectory number T is high (e.g., 5,000 trajectories failed when applied to the current example), T = 100 is sufficient for even large and complex datasets.
Figure 4.

Benchmarking of tSpace Performance Using a Developmentally Timed C. elegans Dataset
(A) UMAP of 75 PCs of gene expression matrix, re-creating the UMAP from Packer et al., showing major cell types.
(B) tSpace analysis using 1,000 trajectories, showing the first three tPCs and raw embryonal time; inset shows cell types.
(C–F) (C) The same tSpace analysis as in (B) visualized in tPC1, tPC3, and tPC4: this combination of tPCs allows separation of all major lineages, and interestingly places pharyngeal intestinal valve (PIV) cells in close proximity to intestine and intestine close to rectal cells, relations that resemble spatial cell positions in C. elegans body: PIV cells link the posterior bulb of the pharynx to the anterior cells of the intestine, and the intestine is eventually connected to the rectum. The first three tPCs and raw embryonal time using (D) 50 trajectories, (E) 100 trajectories, and (F) 500 trajectories. Arrows and ellipsoids mark intestinal cell type.
(G) tSpace analysis using 500 trajectories, 3D representation of cell types in tPC1, tPC3, and tPC4. tSpace defines branches for all main lineages.
Similar to the UMAP analysis (Packer et al., 2019), we noticed that tSpace provides greater resolution toward terminally differentiated cell types. Packer et al. iteratively run UMAP on subsets of cell types to achieve resolution and precision in the early developmental stages or specific tissues. To examine tSpace performance in early development, we focused on ABpxppp sublineage (Figure S9A, for details see Packer et al., 2019). Indeed, utilizing UMAP on a full dataset does not allow precise mapping and does not preserve developmental connections of the early cell lineages (Figures S9B and S9C). Remarkably, tSpace connects and correctly orders ABpxppp sublineage (Figures S9D–S9I). Although the cells are correctly ordered, unlike in UMAP, the two cycles of division after ABpxppp are difficult to visually dissect. However, seven daughter cell types (ABpxpppaaa, ABpxpppaap, ABpxpppapa, ABpxppppaa, ABpxppppap, ABpxpppppa, ABpxpppppp), products of the third division after ABpxppp, are separated and easily recognized as elongated branches (Figures S9E–S9H). tSpace maps one of them, ABpxpppppa, close to, but not as part of the muscle cell-type branch (Figure S9I) reflecting the true biology. Muscle cell types are developed from mesoderm MS lineage. UMAP of the full dataset incorrectly suggests ABpxpppppa as a precursor of the MS lineage and muscle cells. Overall, tSpace preserves developmental cell-to-cell relations better than UMAP and performs well in real-world complex data with 5+ diverse lineages (MS muscle, MS pharynx, C and D muscle, and AB-derived lineages) represented by C. elegans.
tSpace Performance and Comparison with Other Trajectory Inference Algorithms
tSpace applied to four different datasets illustrates how the number of trajectories, of cells, and of measured protein or gene parameters all impact computation time (Table S1), as does the hardware employed. For cytometry datasets, we generally run tSpace on all measured parameters. For scRNAseq studies, we often run the algorithm with significant principal components. For any larger data, especially in number of cells, we suggest use of multicore computers to speed up the analysis. As the examples presented illustrate, we generally limit T to 100–1,000. Although not illustrated here, for scRNAseq and other sparse datasets we find that imputation can further improve the definition of branches and branchpoints along developmental trajectories.
The tSpace approach is conceptually similar to isomap (Tenenbaum et al., 2000). Both methods provide a global approach to dimensionality reduction, designed to preserve manifold geometry at all scales. Both algorithms determine geodesic distances along a KNN graph. Isomap embeds the resulting distance matrix in low dimensions using multidimensional scaling (MDS). It has been successfully applied to diverse high-dimensional datasets (Hannachi and Turner, 2013, Mahecha et al., 2007, Silva and Tenenbaum, 2003, Stamati et al., 2010), but it has not been widely adopted for high-dimensional single cell analyses, perhaps because of well-described limitations. The algorithm is computationally and memory expensive. This has been addressed in part in “landmark isomap” by calculating approximate distances using a set of randomly selected “landmark” cells. To ensure uniform sampling of the manifold, we modify this approach in tSpace by selecting individual cells from each of T K-means clusters, where T is the number of trajectories to be calculated. We show that linear trajectories (distance vectors) calculated from 100–250 well-distributed starting cells are sufficient to recapitulate cellular relationships in each of the datasets here. As each such trajectory includes all cells and provides estimates of their intercellular distances within the trajectory, a small number of such trajectories provides a surprisingly good approximation of cell relationships in trajectory space. Isomap suffers also from sensitivity to “short circuit” errors if K is too large or if noise in the data positions cells aberrantly between valid branches or populations in the manifold. Short circuits pose a problem with the Dijkstra algorithm, used in isomap to calculate shortest paths between cells. We take advantage of Wanderlust, which refines distances and avoids “short circuits” by using subgraph averaging and weighting in shortest path calculations based on waypoints (Bendall et al., 2014). We show that tSpace with Wanderlust improves the definition of developmental paths (Figure S1). However, isomap uses MDS, a memory-intensive algorithm, for dimensionality reduction and visualization of manifold relationships, tSpace utilizes PCA and/or UMAP. We find that the first three tPCs often embody the most important developmental branches (with simple branching development), but higher tPCs can also reveal critical biological processes. Many methods allow reconstruction of simple developmental branching sequences, but it is becoming increasingly clear that differentiating cells in development and cancer can and often do retain multi-potency even as they mature. This leads to complex higher-dimensional “lineages” or developmental pathways that cannot be represented in 2D or even 3D. In this setting, exploration of PCA projections of trajectory space is valuable, as higher tPCs can reveal additional branching pathways and relationships. We illustrate, for example, the parallel pathways of IgA versus IgG memory and plasma cell development in tonsil B cells, which dominate the fourth tPC. tSpace also implements dimensionality reduction with UMAP (McInnes et al., 2018). Although UMAP implements a force-directed algorithm that obscures developmental distances, it is an excellent tool for reducing dimensionality to 2-3 dimensions for visualization of the tSpace manifold. We show for our scRNAseq example that UMAP embedding of trajectory space reveals developmental branches better than UMAP embedding of the original gene expression matrix (see Supplemental Information: Comparison of tSpace and Other Trajectory Inference Algorithms).
We examine the performance of several widely used methods (Reviewed in Cannoodt et al., 2016, Saelens et al., 2018) with tSpace in Supplemental Information (Figures S10–S14). Few unsupervised methods exist (we tested Monocle, p-Creode, DPT, PAGA, and because of its speed and usefulness UMAP), and none combine the scalability and quantitative distance metrics of tSpace. For example, tSpace has advantages over algorithms that use memory-intensive MST methods to define branch points, as for large datasets these depend on downsampling of cells or calculation of relationships between clusters (rather than individual cells) to reduce computational complexity. Examples include slingshot (Street et al., 2018), p-Creode (Herring et al., 2017), and SPADE (Qiu et al., 2011). As highlighted above in the discussion of published analysis of intestinal epithelial cells, downsampling in MST-based methods holds inherent risks of obscuring important cell subsets, and in most algorithms, fails to position each cell in developmental relationships. tSpace avoids the loss of individual cell resolution associated with cell downsampling, while retaining the ability to reveal the developmental relationships of all cells to each other even when popular and faster UMAP fails (e.g., analysis of full C. elegans dataset). Algorithms that focus on computationally defining branchpoints and tree structures (e.g., Monocle, slingshot) can also limit appreciation of alternative pathways of differentiation represented by cells that bridge between dominant pathways (e.g., converging paths of tuft cells). Moreover, in contrast to algorithms that rely only on local cell relationships or that use force-directed graph methods, the global approach of tSpace estimates distant as well as nearby cell relationships within the manifold. Indeed, the algorithm exports a dense matrix of meaningful cell-to-cell distances that represent measures of the extent of phenotypic change along developmental pathways. As illustrated in our examples, cells along specific developmental pathways and branches can be easily gated (isolated) in plots of tPCs using commonly available software such as Flowjo, JMP, or in R (Transparent Methods). Trajectories starting from branch termini or other desired points within pathways are readily identified within the tSpace matrix and plotted versus gene/protein expression to characterize changes in cell phenotypes along isolated developmental sequences (as in Figures 1, 2, and 3).
Conclusions
We have presented the concept of trajectory space and its implementation in the tSpace algorithm for elucidation of branching or convergent developmental pathways and mechanisms from single cell profiles. tSpace performs well across different biological systems and platforms, and reveals known and novel biology. tSpace embodies a combination of useful features including (1) applicability to any type of data (proteomic, transcriptomic, etc.), (2) simplicity of use, (3) robustness to input parameters, (4) scalability and independence from the need for cell downsampling, (5) positioning of each individual cell correctly in developmental relationships (allowing visualization of alternative or minor pathways of differentiation), (6) retention of global as well as local cell relationships with export of quantitative measures of cell-to-cell distances in the manifold, and (7) independence from requirements of clustering or prior information. The tSpace outputs are often more precise than other trajectory inference algorithms, reproducible, intuitive, and amenable to exploration of biology (gene or protein expression, trajectory isolation, etc.). We believe that tSpace will prove useful to the rapidly growing field of singe cell analysis.
Limitations of the Study
We highlight some of the practical features and limitations of tSpace and of other published algorithms designed for multi-branching and complex manifolds (Table S2). tSpace attempts a true representation of the underlying manifold, without manipulation for graphical expedience, and when visualized in principal component projection is highly reproducible and robust to changes of parameters: it allows users to explore hidden biology and compare results confidently. However, faithfulness to the manifold limits the ability of tSpace, in comparison to user-optimized UMAP for example, to generate appealing 2D or 3D representations. We discuss UMAP reduction of the tSpace matrix as a compromise solution. Similarly, whereas UMAP implements features that result in attraction and repulsion to enforce cluster formation and separation, tSpace does not. Because of this tSpace excels at revealing sparsely populated developmental trajectories that may be ‘broken’ in cluster-forming methods. However, tSpace can make links between unrelated cell types when biologically valid intermediates are missing, and as in other methods, computationally defined trajectories must be interpreted in the light of prior biological knowledge and/or be validated experimentally. tSpace faces memory limits in cases of large datasets (100,000+ cells) when calculating several thousand trajectories; and tSpace running times in such instances can be a limiting factor. In practice, we find that T = 100 provides accurate trajectories for most datasets, and tSpace in Matlab with T = 100, 30,000 cells and 30 principal components from scRNAseq data runs on a personal computer in under 20 minutes. A final limitation of this study is that we lack a quantitative metric to compare the usefulness of tSpace (vs other methods considered) for manifold exploration and biological interpretation, relying instead on concrete though anecdotal examples.
Methods
All methods can be found in the accompanying Transparent Methods supplemental file.
Acknowledgments
Mass cytometry analysis for this project was done on Cyrano instrument in the Stanford Shared FACS Facility, obtained by S10OD016318-01 NIH grant. This study is the result of work supported with resources and the use of facilities at the VA Palo Alto Health Care System (Disclaimer: the contents of this study do not represent the views of VA or the United States Government). We thank Raghav and Durga Ganesh for assistance with parts of the code, Menglan Xiang and Sofia Nordling for help with evaluations of the algorithm, Steven Schaffert for constructive discussions, and Lourdes Magalhaes for administrative assistance.
This work was supported by NIH grants R37-AI047822, R01 AI130471, and R01-CA228019 and award I01 BX-002919 from the Dept of Veterans Affairs to E.C.B.; by R01-AI109452 to H.H., and by pilot awards under ITI Seed 122C158 and CCSB grant U54-CA209971 to D.D. and E.C.B. M.B. was supported by fellowships from the German Research Foundation (DFG, BS56/1-1) and the Crohn’s and Colitis Foundation of America. A.S. was supported by the Mobility Plus fellowship from the Ministry of Science and Higher Education, Poland (1319/MOB/IV/2015/0).
Author Contributions
D.D. wrote the algorithm, supervised computational analyses, and interpreted intestinal and C. elegans data; K.B. wrote parts of the algorithm; D.D. and H.H. designed and interpreted the thymus study; M.B. and N.H.L. performed and D.D. and M.B. analyzed the tonsil B cell study; A.S. prepared human tissues; D.D., M.B., and E.C.B. wrote the manuscript; H.H. provided advice; E.C.B. conceived the trajectory space concept and supervised the project; D.D. and E.C.B. revised manuscript.
Declaration of Interests
The authors have declared no conflict of interest.
Published: February 21, 2020
Footnotes
Supplemental Information can be found online at https://doi.org/10.1016/j.isci.2020.100842.
Contributor Information
Denis Dermadi, Email: ddermadi@stanford.edu.
Eugene C. Butcher, Email: ebutcher@stanford.edu.
Data and Code Availability
This manuscript is accompanied with Supplemental items. Code and data are available upon request.
Previously published dataset of intestinal cell populations was provided by the authors as normalized and scaled expression values (Yan et al., 2017). C. elegans dataset (86,024 cells) was downloaded from Gene Expression Omnibus (www.ncbi.nlm.nih.gov/geo) under accession code GSE126954.
tSpace package for R is available on https://github.com/hylasD/tSpace, and MATLAB https://github.com/hylasD/MATLAB_version_tSpace. tSpace tutorial can be found at http://denisdermadi.com/tspace-trajectory-inference-algorithm.
Supplemental Information
References
- Barker N., van Oudenaarden A., Clevers H. Identifying the stem cell of the intestinal crypt: strategies and pitfalls. Cell Stem Cell. 2012;11:452–460. doi: 10.1016/j.stem.2012.09.009. [DOI] [PubMed] [Google Scholar]
- Bendall S.C., Davis K.L., Amir E., Tadmor M.D., Simonds E.F., Chen T.J., Shenfeld D.K., Nolan G.P., Pe’er D. Single-cell trajectory detection uncovers progression and regulatory coordination in human B cell development. Cell. 2014;157:714–725. doi: 10.1016/j.cell.2014.04.005. [DOI] [PMC free article] [PubMed] [Google Scholar]
- Brodeur J.-F., Li S., Damlaj O., Dave V.P. Expression of fully assembled TCR–CD3 complex on double positive thymocytes: synergistic role for the PRS and ER retention motifs in the intra-cytoplasmic tail of CD3ε. Int. Immunol. 2009;21:1317–1327. doi: 10.1093/intimm/dxp098. [DOI] [PubMed] [Google Scholar]
- Cannoodt R., Saelens W., Saeys Y. Computational methods for trajectory inference from single-cell transcriptomics. Eur. J. Immunol. 2016;46:2496–2506. doi: 10.1002/eji.201646347. [DOI] [PubMed] [Google Scholar]
- Clevers H. The intestinal crypt, A prototype stem cell compartment. Cell. 2013;154:274–284. doi: 10.1016/j.cell.2013.07.004. [DOI] [PubMed] [Google Scholar]
- Degirolamo C., Sabbà C., Moschetta A. Intestinal nuclear receptors in HDL cholesterol metabolism. J. Lipid Res. 2015;56:1262–1270. doi: 10.1194/jlr.R052704. [DOI] [PMC free article] [PubMed] [Google Scholar]
- Dufaud C.R., McHeyzer-Williams L.J., McHeyzer-Williams M.G. Deconstructing the germinal center, one cell at a time. Curr. Opin. Immunol. 2017;45:112–118. doi: 10.1016/j.coi.2017.03.007. [DOI] [PMC free article] [PubMed] [Google Scholar]
- Ferrebee C.B., Li J., Haywood J., Pachura K., Robinson B.S., Hinrichs B.H., Jones R.M., Rao A., Dawson P.A. Organic solute transporter α-β protects ileal enterocytes from bile acid–induced injury. Cell Mol. Gastroenterol. Hepatol. 2018;5:499–522. doi: 10.1016/j.jcmgh.2018.01.006. [DOI] [PMC free article] [PubMed] [Google Scholar]
- Gerbe F., Legraverend C., Jay P. The intestinal epithelium tuft cells: specification and function. Cell. Mol. Life Sci. 2012;69:2907–2917. doi: 10.1007/s00018-012-0984-7. [DOI] [PMC free article] [PubMed] [Google Scholar]
- Gracz A.D., Samsa L., Fordham M.J., Trotier D.C., Zwarycz B., Lo Y.-H., Bao K., Starmer J., Raab J.R., Shroyer N.F. SOX4 promotes ATOH1-independent intestinal secretory differentiation toward tuft and enteroendocrine fates. Gastroenterology. 2018;155:1508–1523.e10. doi: 10.1053/j.gastro.2018.07.023. [DOI] [PMC free article] [PubMed] [Google Scholar]
- Hannachi A., Turner A.G. Isomap nonlinear dimensionality reduction and bimodality of Asian monsoon convection. Geophys. Res. Lett. 2013;40:1653–1658. [Google Scholar]
- Herring C.A., Banerjee A., McKinley E.T., Simmons A.J., Ping J., Roland J.T., Franklin J.L., Liu Q., Gerdes M.J., Coffey R.J., Lau K.S. Unsupervised trajectory analysis of single-cell RNA-seq and imaging data reveals alternative tuft cell origins in the gut. Cell Syst. 2017;6:37–51.e9. doi: 10.1016/j.cels.2017.10.012. [DOI] [PMC free article] [PubMed] [Google Scholar]
- Itoh K., Chiba T., Takahashi S., Ishii T., Igarashi K., Katoh Y., Oyake T., Hayashi N., Satoh K., Hatayama I. An Nrf2/small Maf heterodimer mediates the induction of phase II detoxifying enzyme genes through antioxidant response elements. Biochem. Biophys. Res. Commun. 1997;236:313–322. doi: 10.1006/bbrc.1997.6943. [DOI] [PubMed] [Google Scholar]
- Itzkovitz S., Lyubimova A., Blat I.C., Maynard M., van Es J., Lees J., Jacks T., Clevers H., van Oudenaarden A. Single-molecule transcript counting of stem-cell markers in the mouse intestine. Nat. Cell Biol. 2011;14:106–114. doi: 10.1038/ncb2384. [DOI] [PMC free article] [PubMed] [Google Scholar]
- Jenny M., Uhl C., Roche C., Duluc I., Guillermin V., Guillemot F., Jensen J., Kedinger M., Gradwohl G. Neurogenin3 is differentially required for endocrine cell fate specification in the intestinal and gastric epithelium. Embo J. 2002;21:6338–6347. doi: 10.1093/emboj/cdf649. [DOI] [PMC free article] [PubMed] [Google Scholar]
- Kraal G., Weissman I., Butcher E. Germinal centre B cells: antigen specificity and changes in heavy chain class expression. Nature. 1982;298:377–379. doi: 10.1038/298377a0. [DOI] [PubMed] [Google Scholar]
- Lee M., Kiefel H., LaJevic M.D., Macauley M.S., Kawashima H., O’Hara E., Pan J., Paulson J.C., Butcher E.C. Transcriptional programs of lymphoid tissue capillary and high endothelium reveal control mechanisms for lymphocyte homing. Nat. Immunol. 2014;15:982–995. doi: 10.1038/ni.2983. [DOI] [PMC free article] [PubMed] [Google Scholar]
- Mahecha M.D., Martínez A., Lischeid G., Beck E. Nonlinear dimensionality reduction: alternative ordination approaches for extracting and visualizing biodiversity patterns in tropical montane forest vegetation data. Ecol. Inform. 2007;2:138–149. [Google Scholar]
- McInnes L., Healy J., Melville J. 2018. UMAP: Uniform Manifold Approximation and Projection for Dimension Reduction. arXiv. https://arxiv.org/abs/1802.03426v2. [Google Scholar]
- Mustata R.C., Loy T., Lefort A., Libert F., Strollo S., Vassart G., Garcia M. Lgr4 is required for Paneth cell differentiation and maintenance of intestinal stem cells ex vivo. EMBO Rep. 2011;12:558–564. doi: 10.1038/embor.2011.52. [DOI] [PMC free article] [PubMed] [Google Scholar]
- Packer J.S., Zhu Q., Huynh C., Sivaramakrishnan P., Preston E., Dueck H., Stefanik D., Tan K., Trapnell C., Kim J. A lineage-resolved molecular atlas of C. elegans embryogenesis at single-cell resolution. Science. 2019;365:eaax1971. doi: 10.1126/science.aax1971. [DOI] [PMC free article] [PubMed] [Google Scholar]
- Qiu P., Simonds E.F., Bendall S.C., Jr., Gibbs K.D., Bruggner R.V., Linderman M.D., Sachs K., Nolan G.P., Plevritis S.K. Extracting a cellular hierarchy from high-dimensional cytometry data with SPADE. Nat. Biotechnol. 2011;29:886. doi: 10.1038/nbt.1991. [DOI] [PMC free article] [PubMed] [Google Scholar]
- Reichert R., Gallatin W., Weissman I., Butcher E. Germinal center B cells lack homing receptors necessary for normal lymphocyte recirculation. J. Exp. Med. 1983;157:813–827. doi: 10.1084/jem.157.3.813. [DOI] [PMC free article] [PubMed] [Google Scholar]
- Rott L., Briskin M., Andrew D., Berg E., Butcher E. A fundamental subdivision of circulating lymphocytes defined by adhesion to mucosal addressin cell adhesion molecule-1. Comparison with vascular cell adhesion molecule-1 and correlation with beta 7 integrins and memory differentiation. J. Immunol. 1996;156:3727–3736. [PubMed] [Google Scholar]
- Saelens W., Cannoodt R., Todorov H., Saeys Y. A comparison of single-cell trajectory inference methods: towards more accurate and robust tools. Biorxiv. 2018:276907. doi: 10.1038/s41587-019-0071-9. [DOI] [PubMed] [Google Scholar]
- Schonhoff S.E., Giel-Moloney M., Leiter A.B. Neurogenin 3-expressing progenitor cells in the gastrointestinal tract differentiate into both endocrine and non-endocrine cell types. Dev. Biol. 2004;270:443–454. doi: 10.1016/j.ydbio.2004.03.013. [DOI] [PubMed] [Google Scholar]
- Seong Y., Lazarus N.H., Sutherland L., Habtezion A., Abramson T., He X.-S., Greenberg H.B., Butcher E.C. Trafficking receptor signatures define blood plasmablasts responding to tissue-specific immune challenge. JCI Insight. 2017;2:e90233. doi: 10.1172/jci.insight.90233. [DOI] [PMC free article] [PubMed] [Google Scholar]
- Shah D., Zuniga-Pflucker J. An overview of the intrathymic intricacies of T cell development. J. Immunol. 2014;192:4017–4023. doi: 10.4049/jimmunol.1302259. [DOI] [PubMed] [Google Scholar]
- Silva N.S., Klein U. Dynamics of B cells in germinal centres. Nat. Rev. Immunol. 2015;15:137–148. doi: 10.1038/nri3804. [DOI] [PMC free article] [PubMed] [Google Scholar]
- Silva V.D., Tenenbaum J.B. 2003. Global versus Local Methods in Nonlinear Dimensionality Reduction; pp. 721–728. [Google Scholar]
- Stamati H., Clementi C., Kavraki L.E. Application of nonlinear dimensionality reduction to characterize the conformational landscape of small peptides. Proteins. 2010;78:223–235. doi: 10.1002/prot.22526. [DOI] [PMC free article] [PubMed] [Google Scholar]
- Stavnezer J., Schrader C.E. IgH chain class switch recombination: mechanism and regulation. J. Immunol. 2014;193:5370–5378. doi: 10.4049/jimmunol.1401849. [DOI] [PMC free article] [PubMed] [Google Scholar]
- Street K., Risso D., Fletcher R.B., Das D., Ngai J., Yosef N., Purdom E., Dudoit S. Slingshot: cell lineage and pseudotime inference for single-cell transcriptomics. BMC Genomics. 2018;19:477. doi: 10.1186/s12864-018-4772-0. [DOI] [PMC free article] [PubMed] [Google Scholar]
- Tabula Muris Consortium. Overall coordination. Logistical coordination. Organ collection and processing. Library preparation and sequencing. Computational data analysis. Cell type annotation. Writing group. Supplemental text writing group. Principal investigators Single-cell transcriptomics of 20 mouse organs creates a Tabula Muris. Nature. 2018;562:367–372. doi: 10.1038/s41586-018-0590-4. [DOI] [PMC free article] [PubMed] [Google Scholar]
- Tenenbaum J.B., de Silva V., Langford J.C. A global geometric framework for nonlinear dimensionality reduction. Science. 2000;290:2319–2323. doi: 10.1126/science.290.5500.2319. [DOI] [PubMed] [Google Scholar]
- Tetteh P.W., Basak O., Farin H.F., Wiebrands K., Kretzschmar K., Begthel H., van den Born M., Korving J., de Sauvage F., van Es J.H. Replacement of lost lgr5-positive stem cells through plasticity of their enterocyte-lineage daughters. Cell Stem Cell. 2016;18:203–213. doi: 10.1016/j.stem.2016.01.001. [DOI] [PubMed] [Google Scholar]
- van der Flier L.G., Haegebarth A., Stange D.E., van de Wetering M., Clevers H. OLFM4 is a robust marker for stem cells in human intestine and marks a subset of colorectal cancer cells. Gastroenterology. 2009;137:15–17. doi: 10.1053/j.gastro.2009.05.035. [DOI] [PubMed] [Google Scholar]
- van der Flier L.G., van Gijn M.E., Hatzis P., Kujala P., Haegebarth A., Stange D.E., Begthel H., van den Born M., Guryev V., Oving I. Transcription factor Achaete scute-like 2 controls intestinal stem cell fate. Cell. 2009;136:903–912. doi: 10.1016/j.cell.2009.01.031. [DOI] [PubMed] [Google Scholar]
- van Es J.H., Sato T., van de Wetering M., Lyubimova A., Nee A., Gregorieff A., Sasaki N., Zeinstra L., van den Born M., Korving J. Dll1+ secretory progenitor cells revert to stem cells upon crypt damage. Nat. Cell Biol. 2012;14:1099. doi: 10.1038/ncb2581. [DOI] [PMC free article] [PubMed] [Google Scholar]
- Wurbel M., Malissen B., Campbell J.J. Complex regulation of CCR9 at multiple discrete stages of T cell development. Eur. J. Immunol. 2006;36:73–81. doi: 10.1002/eji.200535203. [DOI] [PubMed] [Google Scholar]
- Yan K.S., Gevaert O., Zheng G., Anchang B., Probert C.S., Larkin K.A., Davies P.S., Cheng Z., Kaddis J.S., Han A. Intestinal enteroendocrine lineage cells possess homeostatic and injury-inducible stem cell activity. Cell Stem Cell. 2017;21:78–90.e6. doi: 10.1016/j.stem.2017.06.014. [DOI] [PMC free article] [PubMed] [Google Scholar]
- Yen C.-L., Nelson D.W., Yen M.-I. Intestinal triacylglycerol synthesis in fat absorption and systemic energy metabolism. J. Lipid Res. 2014;56 doi: 10.1194/jlr.R052902. [DOI] [PMC free article] [PubMed] [Google Scholar]
- Zhu L., Gibson P., Currle S.D., Tong Y., Richardson R.J., Bayazitov I.T., Poppleton H., Zakharenko S., Ellison D.W., Gilbertson R.J. Prominin 1 marks intestinal stem cells that are susceptible to neoplastic transformation. Nature. 2009;457:603–607. doi: 10.1038/nature07589. [DOI] [PMC free article] [PubMed] [Google Scholar]
Associated Data
This section collects any data citations, data availability statements, or supplementary materials included in this article.
Supplementary Materials
Rotation of the 3D imbedding facilitates visualization of naive B cell trunk, germinal center, memory B cell and plasmablast populations and their relationships, and the position of intermediate populations. Naive blood and tonsil B cells and memory IgA and IgG B cell pools exchange between blood and tonsil, and are intermixed in the projection. In contrast, developing plasmablasts mature in the tonsil and migrate into the blood: alignment in trajectory space links terminal tonsil plasmablast development directly to their blood counterparts.
Data Availability Statement
This manuscript is accompanied with Supplemental items. Code and data are available upon request.
Previously published dataset of intestinal cell populations was provided by the authors as normalized and scaled expression values (Yan et al., 2017). C. elegans dataset (86,024 cells) was downloaded from Gene Expression Omnibus (www.ncbi.nlm.nih.gov/geo) under accession code GSE126954.
tSpace package for R is available on https://github.com/hylasD/tSpace, and MATLAB https://github.com/hylasD/MATLAB_version_tSpace. tSpace tutorial can be found at http://denisdermadi.com/tspace-trajectory-inference-algorithm.