Abstract
Bile acids (BAs) serve multiple biological functions, ranging from the absorption of lipids and fat-soluble vitamins to serving as signaling molecules through the direct activation of dedicated cellular receptors. Synthesized by both host and microbial pathways, BAs are increasingly understood as participating in the regulation of numerous pathways relevant to metabolic diseases, including lipid and glucose metabolism, energy expenditure, and inflammation. Quantitative analyses of BAs in biological matrices can be problematic due to their unusual and diverse physicochemical properties, making optimization of a method that shows good accuracy, precision, efficiency of extraction, and minimized matrix effects across structurally distinct human and murine BAs challenging. Herein we develop and clinically validate a stable-isotope-dilution LC/MS/MS method for the quantitative analysis of numerous primary and secondary BAs in both human and mouse biological matrices. We also utilize this tool to investigate gut microbiota participation in the generation of structurally specific BAs in both humans and mice. We examine circulating levels of specific BAs and in a clinical case-control study of age- and gender-matched type 2 diabetes mellitus (T2DM) versus nondiabetics. BAs whose circulating levels are associated with T2DM include numerous 12α-hydroxyl BAs (taurocholic acid, taurodeoxycholic acid, glycodeoxycholic acid, deoxycholic acid, and 3-ketodeoxycholic acid), while taurohyodeoxycholic acid was negatively associated with diabetes. The LC/MS/MS-based platform described should serve as a robust, high-throughput investigative tool for studying the potential involvement of structurally specific BAs and the gut microbiome on both physiological and disease processes.
Keywords: steroids, liquid chromatography, diabetes
Primary bile acids (BAs) are amphipathic steroids synthesized by the host in the liver during the catabolism of cholesterol. The synthesis of primary BAs starts with 7α-hydroxylation of cholesterol catalyzed by cholesterol 7α-hydroxylase followed by pathways involving at least 16 different enzymes that include sterol-ring modifications and side-chain oxidation and shortening (1, 2). The terminal step includes the conjugation of either glycine, predominantly in humans, or taurine, in rodents, to the terminal carboxylic group (1, 2). Conjugated BAs or bile salts are stored in the gallbladder, and after each meal bile salts are secreted with the bile into the intestine, where they are further modified by gut microbial enzymes. The modifications [deconjugation, oxidation reduction, epimerization, and dehydroxylation (3, 4)] generate a diverse class of BAs called secondary BAs. Primary and secondary BAs are reabsorbed through the enterohepatic circulation and further metabolized in hepatocytes mostly by amidation, but they can also undergo hydroxylation and sulfonation (1, 2), which further increases the chemical diversity of the BA pool. In addition to the differences in conjugation, primary BAs differ structurally among vertebrate species; for example, cholic acid and chenodeoxycholic acid are primary BAs found in humans, whereas α-muricholic acid and β-muricholic are found in rodents as well.
In addition to their role in the intestinal absorption of fat and fat-soluble vitamins, BAs are recognized as signaling molecules through the direct activation of various cellular receptors such as the nuclear receptor FXR and the membrane receptor Takeda G protein-coupled receptor 5 (5–10). Both receptors play a role in the regulation of glucose and lipid metabolism, and mice lacking either or both receptors have differential susceptibility to obesity, diabetes, and atherosclerosis in a highly diet-specific manner (8, 11–19). Given their key roles in intestinal lipid absorption and signaling relevant to cardiometabolic disease, manipulating BA levels has long been pursued as an attractive therapeutic strategy. For instance, BA sequestrants can serve as effective drugs for the treatment of hyperlipidemia (5, 20). More recently, a synthetic BA analogue, obeticholic acid (Ocaliva), was approved for use in patients suffering from advanced liver diseases (21, 22). This recent high-profile BA-related therapeutic success has resulted in a renaissance in the field of BA research. This resurgence in the drug discovery area has prompted the development of robust and rapid analytical methods for the quantification of primary and secondary BAs with high accuracy and precision. However, the chemical uniformity of BAs (numerous isomeric and isobaric compounds), wide concentration range (nM to mM), and high carryover due to their hydrophobic nature make the development of such methods challenging. The use of LC/MS/MS for the quantification of BAs has increased in the last decade, and several methods have been developed and published to date (23–32). Most of these methods focus on a frequently used, somewhat truncated subset of BAs (23–25, 27, 29–31) and have not comprehensively explored the impact of gut microbiota on BA levels. Further, while other methods may have included some noncommercially available BAs, they have either shown variable attention to key issues relevant to quantification, such as the use of calibration curves prepared in a biological matrix, minimization of carryover, and assessment of freeze/thaw stability (26, 28), or included time-, supply-, and labor-intensive enzymatic digestion steps (32).
Herein we present the development and validation of a quantification method for analyzing more than 50 primary and secondary BAs in human and mouse serum/plasma and feces to serve as a comprehensive metabolomics tool for studying the relationships between individual BAs and metabolic disorders. We first utilized the new method to investigate the role of gut microbes on systemic levels of BAs in humans and mice. To further illustrate its potential utility, we then used the BA panel to identify candidate BA metabolites whose circulating levels are associated with diabetes.
MATERIALS AND METHODS
Reagents and chemicals
All organic solvents and mobile phases were prepared using LC/MS-grade chemicals and were purchased from Thermo Fisher Scientific (Waltham, MA) unless otherwise noted. Human serum (double charcoal stripped and dilapidated) was purchased from Golden West Biologicals Inc. (Temecula, CA). Water was obtained from an in-house Millipore Milli-Q purification system with an LC-Pak Polisher filter for ultrapure water for UHPLC and LC/MS (Darmstadt, Germany). 5-Cholenic acid-3β-ol, ursocholic acid, and taurolithocholic acid were purchased from Toronto Research Chemicals (Toronto, Canada); lithocholic acid 3-sulfate was purchased from Santa Cruz Biotechnology (Santa Cruz, CA); and the remaining BA standards were purchased from Steraloids (Newport, RI). Internal standards (ISs) 2,2,4,4-D4-lithocholic acid (99.4% D4), 2,2,4,4-D4-deoxycholic acid (99% D4), 2,2,4,4-D4-cholic acid (99.4% D4), 2,2,4,4-D4-glycolithocholic acid (99.8% D4), 2,2,4,4-D4-glycoursodeoxycholic acid (99.8% D4), 2,2,4,4-D4-glycochenodeoxycholic acid (98.4% D4), and 2,2,4,4-D4-glycocholic acid (99.6% D4) were purchased from CDN isotopes (Quebec, Canada); 2,2,4,4-D4-chenodeoxycholic acid (99.5% D4), 2,2,4,4-D4-glycodeoxycholic acid (99.74% D4), 2,2,4,4-D4-taurolithocholic acid (99.5% D4), 2,2,4,4-D4-tauroursodeoxycholic acid (99.88% D4), 2,2,4,4-D4-taurochenodeoxycholic acid (99.5% D4), 2,2,4,4-D4-taurodeoxycholic acid (99.33% D4), and 2,2,4,4-D4-taurocholic acid (99.5% D4) were purchased from Iso Sciences (Ambler, PA).
Research subjects
All subjects gave written informed consent. All study protocols abided by the Declaration of Helsinki principles and were approved by the Institutional Review Board of the Cleveland Clinic. Gut microbial metabolite levels were suppressed under the approved protocol registered at ClinicalTrials.gov (NCT01731236).
Samples for establishing a normal range of analytes were collected from nonfasting subjects undergoing community health screens. From these, a random subset (n = 20) of subjects was selected who had no medical history of metabolic diseases, normal vital signs, no medications or supplement use reported, and no abnormal renal, liver, or metabolic test values on screening laboratory panels (lipid profile, complete metabolic panel). For analyses of BAs in subjects with type 2 diabetes mellitus (T2DM), a case-control design was used (80 cases and 80 controls) in which subjects with T2DM versus age- and gender-matched non-T2DM subjects were examined. Fasting plasma samples and associated clinical data were collected.
To examine the participation of the gut microbiome on systemic levels of BAs in subjects, healthy volunteers (n = 15) were subjected to a cocktail of antibiotics for 7 days, as previously described (33). Volunteers participating were excluded if they were taking medications, supplements, or probiotics or if they were pregnant. Blood was collected after overnight fasting at three different time points as outlined below: baseline [before antibiotic treatment (pre-Abx), after the 7 day antibiotic regimen (Abx), and ≥3 weeks after antibiotic washout to permit the repopulation of gut microorganisms (post-Abx)]. Three subjects did not have blood collected following microbial repopulation (i.e., the third visit) for various reasons, including beginning a medication, moving out of town, or desire to discontinue the study.
Animal studies
All animal studies were under protocols approved by the Cleveland Clinic Institutional Animal Care and Use Committee. BA normal-range samples were collected from 10–12-week-old male (n = 20) and female (n = 20) C57BL/6J mice fed a standard chow diet in conventional housing. Whole blood was collected via saphenous vein (survival collection) into heparin-treated capillaries. The impact of the gut microbiome on BA levels was studied in 8–10-week-old C57BL/6J mice in two separate experiments that included a total of 25 males and 30 females. Following baseline blood draw, mice were treated with a cocktail of antibiotics (provided in drinking water) previously shown to suppress gut microbiota (34) for 5 days, with the cages changed every day. A second blood collection was performed at the end of antibiotic treatment. A third blood collection was done 1 week after the recolonization of gut microbiota by switching to water without antibiotics, along with the addition of fecal pellets to the cages from conventionally raised mice of the same age, diet, and gender that were never treated with antibiotics. To examine gender differences, blood was collected from male (n = 15) and female (n = 15) C57BL/6J mice of the same age, previously shipped from the same vendor at the same time, and maintained within the vivarium on the same standard chow diet prior to use. In additional studies, C57BL/6 germ-free mice, initially obtained from Taconic Bioscience (Rensselaer, NY), were bred in positive-pressure gnotobiotic isolators (Class Biologically Clean, Madison, WI) at the Cleveland Clinic Gnotobiotic facility and moved to sealed positive-pressure caging (Allentown, NJ) for procedures including venous blood draw in a biosafety hood.
Standard and internal standard solutions
All BA stock and working standards, including the stable-isotope-labeled ISs, were prepared in methanol. An IS master solution was prepared in methanol, aliquoted, and stored at −20°C until use (IS composition: 10 µM each of D4-glycolithocholic acid, D4-glycoursodeoxycholic acid, D4-glycodeoxycholic acid, D4-glycocholic acid, D4-taurolithocholic acid, D4-tauroursodeoxycholic acid, D4-taurochenodeoxycholic acid, D4-taurodeoxycholic acid, and D4-taurocholic acid; 20 µM each of D4-lithocholic acid, D4-chenodeoxycholic acid, D4-deoxycholic acid, and D4-cholic acid; and 40 µM D4-glycochenodeoxycholic acid). IS working solutions 1 and 2 were prepared fresh before the addition to samples by dilution of the IS master solution 100-fold and 10-fold in ice-cold methanol, respectively. Control studies showed no significant decay (>95% recovery of all analytes) with authentic synthetic standards and the IS master solution when stored at −20°C for 1 year.
Sample preparation
Serum samples were stored at −80°C until use. After thawing at 4°C, an aliquot (20 µl) was mixed with ice-cold methanolic IS working solution 1 (80 µl). Samples were vortexed for 10 min and centrifuged at 14,000 g for 20 min at 4°C. The supernatant was transferred to glass HPLC vials with microinserts and subjected to further analysis.
Feces pellets were store at −80°C until use. Half of a mouse fecal pellet was dried in a speed vacuum (Thermo Fisher Scientific) overnight, weighed, and placed in an Eppendorf tube. Ultrapure water was added to the dry pellet (150 µl) and vortexed (5 min) followed by the addition of methanol (500 µl) with additional vortexing (5 min). Fecal extracts were centrifuged at 14,000 g for 20 min at 4°C, and the supernatant was transferred into a clean O-ring tube; 80 µl of the supernatant was used for the analysis, and the rest was stored at −80°C. An aliquot of fecal extract (80 µl) was mixed with ice-cold methanolic IS working solution 2 (20 µl) and transferred to glass HPLC vials with microinserts and subjected to further analysis.
LC/MS/MS conditions
LC/MS/MS analysis was performed using 4000 Q-Trap triple quadrupole tandem mass spectrometer (AB SCIEX) equipped with an electrospray ionization source operating in negative ion mode. Mass spectrometry parameters were as follows: ions spray voltage -4200 V, ion source heater temperature 500°C, source gas 1: 35 psi, source gas 2: 45 psi, and curtain gas 35 psi. Nitrogen gas was used for the nebulizer, curtain and collision gas. The collision energies and declustering potentials were set to give optimal signal response from the direct infusion of a dilute solution of each standard in aqueous methanol. Analyses were performed using electrospray ionization in negative-ion mode with multiple reaction monitoring (MRM) of precursor and characteristic product ions specific for each monitored BA.
The HPLC system consisted of four binary pumps (LC-20 AD), autosampler operating at 10°C (Nexera X2 SIL-30AC), controller (CBM-20A) (Shimadzu Scientific Instruments, Inc.,) and a dual column switching valve system Rheodyne (IDEX Health and Science, Middleboro, MA). Chromatographic separations were performed on a reverse phase column (Kinetix C18, 2.6 µm, 150 mm × 4.6 mm ID; Phenomenex, Torrance, CA). Mobile phase A was 1 mM ammonium acetate and 0.1% acetic acid in methanol:acetonitrile:water (1:1:3; v/v/v) and mobile phase B was 0.1% acetic acid in methanol:acetonitrile:2-propanol (4.5:4.5:1; v/v/v). Samples were injected (10 µl) onto columns equilibrated in 100% A, and separated using a gradient as follows: 0–2 min 0% B; 2–20 min 0–100% B; 20–28.5 min 100% B. Flow rate was programmed as follows: 0.3 ml/min from 0 to 20 min, and 0.5 ml/min from 20 to 28 min. Samples are introduced to the mass spec for analysis from 9 to 28 min. To eliminate carry over, an extensive washing step alternating between mobile phase A and B was added at the end of each run as follows: 100% A from 28 to 35 min, then directly switched to 100% B from 36 to 46 min, and equilibration step of 100% A from 46 to 60 min. To increase sample throughput 2-fold, a dual chromatographic system was used. At 28 min of the gradient on the first column, the next sample was injected into a second column; thus, during the first column washing and equilibration, the second column is used for BAs separation and diversion to the mass spectrometer for analysis.
Linearity, limit of detection, limit of quantification, matrix effect, freeze/thaw stability, and recovery
The spike-and-recovery approach was used to generate calibration curves. BA mixtures from at least seven different concentrations ranging from 6 to 3,000 nM and 75 to 4,000 nM were prepared for BA analysis in plasma and feces, respectively. Feces BA content was normalized to feces dry weight and reported in nmol/g. All samples that had one or more analytes with concentrations above the calibration curve range were diluted and rerun. For routine analyses, to minimize matrix effects on the various BAs, calibration curves for BA analysis in plasma were always prepared using charcoal stripped serum (as outlined under Results) and processed and analyzed as described above, while calibration curves for BA analysis in feces were prepared in methanol. Calibration curves were built by fitting each analyte concentration to the analyte/IS peak area ratios. The LOD was defined as the lowest concentration of analyte in a sample matrix (e.g., serum) that generated a signal-to-noise ratio of ≥3. The LOQ was defined as the lowest concentration of analyte in a sample matrix that generated a signal-to-noise ratio of ≥10.
The matrix effect in serum was determined by preparing six calibration curves in six different serum pools and comparing their slopes to the average slope of six calibration curves prepared in either dialyzed plasma, synthetic plasma [albumin dissolved in normal saline (4 g/dl)], double charcoal stripped and delipidated human plasma, or methanol. Percentage matrix effect (% ME) was calculated using the following formula: % ME = (average slope of serum pool calibration curve/average slope of matrix matched calibration curve) × 100. The matrix effect in mice feces was determined by preparing three calibration curves in three different mice feces pools and comparing their slopes to the average slope of three calibration curves prepared in methanol. Percentage matrix effect (% ME) was calculated using the following formula: % ME = (average slope of serum pool calibration curve/average slope of matrix matched calibration curve) × 100.
Freeze/thaw stability was determined by comparing the concentrations of BAs in a fresh serum sample with the same sample aliquots that went through the indicated number of freeze/thaw cycles. A fresh serum sample was divided into four equal aliquots and frozen at −80°C for at least 12 h. The four aliquots were thawed, and an aliquot was taken for analysis. This cycle was repeated five times. Percentage stability (% ST) was calculated according to the following formula: % ST = (Ct/C0) × 100, where C0 is the concentration of BAs in the fresh serum sample and Ct is the concentration after the indicated (t) freeze/thaw cycle. Recovery was tested by comparing the area of deuterated standards added to pooled human serum (mix of ≥10 equal serum aliquots from healthy normal subjects) with that of methanol and calculated according to the following formula: % recovery = (average area spiked in serum pool/average area spiked in methanol) × 100.
Precision and accuracy and quality control samples
Interday precision and intraday precision were performed on three different quality control (QC) samples. QCs were prepared by pooling different human serums and, if needed, spiking the pools with different amounts of synthetic BAs. The precision of quantification was measured as the intraday and interday coefficients of variation. The intraday precision was determined by injecting six analytical replicates of three QCs in a single day. The interday precision was determined by analyzing three levels of plasma QC samples across six runs on six separate days. Accuracy was determined by a standard addition method for the three QC levels in triplicate (accepted concentration) and compared with values from six analytical replicates of the three QCs analyzed using the methods calibration curve in a single day for intraday accuracy and for six different days for interday accuracy (experimental concentration). Accuracy was calculated as percentage accuracy according to the following formula: % accuracy = ((accepted concentration − experimental concentration)/accepted concentration) × 100. At least three different QC samples were included with each batch of LC/MS/MS samples (beginning, middle, and end) to monitor assay performance.
Mice feces analyses, including interday and intraday precision studies, were always performed with three different QC samples, prepared by pooling >20 different mice feces. The precision of quantification was measured as the intraday and interday coefficients of variation. The intraday precision was determined by injecting six analytical replicates of three QCs in a single day. The interday precision was determined by analyzing three levels of feces QC samples across six runs on six separate days. Accuracy was determined by a standard addition method for the three QC levels (accepted concentration) and compared with values from six analytical replicates of the three QCs analyzed using the methods calibration curve in a single day for intraday accuracy and in six different days for interday accuracy (experimental concentration). Accuracy was calculated as percentage accuracy according to the following formula: % accuracy = ((accepted concentration − experimental concentration)/accepted concentration) × 100. At least three different QC samples were included with each batch of LC/MS/MS samples (beginning, middle, and end) to monitor assay performance.
Statistical analysis
Spearman correlations between BA concentrations and clinical phenotypes and odds ratios (ORs) and 95% CIs were calculated using R version 3.4.4 for Windows with in-house developed scripts. Risk for T2DM was calculated using diabetes as the dependent variable and serum concentrations of different BAs as the independent variable. The Kruskal-Wallis test was used to calculate the significance of microbiota suppression on individual BAs, the Wilcoxon rank-sum test was used for continuous data, and Pearson’s Chi-square test was used for categorical factors. P < 0.05 was considered statistically significant.
RESULTS
Optimization of the LC/MS/MS conditions
To avoid discrepancies in BAs nomenclature in the literature, we provide in supplemental Table 1 all BA common names used in this article, along with their systematic names, InChIKey, chemical formulas, and structures.
ESI/MS conditions were optimized by directly injecting each BA prepared in 50:50 acetonitrile-water in a constant stream of mobile phases into the mass spectrometer in negative and positive ion mode. Effects of different mobile phases on BA ionization, fragmentation, column retention, and yields were tested as outlined under Materials and Methods. For the negative ion mode 0.1% acetic or formic acid was used as an additive in the mobile phase. In the positive ion mode, MS parameter optimization was done on BAs as ammonium adducts in the presence of 10 mM ammonium acetate plus 0.1% acetic acid in the mobile phase. Free BA fragmentation in the negative ion mode generated fragments with very low yields, making the classic parent/daughter multiple reaction monitoring (MRM) approach unsuitable. Using parent/parent as the MRM transitions, on the other hand, resulted in signals with good yield. In the positive ion mode, fragments for the ammonium adducts of free BAs could be generated, but the overall yield was lower than in the negative ion mode. MS parameters for conjugated BAs were then optimized in the negative ion mode, and taurine-, glycine-, and sulfo-conjugated BA fragments with an m/z of 80.0, 74.0, and 94.0, respectively, were used. The final selected optimized LC/MS/MS conditions used for each BA are given in Table 1, which also lists the MRM transitions of all BAs and ISs used, along with compound-specific MS parameters.
TABLE 1.
HPLC RT and MS conditions for 60 BAs (39 unconjugated, 9 conjugated with glycine, 1 sulfated, and 11 conjugated with taurine)
| BA Number | BA Name | Abbreviation | RT (min) | Q1 | Q3 | DP (V) | CE (eV) | ISs |
| m/z | ||||||||
| 1 | Ursocholanic acid | 18.3 | 359.3 | 359.3 | −150 | −10 | D4-CA | |
| 2 | 5-Cholenic acid-3β-ol | 5-CholA | 12.9 | 373.3 | 373.3 | −150 | −10 | D4-CA |
| 3 | Lithocholenic acid | 13.1 | 373.3 | 373.3 | −150 | −10 | D4-CA | |
| 4 | Dehydrolithocholic acid | Dehydro-LCA | 13.4 | 373.3 | 373.3 | −150 | −10 | D4-CA |
| 5 | Isolithocholic acid | Iso-LCA | 13.2 | 375.3 | 375.3 | −150 | −10 | D4-LCA |
| 6 | Lithocholic acid | LCA | 13.6 | 375.3 | 375.3 | −150 | −10 | D4-LCA |
| 7 | 23-Nordeoxycholic acid | 23-Nor-DCA | 11.7 | 377.3 | 377.3 | −150 | −10 | D4-CA |
| 8 | 9(11),(5β)-Cholenic acid-3α-ol-12-one | 10.0 | 387.3 | 387.3 | −150 | −10 | D4-CA | |
| 9 | 3,12-Diketocholanic acid | 3,12-Diketo-CA | 10.2 | 387.3 | 387.3 | −150 | −10 | D4-CA |
| 10 | 3,7-Diketocholanic acid | 3,7-Diketo-CA | 10.1 | 387.3 | 387.3 | −150 | −10 | D4-CA |
| 11 | 3,6-Diketocholanic acid | 3,6-Diketo-CA | 10.1 | 387.3 | 387.3 | −150 | −10 | D4-CA |
| 12 | 5α-Cholanic acid-3,6-dione | 10.1 | 387.3 | 387.3 | −150 | −10 | D4-CA | |
| 13 | 6-Ketolithocholic acid | 6-Keto-LCA | 10.0 | 389.3 | 389.3 | −160 | −10 | D4-CA |
| 14 | 7-Ketolithocholic acid | 7-Keto-LCA | 10.4 | 389.3 | 389.3 | −160 | −10 | D4-CA |
| 15 | 5α-Cholanic acid-3α-ol-6-one | 10.5 | 389.3 | 389.3 | −160 | −10 | D4-CA | |
| 16 | 12-Ketolithocholic acid | 12-Keto-LCA | 10.7 | 389.3 | 389.3 | −160 | −10 | D4-CA |
| 17 | Apocholic acid | Apo-CA | 11.8 | 389.3 | 389.3 | −160 | −10 | D4-CA |
| 18 | 3-Ketodeoxycholic acid | 3-Keto-DCA | 12.0 | 389.3 | 389.3 | −160 | −10 | D4-CA |
| 19 | 3-Ketochenodeoxycholic acid | 3-Keto-CDCA | 12.0 | 389.3 | 389.3 | −160 | −10 | D4-CA |
| 20 | Murideoxycholic acid | MDCA | 9.0 | 391.3 | 391.3 | −150 | −10 | D4-DCA |
| 21 | Ursodeoxycholic acid | UDCA | 9.7 | 391.3 | 391.3 | −150 | −10 | D4-DCA |
| 22 | Hyodeoxycholic acid | HDCA | 10.3 | 391.3 | 391.3 | −150 | −10 | D4-CDCA |
| 23 | 5β-Cholanic acid-3β,12α-diol | 5β-ChoA | 10.9 | 391.3 | 391.3 | −150 | −10 | D4-CDCA |
| 24 | Chenodeoxycholic acid | CDCA | 12.4 | 391.3 | 391.3 | −150 | −10 | D4-CDCA |
| 25 | Deoxycholic acid | DCA | 12.5 | 391.3 | 391.3 | −150 | −10 | D4-DCA |
| 26 | 7α,12α-Dihydroxy-5β-cholan-24-oic acid | 13.0 | 391.3 | 391.3 | −150 | −10 | D4-DCA | |
| 27 | Dehydrocholic acid | Dehydro-CA | 5.8 | 401.3 | 401.3 | −140 | −10 | D4-CA |
| 28 | 7,12-Diketolithocholic acid | 7,12-Diketo-LCA | 5.9 | 403.3 | 403.3 | −150 | −10 | D4-CA |
| 29 | 6,7-Diketolithocholic acid | 6,7-Diketo-LCA | 10.4 | 403.3 | 403.3 | −150 | −10 | D4-CA |
| 30 | 12-Ketochenodeoxycholic acid | 12-Keto-CDCA | 7.7 | 405.3 | 405.3 | −160 | −10 | D4-CA |
| 31 | 7-Ketodeoxycholic acid | 7-Keto-DCA | 8.0 | 405.3 | 405.3 | −160 | −10 | D4-CA |
| 32 | Takeda ketol | TK | 8.4 | 405.3 | 405.3 | −160 | −10 | D4-CA |
| 33 | 3-Dehydrocholic acid | 3-Dehydro-CA | 9.4 | 405.3 | 405.3 | −160 | −10 | D4-CA |
| 34 | Ursocholic acid | UCA | 6.6 | 407.3 | 407.3 | −155 | −10 | D4-CA |
| 35 | α-Muricholic acid | α-MCA | 8.0 | 407.3 | 407.3 | −155 | −10 | D4-CA |
| 36 | ω-Muricholic acid | ω-MCA | 8.0 | 407.3 | 407.3 | −155 | −10 | D4-CA |
| 37 | β-Muricholic acid | β-MCA | 8.5 | 407.3 | 407.3 | −155 | −10 | D4-CA |
| 38 | Hyocholic acid | HCA | 9.6 | 407.3 | 407.3 | −155 | −10 | D4-CA |
| 39 | Cholic acid | CA | 10.6 | 407.3 | 407.3 | −155 | −10 | D4-CA |
| 40 | Glycoursocholanic acid | GUCA | 16.1 | 416.3 | 74.0 | −130 | −63 | D4-GCA |
| 41 | Glycolithocholic acid | GLCA | 12.4 | 432.3 | 74.0 | −120 | −65 | D4-GLCA |
| 42 | Glycoursodeoxycholic acid | GUDCA | 7.0 | 448.3 | 74.0 | −130 | −75 | D4-GUDCA |
| 43 | Glycohyodeoxycholic acid | GHDCA | 7.4 | 448.3 | 74.0 | −130 | −75 | D4-GUDCA |
| 44 | Glycochenodeoxycholic acid | GCDCA | 10.4 | 448.3 | 74.0 | −130 | −75 | D4-GCDCA |
| 45 | Glycodeoxycholic acid | GDCA | 10.9 | 448.3 | 74.0 | −130 | −75 | D4-GDCA |
| 46 | Lithocholic acid 3-sulfate | LCA 3-sulfate | 11.8 | 455.3 | 97.0 | −140 | −92 | D4-TLCA |
| 47 | Glycodehydrocholic acid | GDHCA | 3.0 | 458.3 | 74.0 | −120 | −64 | D4-GCA |
| 48 | Glycohyocholic acid | GHCA | 6.7 | 464.3 | 74.0 | −140 | −76 | D4-GCA |
| 49 | Glycocholic acid | GCA | 8.2 | 464.3 | 74.0 | −140 | −76 | D4-GCA |
| 50 | Taurolithocholic acid | TLCA | 11.9 | 482.3 | 80.0 | −160 | −120 | D4-TLCA |
| 51 | Tauroursodeoxycholic acid | TUDCA | 5.8 | 498.3 | 80.0 | −160 | −120 | D4-TUDCA |
| 52 | Taurohyodeoxycholic acid | THDCA | 6.1 | 498.3 | 80.0 | −160 | −120 | D4-TUDCA |
| 53 | Taurochenodeoxycholic acid | TCDCA | 9.2 | 498.3 | 80.0 | −160 | −120 | D4-TCDCA |
| 54 | Taurodeoxycholic acid | TDCA | 9.9 | 498.3 | 80.0 | −160 | −120 | D4-TDCA |
| 55 | Taurodehydrocholic acid | TDHCA | 1.8 | 508.3 | 80.0 | −170 | −120 | D4-TCA |
| 56 | Tauro-α-muricholic acid | T-α-MCA | 3.7 | 514.3 | 80.0 | −170 | −120 | D4-TCA |
| 57 | Tauro-ω-muricholic acid | T-ω-MCA | 3.7 | 514.3 | 80.0 | −170 | −120 | D4-TCA |
| 58 | Tauro-β-muricholic acid | T-β-MCA | 4.0 | 514.3 | 80.0 | −170 | −120 | D4-TCA |
| 59 | Taurohyocholic acid | THCA | 5.3 | 514.3 | 80.0 | −170 | −120 | D4-TCA |
| 60 | Taurocholic acid | TCA | 7.1 | 514.3 | 80.0 | −170 | −120 | D4-TCA |
MS optimizing conditions for the 60 BAs, RT, and ISs used for quantification. CE, collision energy; DP, declustering potential; Q1, precursor ion; Q3, product ion.
For the chromatographic separation of the BAs, several reversed-phase chromatographic column matrices and conditions were tested. Phenomenex Aeris peptide XB C18 (3.6 µm; 150 × 2.1 mm ID), Kinetix C18 (2.6 µm; 50 × 2.1 mm ID), and Kinetix C18 (2.6 µm; 150 × 4.6 mm ID) with several combinations of organic solvents (acetonitrile, methanol, and 2-propanol) were tested in different gradient conditions. The best chromatographic separation was established using Phenomenex Kinetix C18 (2.6 µm; 150 × 4.6 mm ID). Multiple volatile acids were tried as mobile-phase additives, and the use of acetic acid in the mobile phase (0.1%) gave the best sensitivity for BA analyses (e.g., compared with formic acid with and without ammonium formate). While the addition of ammonium acetate (1 mM final concentration) decreased the intensity of conjugated BAs between 20% and 40%, it enhanced the intensity of lithochoic acid and isolithocholic acid by 50% and was judged essential for retaining taurine-conjugated BAs on the selected column. Most methods for BA analysis suffer from the carryover due to their hydrophobicity. We observed adding 2-propanol (10%) to the mobile phase B in addition to the extensive washing step with quick alternations between 100% mobile phases A versus B, as outlined under Materials and Methods, eliminated the carryover for each of the BAs monitored. This represents an alternative and efficient way of removing the carryover when multiple washing bottles for rinsing injection needles are not available (28). To increase the throughput time, a dual chromatographic system with column switching was set up as outlined under Materials and Methods.
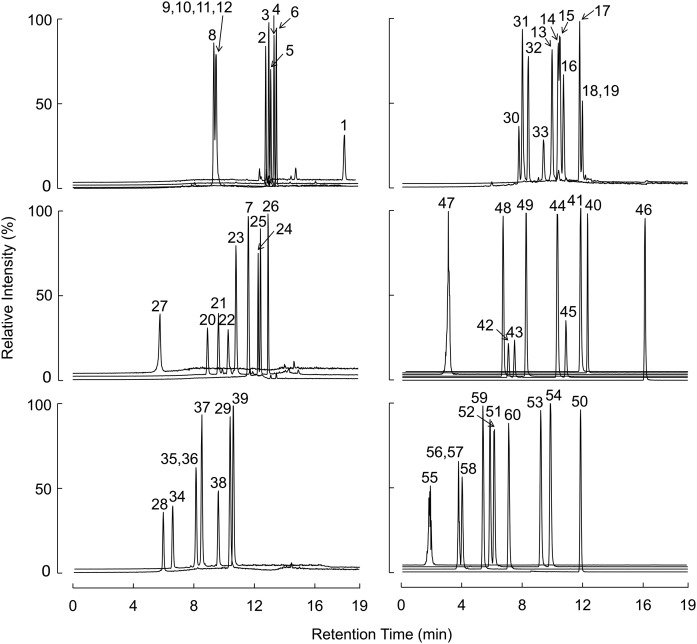
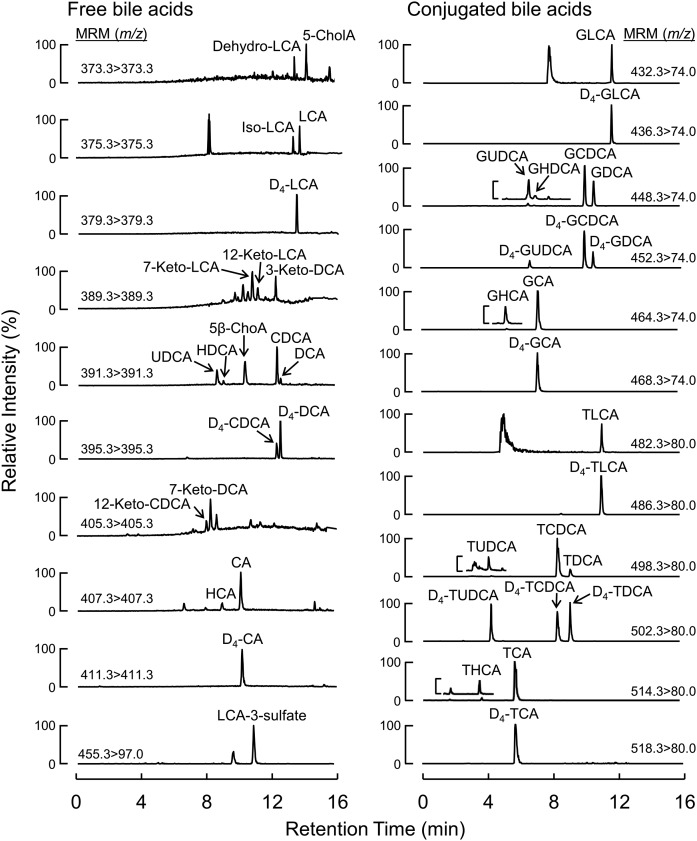
By using the described conditions, all tested BAs with the same MRM transitions were chromatographically separated except for those indicated below. BAs that were cochromatographed included 3,12-diketocholanic acid; 3,7-diketocholanic acid; 3,6-diketocholanic acid and 5α-cholanic acid-3,6-dione, which elute at the same retention time (RT; Fig. 1; BAs 9–12, 10.2 min); 3-ketodeoxycholic acid and 3-ketochenodeoxycholic acid, which coelute at 12.0 min (Fig. 1; BAs 18 and 19); α-muricholic acid and ω-muricholic acid, which coelute at 8.0 min (Fig. 1; BAs 35 and 36); and their taurine conjugates, which coelute at 3.7 min (Fig. 1; BAs 56 and 57). In addition, baseline separation could not be reached for 7-ketolithocholic acid and 5α-cholanic acid-3α-ol-6-one, which elute at 10.4 and 10.5 min, respectively (Fig. 1; BAs 14 and 15). Illustrative chromatographic separations of BAs in human plasma (Fig. 2) and in mouse plasma (supplemental Fig. 1) are shown, along with their corresponding isotopically labeled ISs.
Fig. 1.
Chromatographic separation of BAs. The panels display free BAs (n = 39; left panels and top-right panel), glycine-conjugated BAs (n = 9) and a sulfated BA (middle-right panel), and taurine-conjugated BAs (n = 11; bottom right). BA names, RT, and MS parameters are given in Table 1.
Fig. 2.
Chromatographic separation of BAs in human plasma with their corresponding isotopically labeled counterparts used as ISs. Reconstructed chromatograms from human plasma samples spiked with stable isotope labeled ISs. Free BAs (left panel); glycine- and taurine-conjugated BAs (right panel).
Method validation
Calibration curve, LOD, LOQ, and matrix effect.
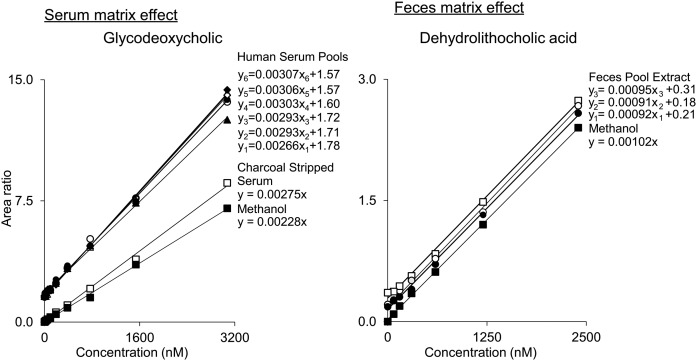
Calibration curve ranges for each BA in serum were prepared to cover the breadth of concentrations both reported in the literature (24) as well as data collected in house from running multiple different human serum samples and serum pools. Thus, 10-point calibration curves were prepared in charcoal stripped serum of all BAs spanning the concentrations from 6 nM to 3,000 nM, with concentrations selected to extend below and with at least one point (preferably more) above the range of observable values for each BA (Fig. 3), as described under Materials and Methods. Calibration curves for BA analysis in feces were prepared in methanol spanning concentrations from 75 nM to 4,000 nM. All calibration curves have a squared correlation coefficient of 0.997 or higher for all BAs (supplemental Tables 2 and 3). The LOD of all BAs included in serum ranged between 0.5 nM and 13.0 nM, and the LOQ ranged between 1.6 nM and 43.2 nM. Individual LODs, LOQs, and the slope for each BA calibration curve are given in supplemental Table 2.
Fig. 3.
Example of solvent (methanol) and matrix-matched calibration curves. Left panel: Calibration standards prepared in charcoal stripped and delipidated serum and methanol were tested against six different human serum pools spiked with known amount of standards. Charcoal stripped plasma showed better matrix match to human serum pools than methanol. Right panel: Calibration standards prepared in methanol were compared with three different mouse feces pool extracts spiked with known amount of standards. Methanol showed good matrix match to mouse feces extract.
To test the matrix effect and optimize the matrix in which calibration curves for the final selected method would be performed, calibration curves were prepared using dialyzed plasma, synthetic plasma (albumin dissolved in 4 g/dl normal saline), double charcoal stripped and delipidated pooled human serum, and methanol. Dialyzed plasma and synthetic plasma showed significant levels of several BAs at the zero-concentration calibration curve point, making these matrices less suitable for routine analyses. Calibration curves prepared in methanol and double charcoal stripped and delipidated human serum were compared with six different human serum pools [see Fig. 3, left panel, for illustrative data for glycodeoxycholic acid (GDCA)]. Serum, at some level, showed an effect on all BAs ±20% compared with charcoal stripped delipidated plasma and ±30% for methanol (supplemental Table 2). Exceptions were ursocholanic acid and lithocholenic acid, for which the average matrix effect (based on the change in slope) was 38% and 36% in the charcoal stripped plasma and 49% and 58% in methanol. A higher matrix effect was also observed for dehydrolithocholic, 7α,12α-dihydroxy-5β-cholan-24-oic, hyocholic, and glycoursocholanic acids when methanol was compared with the double charcoal stripped delipidated serum (supplemental Table 2). Because double charcoal stripped and delipidated human serum showed the best overall matrix match to human serum globally for all BAs tested, it was used to prepare all BA calibration curves for all further analyses.
To test the matrix effect in mice feces, calibration curves were prepared in methanol and compared within three different mice feces pools (Fig. 3, right). Because the feces matrix showed a relatively small effect on all BAs (≤13%) compared with methanol solutions (supplemental Table 3), calibration curves prepared in methanol were used for quantifying BAs in feces.
Accuracy, precision, recovery, and stability.
Intraday and interday precision and accuracy were examined on multiple different QC human pooled serums as outlined under Materials and Methods. In brief, to quantify the precision for each detectable BA in human serum, 36 runs of three different pooled serum QC levels were performed, and relative standard deviation was calculated. Accuracy was similarly examined for each BA molecular species using the method of standard additions to multiple QC pools, as outlined under Materials and Methods. Among all BAs monitored, intraday precision ranged from 3.3% to 5.9% for QC-1, 3.3% to 12.7% for QC-2, and 3.0% to 8.0% for QC-3 (supplemental Table 4). Interday precision was similarly excellent and ranged from 3.7% to 7.4% for QC-1, 4.2% to 17.9% for QC-2, and 4.4% to 9.3% for QC-3 (supplemental Table 5). Intraday accuracy of all the distinct BAs monitored in human serum ranged from 2.5% to 29.3% for QC-1, 0.5% to 13.2% for QC-2, and 0.2% to 13.8% for QC-3 (supplemental Table 4). Interday accuracy ranged from 0.7% to 15.2% for QC-1, 0.2% to 14.4% for QC-2, and 0.9% to 16.8% for QC-3 (supplemental Table 5). Freeze/thaw stability for BAs were tested for up to five freeze/thaw cycles as outlined under Materials and Methods. As shown in supplemental Table 6, under the methods used, there was a minimal effect of sample freeze/thaw on the levels of tested BAs, with recoveries ranging from 82% to 119% after five freeze/thaw cycles. BA recovery was tested as outlined under Materials and Methods for the deuterated BAs under the extraction methods used and ranged from 82% to 115% (supplemental Table 7).
Mice feces intraday and interday precision and accuracy were examined on multiple different QC levels as outlined under Materials and Methods. Among all BAs monitored, intraday precision ranged from 0.8% to 12.9% for QC-1, 0.6% to 9.5% for QC-2, and 0.9% to 8.4% for QC-3 (supplemental Table 8). Interday precision was similarly excellent and ranged from 1.1% to 15.0% for QC-1, 0.8% to 7.0% for QC-2, and 1.0% to 7.7% for QC-3 (supplemental Table 9). Intraday accuracy of all the distinct BAs monitored in human serum ranged from 0.1% to 14.4% for QC-1, 0.6% to 13.5% for QC-2, and 0.2% to 13.8% for QC-3 (supplemental Table 8). Interday accuracy ranged from 1.9% to 16.8% for QC-1, 0.1% to 14.5% for QC-2, and 0.1% to 16.3% for QC-3 (supplemental Table 9).
Normal ranges of BAs in human and mice serum
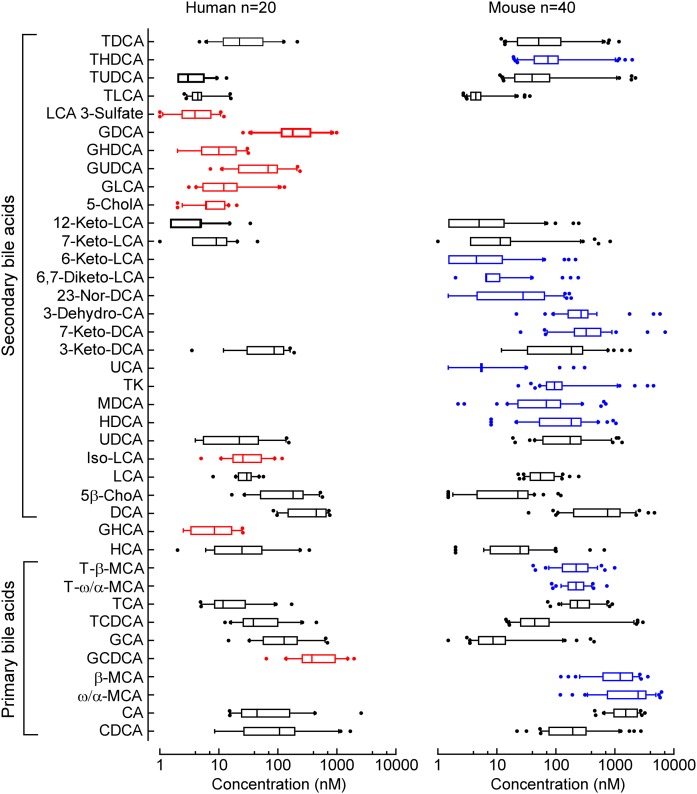
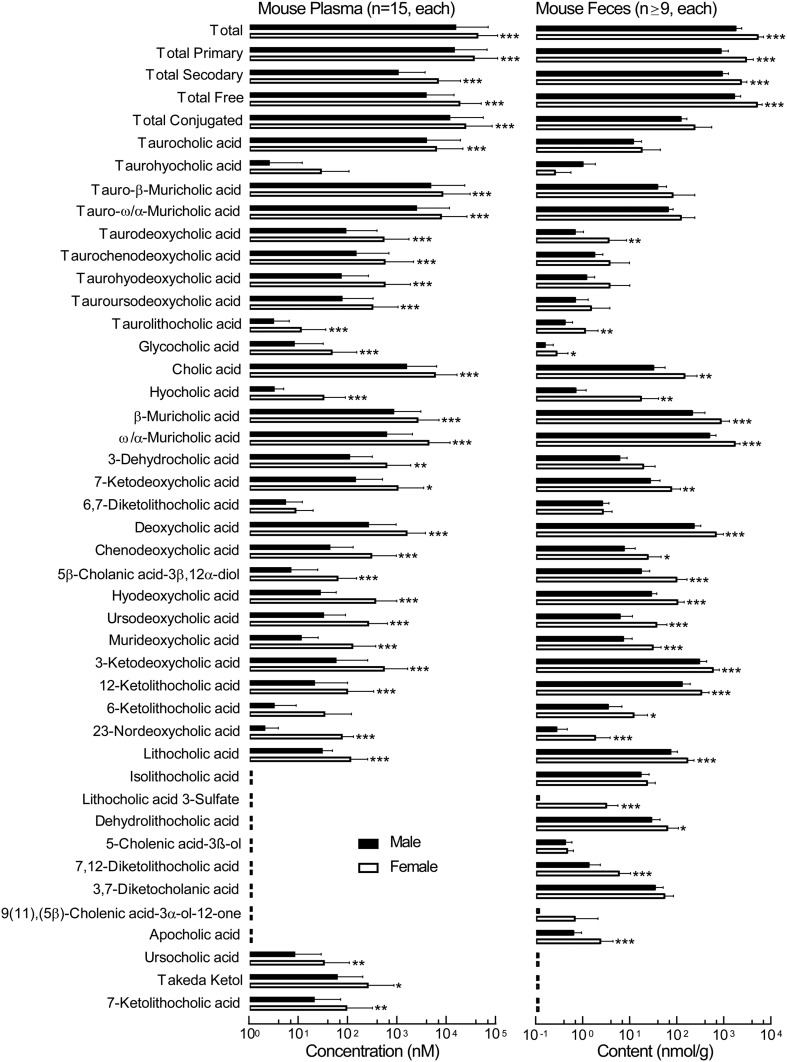
We next assessed the normal range of BA levels in humans and mice as outlined under Materials and Methods. The distribution of individual BA concentrations in human and mouse plasma are demonstrated in Fig. 4 and supplemental Fig. 2. Among the BAs detected within each plasma source, a remarkably broad range of concentrations is noted for the distinct BA molecular species (most BAs can display a range over three orders of magnitude). Both in mice and humans more than half of the BA pool is made of primary BAs (supplemental Fig.2, green parts). Among secondary BAs in humans deoxycholic acid (DCA), GDCA, and 5β-cholanic acid-3β,12α-diol account for more than 30% of the total BA pool (supplemental Fig. 2A), while in mice the dominant secondary BAs are DCA and 7-keto-deoxycholic acid (7-keto-DCA), which account for 14% of the total BA pool (supplemental Fig. 2B). In addition, the composition of detectable circulating BAs in human versus mouse plasma were different. Muricholic acids were detected only in rodents, while glycine-conjugated BAs were almost exclusively detected in human plasma. The only exception (glycine conjugate) was glycocholic acid, which was also detected in nonfasting mice at levels ranging from 3 nM to 450 nM. In addition to differences in primary BAs between humans and mice (due to the presence/absence of hepatic enzymes), differences between humans and mice were observed in secondary (gut microbe-derived) BAs as well (Fig. 4). 5-Cholenic acid-3β-ol (5-CholA) and isolithocholic acid (Iso-LCA) were readily present in human (but not mouse) plasma, while 23-nordeoxycholic acid, 6-ketolithocholic acid (6-Keto-LCA), hyodeoxycholic acid, 6,7-diketolithocholic acid (6,7-Diketo-LCA), 7-ketodeoxycholic acid, 3-dehydrocholic acid (3-Dehydro-CA), and ursocholic acid were primarily present in mice (but not human) plasma (Fig. 4). In mice, the effect of gender on BA levels was tested by comparing circulating levels of BAs in male and female mice of the same age on exactly the same diet and sent from the same vendor in the same shipment. As demonstrated in Fig. 5, female mice had higher levels of all examined BAs in plasma. In plasma, all BAs in female mice reached significance except taurohyocholic acid (THCA), 6,7-Diketo-LCA, and 6-Keto-LCA (Fig. 5, left). In feces, several taurine-conjugated BAs [taurocholic acid (TCA), tauro-ω/α-muricholic acid, tauro-β-muricholic acid, taurochenodeoxycholic acid, taurohyodeoxycholic acid (THDCA), and tauroursodeoxycholic acid], in addition to 3-Dehydro-CA, 6,7-Diketo-LCA, Iso-LCA, 5-CholA, and 9(11),(5β)-cholenic acid-3α-ol-12-one, did not reach significance. Only THCA was higher in male versus female mice (Fig. 5, right).
Fig. 4.
Normal range of various BAs in human and mouse plasma. Normal concentration ranges for the individually monitored BAs in plasma recovered from healthy subjects (n = 20) and C57BL/6J female (n = 20) and male (n = 20) mice were determined as described under Materials and Methods. Boxes indicate the 25th and 75th percentiles, respectively; the middle line is the median, and the upper and lower whiskers are the 10th and 90th percentiles, respectively. Outliers are plotted as individual points. BAs presented in red are detected in human (but not mouse) plasma, while those in blue are detected in mice (but not human) plasma. BAs detected in both human and mouse plasma are plotted in black. All abbreviations are listed in Table 1.
Fig. 5.
Circulating and fecal BA profile in C57BL mice in both males and females. Left panel: BA concentrations in plasma recovered from C57BL/6J male (n = 15; black bars) and female (n = 15; white bars) mice. Right panel: BA content in feces (normalized to feces dry weight) recovered from C57BL/6J male (n = 11; black bars) and female (n = 9; white bars) mice. The box and whisker represent the mean and standard deviation, respectively. P values were calculated by the Wilcoxon rank-sum test. *P < 0.05, **P < 0.01, and ***P < 0.001.
Impact of gut microbiota suppression on circulating levels of BAs
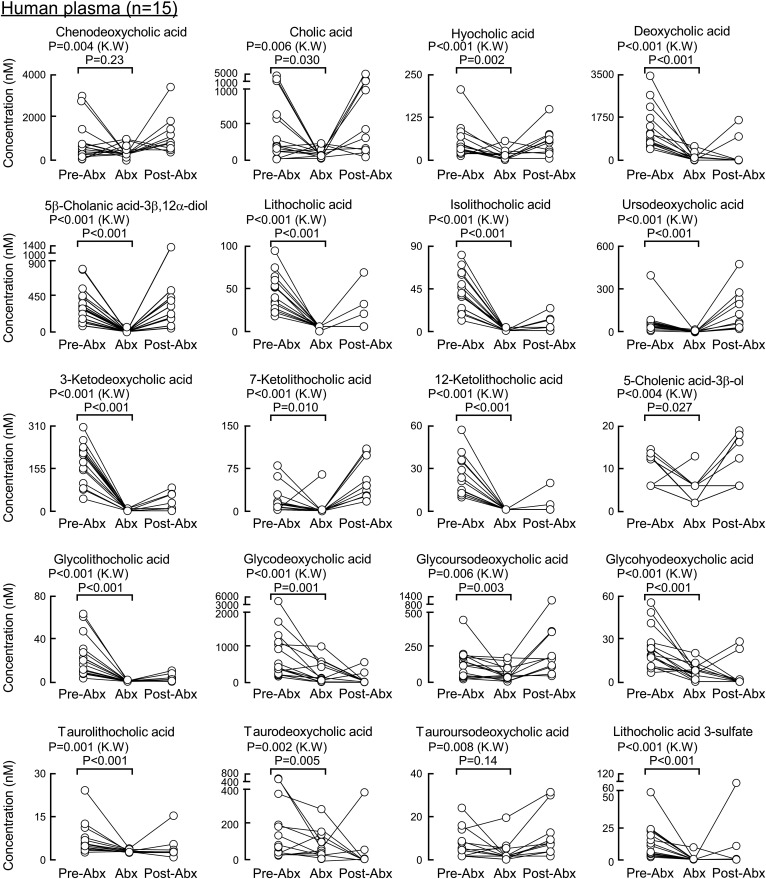
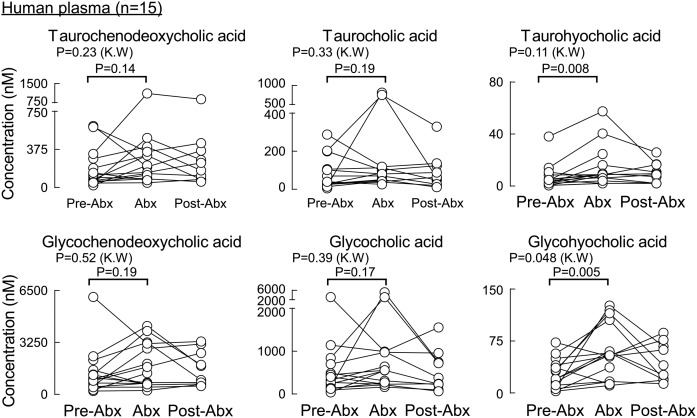
We next looked at the contribution of gut microbes to circulating levels of the individual monitored BAs. Healthy human volunteers had fasting plasma drawn at baseline, following chronic exposure to a cocktail of oral poorly absorbed broad-spectrum antibiotics (Abx), previously shown to suppress gut microbiota (33), and then several weeks following the cessation of the antibiotics, as described under Materials and Methods. All secondary BAs (gut microbe-derived BAs), both free and conjugated forms, were significantly suppressed by Abx treatment (Fig. 6) except for tauroursodeoxycholic acid, which reached statistical significance by the Kruskal-Wallis test (P = 0.008) but not in a pairwise comparison of pre-Abx versus Abx using the Wilcoxon test (P = 0.14). Levels of primary BAs (cholic acid and chinodeoxycholic acid; Fig. 6, first two panels), despite being of host (human) hepatic origin, while showing significant variability, globally showed to be suppressed by the Abx treatment. While both BAs reached statistical significance by the Kruskal-Wallis test (P = 0.006 and P = 0.004, respectively), chenodeoxycholic acid did not show a statistically significant difference in a pairwise comparison of pre-Abx versus Abx using the Wilcoxon test (P = 0.23). In contrast, their conjugated forms were not significantly affected by the Abx treatment (i.e., TCA, glycocholic acid, taurochenodeoxycholic acid, and glycochenodeoxycholic acid; Fig. 7). Similar to the primary BAs, circulating levels of free hyocholic acid were significantly reduced in plasma recovered from subjects following Abx treatment (Fig. 6, third panel), but its conjugated salts (glycohyocholic acid and taurohyochoic acid) were not reduced by the Abx treatment in all selected subjects (Fig. 7).
Fig. 6.
BAs in human plasma whose concentrations are significantly suppressed upon exposure to a cocktail of poorly absorbed oral antibiotics. BA concentrations in plasma (n = 15) shown at baseline (pre-Abx), following 7 days of receiving a daily cocktail of poorly absorbed antibiotics (Abx), and ≥3 weeks following the cessation of antibiotics (post-Abx). P values were calculated using the Kruskal-Wallis test and paired Wilcoxon test for pre-Abx comparison to Abx. P < 0.05 is significant. Shown here are the BA molecular species whose concentrations in plasma were significantly suppressed by Abx exposure.
Fig. 7.
BAs in human plasma whose concentrations are not significantly suppressed upon exposure to a cocktail of poorly absorbed oral antibiotics. BA concentrations in plasma (n = 15) shown at baseline (pre-Abx), following 7 days of receiving a daily cocktail of poorly absorbed antibiotics (Abx), and ≥3 weeks following the cessation of antibiotics (post-Abx). P values were calculated using the Kruskal-Wallis test and paired Wilcoxon test for pre-Abx comparison to Abx. P < 0.05 is significant. Shown here are the BA molecular species whose concentrations in plasma were not significantly suppressed by Abx exposure.
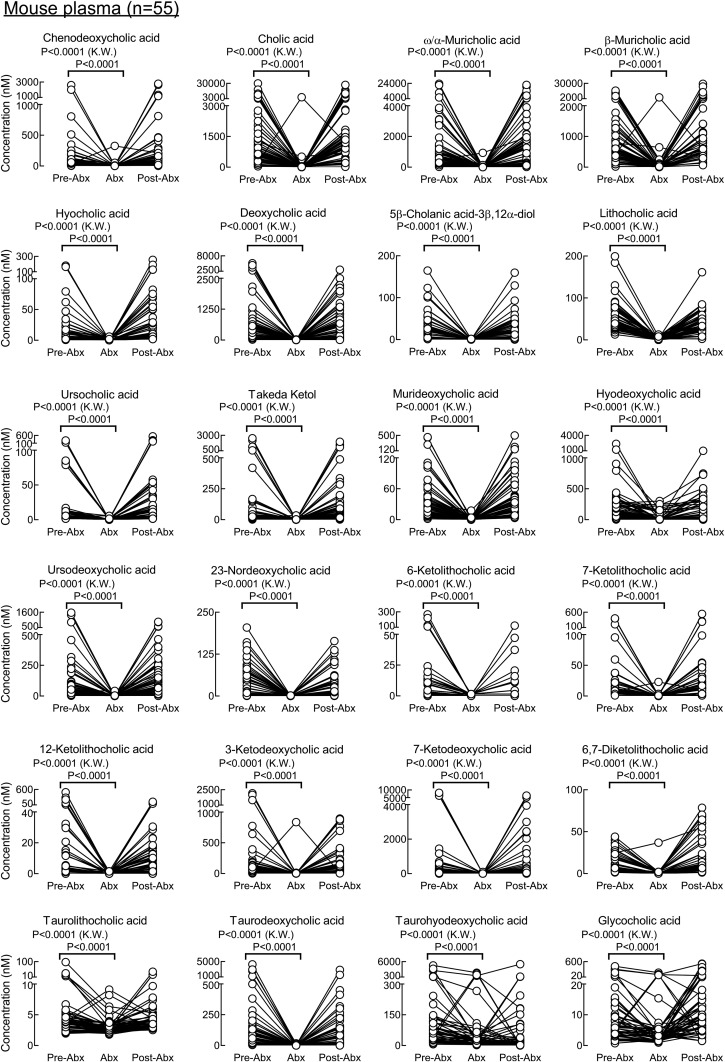
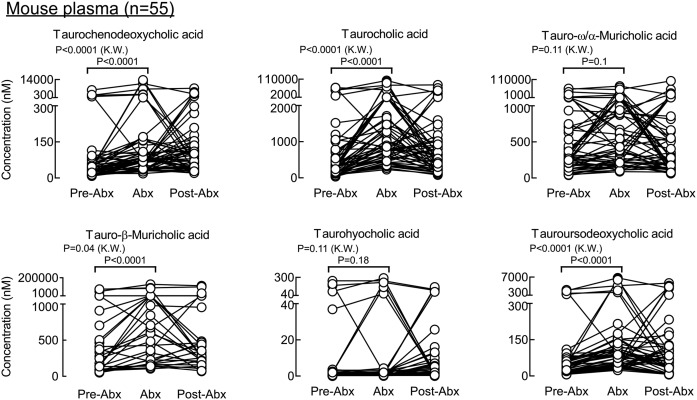
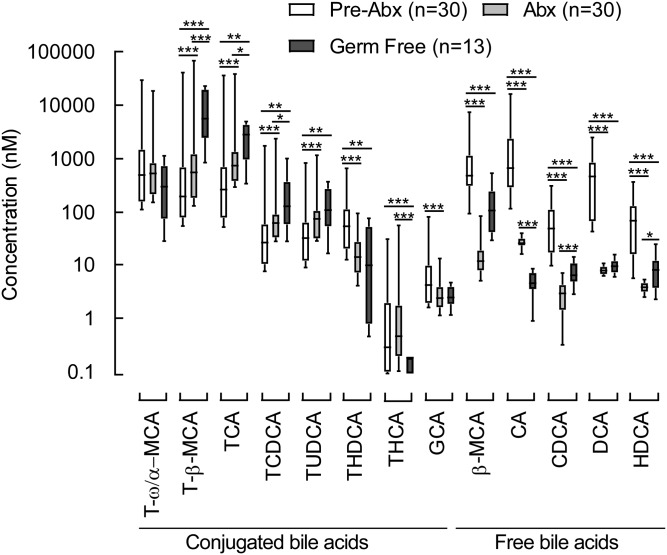
A similar antibiotic challenge was performed in mice to explore the impact of gut microbiota suppression on individual circulating BA levels in paired samples of plasma and feces recovered from the same animals (Figs. 8, 9, supplemental Figs. 3, 4), as described under Materials and Methods. In the experiments with mice, primary tauro conjugated BAs (cholic, chenodeoxycholic, α-muricholic, and β-muricholic acids) were not suppressed but did show statistically significant increased levels following antibiotic treatment both in plasma and feces (Fig. 9, supplemental Fig. 4). A similar trend (though not statistically significant) was observed in human subjects (Fig. 7). Taurohyocholic and tauroursodeoxycholic acids were also not suppressed (Fig. 9, supplemental Fig. 4). All other free secondary and primary BAs, as well as conjugated secondary BAs, were almost completely removed from the circulation by the Abx treatment (Fig. 8). Supplemental Fig. 5 represents all experiments with the effect of Abx exposure on BAs levels in a stacked bar fashion to demonstrate individual BA species that dominated the BA pools in each of the experimental conditions (i.e., pre-Abx, Abx, and post-Abx both in human and mice). In addition to the Abx-treated mice, we also examined individual BA levels in germ-free (GF) mice (n = 13). As expected, measurable BAs in plasma from the GF mice were predominantly composed of conjugated primary BAs (tauro forms of cholic, chenodeoxycholic, α-muricholic, and β-muricholic acids; Fig. 10). While circulating levels of BAs in GF mice were on the whole comparable with the levels observed in conventionally raised mice following Abx treatment (Fig. 10; dark gray bars vs. light gray bars, respectively), levels of several BAs were statistically different (i.e., lower in the Abx-treated mice), suggesting either lifelong GF conditions may modestly alter host BA metabolism, or Abx treatment may also exert some modest direct effects on host BA metabolism.
Fig. 8.
BAs in mouse plasma whose concentrations are significantly suppressed upon exposure to a cocktail of poorly absorbed oral antibiotics. BA concentrations in plasma recovered from 8–10-week-old male and female mice are shown at baseline (pre-Abx), following 5 days of exposure to an antibiotic cocktail in drinking water as described under Materials and Methods (Abx), and 1 week following the cessation of antibiotics (post-Abx). P values were calculated using the Kruskal-Wallis test. P < 0.05 is significant. In addition to the paired analysis, a Wilcoxon test comparing pre-Abx with Abx was performed, and all BAs have significant P values (P < 0.001). Shown here are the BA molecular species whose concentrations in plasma were significantly suppressed by Abx exposure. The experiment was performed twice using both male and female mice. Because the impact of antibiotics on plasma BA concentrations was similar in males and females, results shown are the combined data for both (males, n = 25; females, n = 30).
Fig. 9.
BAs in mouse plasma whose concentrations are not significantly suppressed upon exposure to a cocktail of poorly absorbed oral antibiotics. BA concentrations in plasma recovered from 8–10-week-old male and female mice are shown at baseline (pre-Abx), following 5 days of exposure to an antibiotic cocktail in drinking water as described under Materials and Methods (Abx), and 1 week following the cessation of antibiotics (post-Abx). P values were calculated using the Kruskal-Wallis test and paired analysis; pre-Abx was compared with Abx by the Wilcoxon test. P < 0.05 is significant. Shown here are the BA molecular species whose concentrations in plasma were not significantly suppressed by Abx exposure. The experiment was performed twice using both male and female mice. Because the impact of antibiotics on plasma BA concentrations was similar in males and females, results shown are the combined data for both (males, n = 25; females, n = 30).
Fig. 10.
Comparison of BA concentrations in plasma from germ-free mice with conventionally raised mice before (pre-Abx) versus after exposure to a cocktail of poorly absorbed oral antibiotics (Abx). Box-whisker plots show BA metabolite concentrations in plasma of conventional mice (pre-Abx), mice on poorly absorbed oral antibiotics (Abx), and germ-free mice. The lower and upper lines of the box indicate the 25th and 75th percentiles, respectively; the middle line is the median, and the upper and lower whiskers are 10th and 90th percentiles, respectively. P values were calculated by the Wilcoxon rank-sum test. *P < 0.05 and **P < 0.01.
The effect of diabetes on circulating BA levels in human plasma
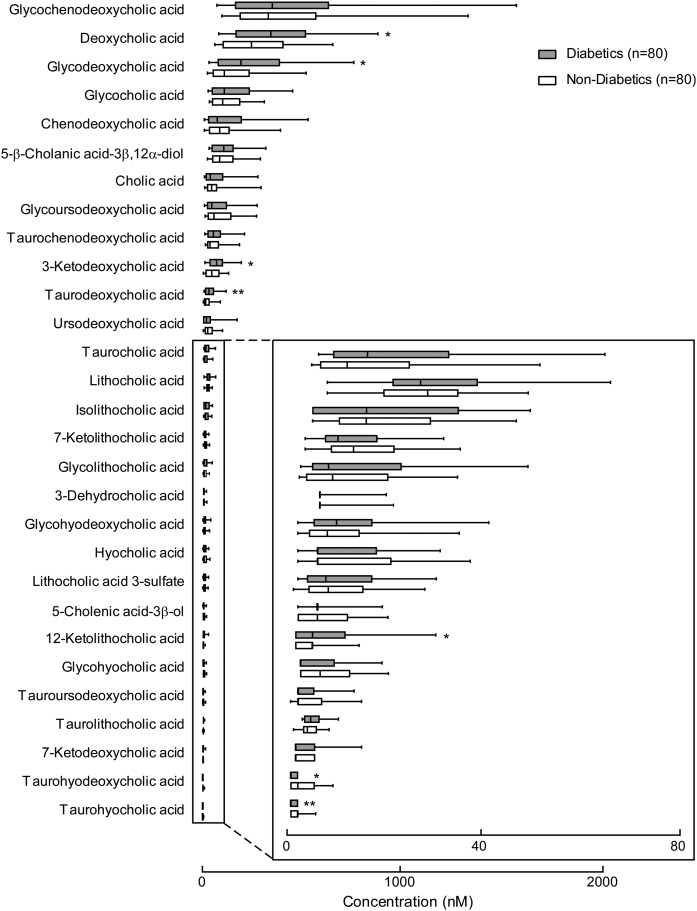
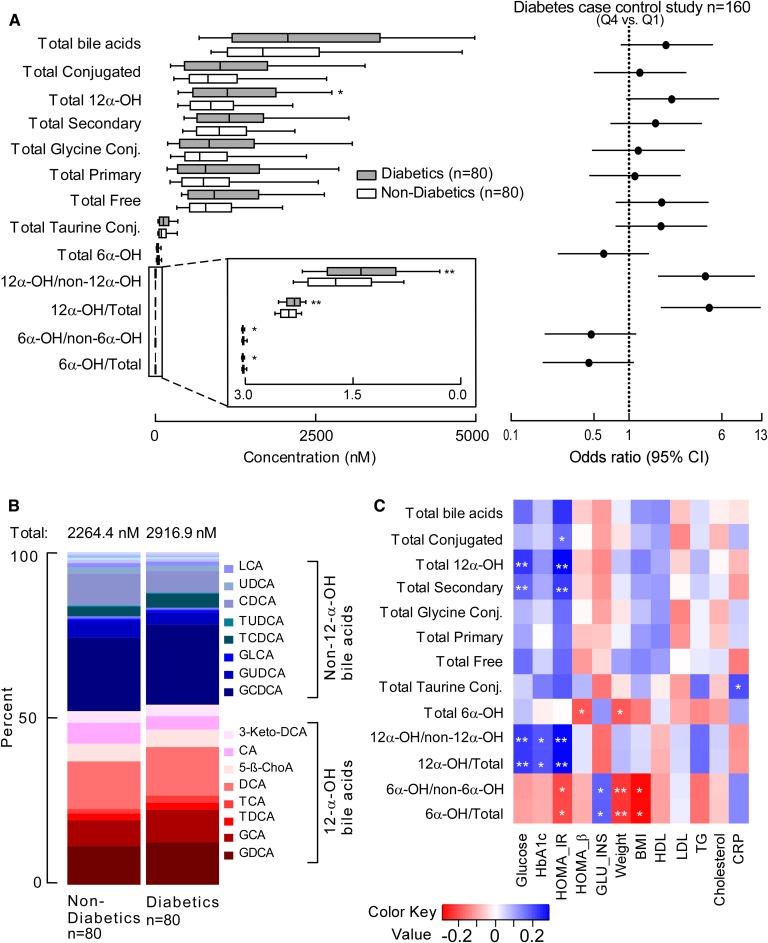
Targeted BA analyses of human plasma samples from subjects with T2DM (n = 80) versus age- and gender-matched non-T2DM (n = 80) subjects were performed to determine if differences in BAs could be identified between the two groups (Fig. 11). Patient characteristics and some relevant routine fasting diagnostic tests for T2DM obtained at the time of subject enrollment and sample collection are shown in Table 2. Comparisons of BA levels in T2DM versus non-T2DM revealed that DCA (P = 0.03), GDCA (P = 0.01), 3-ketodeoxycholic acid (P = 0.01), taurodeoxycholic acid (TDCA) (P = 0.002), and 12-ketolitocholic acid (P = 0.04) were significantly increased in T2DM, while levels of THDCA (P = 0.002) and taurohyocholic acid (P = 0.004) were significantly reduced in T2DM relative to age- and gender-matched non-T2DM (Fig. 11). An estimate of the relative total pool of BAs (based on the sum of circulating measurable BAs) showed a trend toward being higher among T2DM subjects (P = 0.198; Fig. 12A, supplemental Fig. 6). Further, an estimate of the pool of measurable 12α-hydroxyl BAs within the circulation [previously reported to be associated with insulin resistance in subjects with diabetes (35)], as well as the ratio of total circulating 12α-hydroxyl BA/total BAs and 12α-hydroxyl/non-12α-hydroxyl BAs, were all significantly higher in T2DM versus non-T2DM (Fig. 12A, B, supplemental Fig. 6). Further analysis showed taurine-conjugated BAs, also previously associated with T2D (36), were not significantly different between the two groups in our cohort (Fig. 12A, supplemental Fig. 6). Although the total sum of monitored circulating 6-hydroxyl BAs showed no differences in T2DM versus non-T2DM subjects in our cohort, their ratio with total BAs and total non-6-hydroxyl BAs was statistically significantly lower in individuals with T2DM relative to non-T2DM (Fig. 12A).
Fig. 11.
Plasma BA profiles in diabetic (n = 80) and nondiabetic (n = 80) subjects. Box-whisker plots show concentrations of individual BAs in human plasma in individuals with diabetes (gray bars) and age- and gender-matched nondiabetic subjects (white bars). The lower and upper lines of the box indicate the 25th and 75th percentiles, respectively; the middle line is the median, and the upper and lower whiskers are 10th and 90th percentiles, respectively. P values were calculated by the Wilcoxon rank-sum test. *P < 0.05 and **P < 0.01. See also Table 2.
TABLE 2.
Demographics and clinical data of research subjects
| Characteristic | All Subjects (n = 160) | Subjects without Diabetes (n = 80) | Subjects with Diabetes (n = 80) | P |
| Age (years) | 61.7 ± 11.1 | 60.43 ± 12.8 | 63.2 ± 8.9 | 0.12 |
| Male (%) | 48.8 | 50 | 47.5 | 0.87 |
| Diabetes (%) | 50 | 0 | 100 | NA |
| Smoking (%) | 12.5 | 12.5 | 12.5 | 1 |
| BMI | 29.5 (25.6, 34.2) | 27.4 (24.4, 30.3) | 31.7 (28.3, 35.8) | <0.001 |
| Glucose | 108.6 (96.0, 138.9) | 98.2 (90.6, 106.5) | 139.1 (118.5, 162.1) | <0.001 |
| Insulin | 7.9 (5.1, 13.4) | 6.0 (4.2, 8.5) | 12.4 (6.9, 17.2) | <0.001 |
| Hemoglobin A1c | 6.0 (5.4, 6.9) | 5.5 (5.1, 5.8) | 6.9 (6.1, 8.1) | <0.001 |
| T2DM medication (%) | 30.6 | 0 | 61.3 | NA |
p values were calculated by Wilcoxon rank-sum test for continuous data and Pearson’s Chi-square test for categorical factors. Continuous data are presented as means ± SDs or medians (interquartile ranges); categorical variables are presented as percentages.
Fig. 12.
Relationship of BAs to diabetes and metabolic disease-related clinical outcomes. A, left panel: Box-whisker plots represent grouped concentrations of BAs in subjects with diabetes (n = 80; gray bars) and nondiabetics (n = 80; white bars); lower and upper lines of the box indicate the 25th and 75th percentiles, respectively; the middle line is the median, and the upper and lower whiskers are the 10th and 90th percentiles, respectively. P values were calculated using the Wilcoxon rank-sum test. *P < 0.05 and **P < 0.01. A, right panel: Forest plot of diabetes ORs of BA Q4 versus Q1; bars represent 95% CIs. B: 12-α-Hydroxyl BA plasma concentrations show significant differences between diabetic (n = 80) and age- and gender-matched nondiabetic (n = 80) subjects. C: Heat map showing Spearman correlation between BAs and fasting glucose (glucose), HbA1c, HOMA-IR, HOMA-β, GLU_INS, weight, BMI, HDL, LDL, TGs, cholesterol, and CRP. The correlation strength is shown by the color bar; blue represents a positive association, red represents a negative association, and white represents no association. *P < 0.05 and **P < 0.01. GLU_INS, glucose-to-insulin ratio; TG, triglyceride.
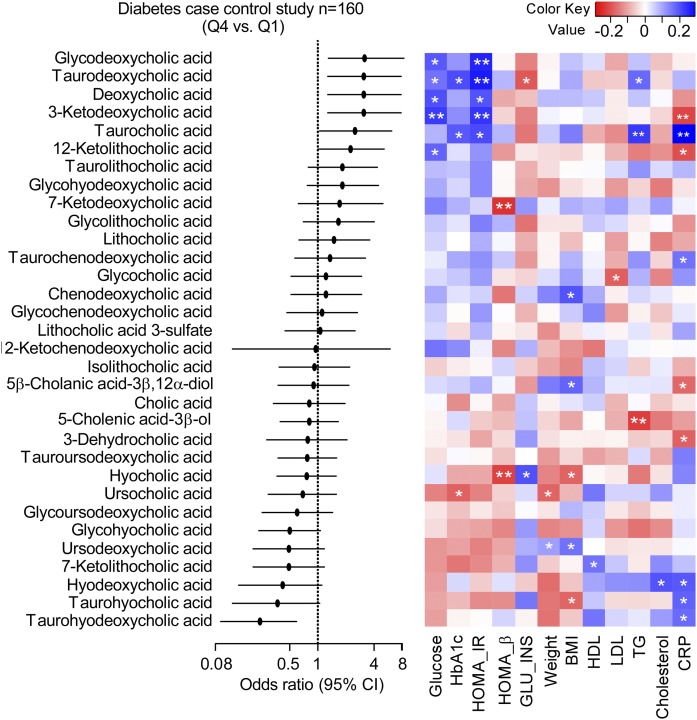
The ability of individual circulating levels of BAs to predict the risk of T2DM is shown in Fig. 13 [forest plot of BA fourth quartile (Q4) vs. first quartile (Q1) ORs and 95% CIs]. Notably, higher levels of THDCA were significantly inversely associated with T2DM (OR: 0.24; 95% CI: 0.09, 0.60; P = 0.003), while higher concentrations of GDCA (OR: 3.16; 95% CI: 1.28, 8.14; P = 0.01), TDCA (OR: 3.1; 95% CI: 1.26, 7.89; P = 0.01), DCA (OR: 3.1; 95% CI: 1.26, 7.89; P = 0.01), 3-ketodeoxycholic acid (OR: 3.1; 95% CI: 1.26, 7.89; P = 0.01), and TCA (OR: 2.5; 95% CI: 1.03, 6.27; P = 0.046) were associated with increased risk of T2DM.
Fig. 13.
Relationship between individual plasma BA concentrations and diabetes risk. Left panel: Forest plot of ORs of BA Q4 versus Q1; bars represent 95% CIs. Higher concentrations of THDCA (OR: 0.24; 95% CI: 0.09, 0.6; P = 0.003) tracks with a lower risk of developing diabetes, while increased concentrations of TCA (OR: 2.5; 95% CI: 1.03, 6.27; P = 0.046), TDCA (OR: 3.1; 95% CI: 1.26, 7.89; P = 0.01), GDCA (OR: 3.16; 95% CI: 1.28, 8.14; P = 0.01), DCA (OR: 3.1; 95% CI: 1.26, 7.89; P = 0.01), and 3-ketodeoxycholic acid (OR: 3.1; 95% CI: 1.26, 7.89; P = 0.01) track with increased risk of developing diabetes. Right panel: Heat map showing Spearman correlation between BAs and fasting glucose (glucose), HbA1c, HOMA-IR, HOMA-β, GLU_INS, weight, BMI, HDL, LDL, TGs, cholesterol, and CRP. The correlation strength is shown by the color bar; blue represents a positive association, red represents a negative association, and white represents no association. *P < 0.05 and **P < 0.01. GLU_INS, glucose-to-insulin ratio; TG, triglyceride.
In further analyses, we examined the correlation between plasma levels of specific BAs and previously reported ratios with multiple indices of diabetes control [fasting glucose, hemoglobin A1c (HbA1c), homeostatic model assessment for insulin resistance (HOMA-IR), homeostatic model assessment for β-cell function (HOMA-β), and glucose/insulin ratio], as well as other T2D comorbidities such as obesity (weight and BMI), impaired lipid metabolism (LDL, HDL, total cholesterol, and triglycerides), and inflammation [high-sensitivity C-reactive protein (CRP); Figs. 12C, 13]. All six BAs that were significantly elevated and associated with T2D (glycodeoxycholic acid, TDCA, DCA, 3-ketodeoxycholic acid, TCA, and 12-ketolitocholic acid) were positively associated with fasting glucose level and/or HOMA-IR. A similar pattern was also observed for total secondary 12α-hydroxyl BAs and their ratio with total BAs and total non-12α-hydroxyl BAs (Fig. 12C). Levels of 12α-hydroxyl BAs and total non-12α-hydroxyl BAs were also significantly correlated with HbA1c. BAs most strongly statistically associated with levels of triglycerides were TDCA and TCA (Fig. 13). Interestingly, hoyo- BAs, although negatively associated with T2DM and measures of obesity (BMI), showed a significant positive association with CRP. Other BAs that showed a strong positive association with CRP levels were TCA and total taurine-conjugated BAs (Figs. 12C, 13).
DISCUSSION
Beyond their role in the digestion and absorption of fat and fat-soluble vitamins, BAs have increasingly been recognized as signaling molecules with a potential role in regulating systemic energy homeostasis and lipid and carbohydrate metabolism (5–10). In addition to BAs synthetized by the host (so-called primary BAs) and their corresponding glycine and taurine conjugates (bile salts), a large assortment of BAs are detectable within the circulation that are produced by gut microbial modifications of primary BAs (so-called secondary BAs). As microbial community composition is now increasingly recognized to be altered with multiple cardiometabolic diseases, corresponding changes in microbial function, and thus BA composition in the host, is feasible. While multiple studies have examined different facets of BA metabolism in varying populations, progress in the global characterization of BA pool changes, and functional studies, have been somewhat hampered by a lack of robust quantitative analytical methods for characterizing circulating BA levels, as well as comprehensive examinations of the impact of gut microbiota on individual BA molecular species. The present stable-isotope-dilution LC/MS/MS method developed to quantify BA levels in both human and mouse serum and plasma should prove to be a valuable tool for further advancing the study of BAs in cardiometabolic diseases and the exploration of links to gut microbiota-driven metabolism in the host.
Gut microbes have recently been recognized as contributors in the development of a broad range of cardiometabolic phenotypes and diseases (37–39), and the potential involvement of both primary BAs and their gut microbiota-produced derivatives have been suggested to serve as potential mediators of some of these effects (40–42). Specifically, BAs are recognized as signaling molecules that beyond the integrated regulation of metabolism can coordinately affect inflammation and energy expenditure within the host via specific signaling receptors, including the nuclear FXR and the Takeda G protein-coupled receptor 5 (43, 44). By engaging these receptors, circulating BAs can modulate transcriptional networks and signaling cascades that affect a diverse range of metabolic pathways both within the liver, and peripheral tissues. Likewise, emerging evidence points to gut microbiota and the risk, development, and response to chemotherapeutic agents in various malignancies (45, 46). As increasing awareness in the involvement of BA in disease-relevant processes has occurred, there is in parallel increased interest in the use of BAs for risk stratification for therapeutic decisions (47) and for BA pathways for becoming targets for pharmacotherapy for a variety of cardiometabolic diseases (48).
Herein we present the development, characterization, and analytically validation of a robust, reliable, and reproducible LC/MS/MS platform for the quantification of systemic BAs in biological matrices. While several LC/MS/MS methods have been previously developed for BA quantification (23–32), the current studies describe a stable-isotope-dilution LC/MS/MS method for the quantification of more than 50 free and conjugated BAs in human and mice serum/plasma samples that was optimized for accuracy, precision, minimization of matrix effects, and optimization of analyte recovery, stability, chromatographic separation, and performance, features that render the method robust for meeting the high throughput demands of application to large-scale clinical studies. The method is suitable for analyzing samples collected from large and small cohorts alike, and thoroughly examined and optimized precautions were taken to minimize batch effects and reduce sample carryover, all while maintaining shortened acquisition time (<20 min) by implementing a multiplexed column switching system.
We applied this method to investigate the role of gut microbes on circulating levels of BAs both in humans and mice. As expected, levels of secondary BAs decreased with the treatment, including both free and conjugated forms, while conjugated primary BAs were increased in general, although not to a statistically significant level. Interestingly, free primary BAs, both in human and mouse circulation and mouse feces, were on average 60–90% decreased by the suppression of gut microbial activity with the Abx cocktail. The rationale for this reduction is that the first step in gut microbial BA salt fermentation includes the deconjugation of glycine and taurine by the bile salt hydrolases (3, 4), suggesting that free primary BAs in the circulation predominantly are derived from gut microbial activity (i.e., microbial deconjugation of BA taurine and glycine salts), although secondary effects of Abx could not be excluded. Thus, the traditional BA classification of primary (host-synthetized) and secondary (gut microbe-derived) can be somewhat misleading. In addition, hoyo-BAs exhibit a similar response to Abx treatment as primary BAs. Hyocholic acid is produced in humans by the liver enzyme CYP3A4 (6α-hydroxylation) from chenodeoxycholic acid (49) and is excreted in the urine after glucuronidation (50).
Using the present quantitative method, we also show that circulating levels of TCA, 3-ketodeoxycholic acid, DCA, and its conjugated forms TDCA and GDCA are positively associated with T2DM in humans. Taurocholic acid is also higher in subjects with T2DM versus subjects with normal glucose tolerance (51), and higher levels of DCA were found to impair glucose hemostasis in rodents fed a high-fat diet (52, 53). Notably, all BAs that positively correlated with T2DM in this study (the primary BA TCA, DCA, and its conjugated metabolites TDCA and glycodeoxycholic acid, and for the first time reported to correlate with metabolic disorder 3-ketodeoxycholic acid) bear the 12α-hydroxyl moiety, BAs that previously were reported to show an association with insulin resistance in the Relationship between Insulin Sensitivity and Cardiovascular Risk study (35). Multiple investigations in mouse models of diabetes have also demonstrated an increase in 12α-hydroxyl BAs (54–57). It is also interesting to note that 12α-hydroxyl BAs have been reported to be reduced in mice lacking the critical insulin-sensitive transcription factor FoxO1 (58), further suggesting that insulin resistance is closely linked to altered BA metabolism. Here we provide novel evidence that systemic levels of taurohydodeoxycholic acid, which was previously reported to have hepatoprotective effects in an animal study (59), is negatively associated with T2DM in humans.
In conclusion, we developed and validated a comprehensive stable-isotope-dilution LC/MS/MS method for the quantification of free and conjugated primary and secondary BAs in human and mouse serum/plasma samples, as well as feces. The validation data, in addition to the results from the clinical and mice data, support our conclusion that this method is a powerful analytical tool for further studying the contribution of gut microbes to metabolic diseases.
Supplementary Material
Footnotes
Abbreviations:
- Abx
- antibiotics
- BA
- bile acid
- CRP
- C-reactive protein
- DCA
- deoxycholic acid
- GF
- germ-free
- HbA1c
- hemoglobin A1c
- HOMA-IR
- homeostatic model assessment for insulin resistance
- HOMA-β
- homeostatic model assessment for β-cell function
- IS
- internal standard
- ISO-LCA
- isolithocholic acid
- MRM
- multiple reaction monitoring
- OR
- odds ratio
- Q1
- first quartile
- Q4
- fourth quartile
- QC
- quality control
- RT
- retention time
- TCA
- taurocholic acid
- TDCA
- taurodeoxycholic acid
- THCA
- taurohyocholic acid
- THDCA
- taurohyodeoxycholic acid
- T2DM
- type 2 diabetes mellitus
- 3-Dehydro-CA
- 3-dehydrocholic acid
- 5-CholA
- 5-cholenic acid-3β-ol
- 6,7-Diketo-LCA
- 6,7-diketolithocholic acid
- 6-Keto-LCA
- 6-ketolithocholic acid
This work was supported by National Institutes of Health Grants P01 HL147823, R01DK120679, P50AA024333, R01HL103866, and R01HL126827 and Fondation Leducq Grant 17CVD01. The content is solely the responsibility of the authors and does not necessarily represent the official views of the National Institutes of Health. S.L.H. reports being named as co-inventor on pending and issued patents held by the Cleveland Clinic relating to cardiovascular diagnostics and therapeutics. S.L.H. also reports being a paid consultant for P&G, having received research funds from P&G and Roche Diagnostics, and being eligible to receive royalty payments for inventions or discoveries related to cardiovascular diagnostics or therapeutics from Cleveland HeartLab, Quest Diagnostics, and P&G. The other authors have reported that they have no relationships relevant to the contents of this article to disclose.
The online version of this article (available at https://www.jlr.org) contains a supplement.
REFERENCES
- 1.Elliott W. H., and Hyde P. M.. 1971. Metabolic pathways of bile acid synthesis. Am. J. Med. 51: 568–579. [DOI] [PubMed] [Google Scholar]
- 2.Hofmann A. F., and Hagey L. R.. 2008. Bile acids: chemistry, pathochemistry, biology, pathobiology, and therapeutics. Cell. Mol. Life Sci. 65: 2461–2483. [DOI] [PMC free article] [PubMed] [Google Scholar]
- 3.Devlin A. S., and Fischbach M. A.. 2015. A biosynthetic pathway for a prominent class of microbiota-derived bile acids. Nat. Chem. Biol. 11: 685–690. [DOI] [PMC free article] [PubMed] [Google Scholar]
- 4.Ridlon J. M., Kang D. J., and Hylemon P. B.. 2006. Bile salt biotransformations by human intestinal bacteria. J. Lipid Res. 47: 241–259. [DOI] [PubMed] [Google Scholar]
- 5.Kuipers F., Bloks V. W., and Groen A. K.. 2014. Beyond intestinal soap–bile acids in metabolic control. Nat. Rev. Endocrinol. 10: 488–498. [DOI] [PubMed] [Google Scholar]
- 6.Li Y. T., Swales K. E., Thomas G. J., Warner T. D., and Bishop-Bailey D.. 2007. Farnesoid x receptor ligands inhibit vascular smooth muscle cell inflammation and migration. Arterioscler. Thromb. Vasc. Biol. 27: 2606–2611. [DOI] [PubMed] [Google Scholar]
- 7.Mencarelli A., Renga B., Distrutti E., and Fiorucci S.. 2009. Antiatherosclerotic effect of farnesoid X receptor. Am. J. Physiol. Heart Circ. Physiol. 296: H272–H281. [DOI] [PubMed] [Google Scholar]
- 8.Pols T. W., Nomura M., Harach T., Lo Sasso G., Oosterveer M. H., Thomas C., Rizzo G., Gioiello A., Adorini L., Pellicciari R., et al. 2011. TGR5 activation inhibits atherosclerosis by reducing macrophage inflammation and lipid loading. Cell Metab. 14: 747–757. [DOI] [PMC free article] [PubMed] [Google Scholar]
- 9.Sayin S. I., Wahlstrom A., Felin J., Jantti S., Marschall H. U., Bamberg K., Angelin B., Hyotylainen T., Oresic M., and Backhed F.. 2013. Gut microbiota regulates bile acid metabolism by reducing the levels of tauro-beta-muricholic acid, a naturally occurring FXR antagonist. Cell Metab. 17: 225–235. [DOI] [PubMed] [Google Scholar]
- 10.Thomas C., Gioiello A., Noriega L., Strehle A., Oury J., Rizzo G., Macchiarulo A., Yamamoto H., Mataki C., Pruzanski M., et al. 2009. TGR5-mediated bile acid sensing controls glucose homeostasis. Cell Metab. 10: 167–177. [DOI] [PMC free article] [PubMed] [Google Scholar]
- 11.Downes M., Verdecia M. A., Roecker A. J., Hughes R., Hogenesch J. B., Kast-Woelbern H. R., Bowman M. E., Ferrer J. L., Anisfeld A. M., Edwards P. A., et al. 2003. A chemical, genetic, and structural analysis of the nuclear bile acid receptor FXR. Mol. Cell. 11: 1079–1092. [DOI] [PMC free article] [PubMed] [Google Scholar]
- 12.Fang S., Suh J. M., Reilly S. M., Yu E., Osborn O., Lackey D., Yoshihara E., Perino A., Jacinto S., Lukasheva Y., et al. 2015. Intestinal FXR agonism promotes adipose tissue browning and reduces obesity and insulin resistance. Nat. Med. 21: 159–165. [DOI] [PMC free article] [PubMed] [Google Scholar]
- 13.Ferrell J. M., Pathak P., Boehme S., Gilliland T., and Chiang J. Y. L.. 2019. Deficiency of both farnesoid X receptor and Takeda G protein-coupled receptor 5 exacerbated liver fibrosis in mice. Hepatology. 70: 955–970. [DOI] [PMC free article] [PubMed] [Google Scholar]
- 14.Lu T. T., Makishima M., Repa J. J., Schoonjans K., Kerr T. A., Auwerx J., and Mangelsdorf D. J.. 2000. Molecular basis for feedback regulation of bile acid synthesis by nuclear receptors. Mol. Cell. 6: 507–515. [DOI] [PubMed] [Google Scholar]
- 15.Makishima M., Okamoto A. Y., Repa J. J., Tu H., Learned R. M., Luk A., Hull M. V., Lustig K. D., Mangelsdorf D. J., and Shan B.. 1999. Identification of a nuclear receptor for bile acids. Science. 284: 1362–1365. [DOI] [PubMed] [Google Scholar]
- 16.Pathak P., Xie C., Nichols R. G., Ferrell J. M., Boehme S., Krausz K. W., Patterson A. D., Gonzalez F. J., and Chiang J. Y. L.. 2018. Intestine farnesoid X receptor agonist and the gut microbiota activate G-protein bile acid receptor-1 signaling to improve metabolism. Hepatology. 68: 1574–1588. [DOI] [PMC free article] [PubMed] [Google Scholar]
- 17.Perino A., Pols T. W., Nomura M., Stein S., Pellicciari R., and Schoonjans K.. 2014. TGR5 reduces macrophage migration through mTOR-induced C/EBPbeta differential translation. J. Clin. Invest. 124: 5424–5436. [DOI] [PMC free article] [PubMed] [Google Scholar]
- 18.Velazquez-Villegas L. A., Perino A., Lemos V., Zietak M., Nomura M., Pols T. W. H., and Schoonjans K.. 2018. TGR5 signalling promotes mitochondrial fission and beige remodelling of white adipose tissue. Nat. Commun. 9: 245. [DOI] [PMC free article] [PubMed] [Google Scholar]
- 19.Watanabe M., Houten S. M., Mataki C., Christoffolete M. A., Kim B. W., Sato H., Messaddeq N., Harney J. W., Ezaki O., Kodama T., et al. 2006. Bile acids induce energy expenditure by promoting intracellular thyroid hormone activation. Nature. 439: 484–489. [DOI] [PubMed] [Google Scholar]
- 20.1988. Bile acid sequestrants and hyperlipidaemia. Lancet. 1: 220–221. [PubMed] [Google Scholar]
- 21.De Magalhaes Filho C. D., Downes M., and Evans R.. 2016. Bile acid analog intercepts liver fibrosis. Cell. 166: 789. [DOI] [PubMed] [Google Scholar]
- 22.Sepe V., Distrutti E., Fiorucci S., and Zampella A.. 2018. Farnesoid X receptor modulators 2014-present: a patent review. Expert Opin. Ther. Pat. 28: 351–364. [DOI] [PubMed] [Google Scholar]
- 23.Alnouti Y., Csanaky I. L., and Klaassen C. D.. 2008. Quantitative-profiling of bile acids and their conjugates in mouse liver, bile, plasma, and urine using LC-MS/MS. J. Chromatogr. B Analyt. Technol. Biomed. Life Sci. 873: 209–217. [DOI] [PMC free article] [PubMed] [Google Scholar]
- 24.García-Cañaveras J. C., Donato M. T., Castell J. V., and Lahoz A.. 2012. Targeted profiling of circulating and hepatic bile acids in human, mouse, and rat using a UPLC-MRM-MS-validated method. J. Lipid Res. 53: 2231–2241. [DOI] [PMC free article] [PubMed] [Google Scholar]
- 25.Hagio M., Matsumoto M., Fukushima M., Hara H., and Ishizuka S.. 2009. Improved analysis of bile acids in tissues and intestinal contents of rats using LC/ESI-MS. J. Lipid Res. 50: 173–180. [DOI] [PubMed] [Google Scholar]
- 26.Han J., Liu Y., Wang R., Yang J., Ling V., and Borchers C. H.. 2015. Metabolic profiling of bile acids in human and mouse blood by LC-MS/MS in combination with phospholipid-depletion solid-phase extraction. Anal. Chem. 87: 1127–1136. [DOI] [PubMed] [Google Scholar]
- 27.John C., Werner P., Worthmann A., Wegner K., Todter K., Scheja L., Rohn S., Heeren J., and Fischer M.. 2014. A liquid chromatography-tandem mass spectrometry-based method for the simultaneous determination of hydroxy sterols and bile acids. J. Chromatogr. A. 1371: 184–195. [DOI] [PubMed] [Google Scholar]
- 28.Sarafian M. H., Lewis M. R., Pechlivanis A., Ralphs S., McPhail M. J., Patel V. C., Dumas M. E., Holmes E., and Nicholson J. K.. 2015. Bile acid profiling and quantification in biofluids using ultra-performance liquid chromatography tandem mass spectrometry. Anal. Chem. 87: 9662–9670. [DOI] [PubMed] [Google Scholar]
- 29.Scherer M., Gnewuch C., Schmitz G., and Liebisch G.. 2009. Rapid quantification of bile acids and their conjugates in serum by liquid chromatography-tandem mass spectrometry. J. Chromatogr. B Analyt. Technol. Biomed. Life Sci. 877: 3920–3925. [DOI] [PubMed] [Google Scholar]
- 30.Schmid A., Neumann H., Karrasch T., Liebisch G., and Schaffler A.. 2016. Bile acid metabolome after an oral lipid tolerance test by liquid chromatography-tandem mass spectrometry (LC-MS/MS). PLoS One. 11: e0148869. [DOI] [PMC free article] [PubMed] [Google Scholar]
- 31.Wegner K., Just S., Gau L., Mueller H., Gerard P., Lepage P., Clavel T., and Rohn S.. 2017. Rapid analysis of bile acids in different biological matrices using LC-ESI-MS/MS for the investigation of bile acid transformation by mammalian gut bacteria. Anal. Bioanal. Chem. 409: 1231–1245. [DOI] [PubMed] [Google Scholar]
- 32.Zhu P., Zhang J., Chen Y., Yin S., Su M., Xie G., Brouwer K. L. R., Liu C., Lan K., and Jia W.. 2018. Analysis of human C24 bile acids metabolome in serum and urine based on enzyme digestion of conjugated bile acids and LC-MS determination of unconjugated bile acids. Anal. Bioanal. Chem. 410: 5287–5300. [DOI] [PMC free article] [PubMed] [Google Scholar]
- 33.Tang W. H., Wang Z., Levison B. S., Koeth R. A., Britt E. B., Fu X., Wu Y., and Hazen S. L.. 2013. Intestinal microbial metabolism of phosphatidylcholine and cardiovascular risk. N. Engl. J. Med. 368: 1575–1584. [DOI] [PMC free article] [PubMed] [Google Scholar]
- 34.Wang Z., Klipfell E., Bennett B. J., Koeth R., Levison B. S., Dugar B., Feldstein A. E., Britt E. B., Fu X., Chung Y. M., et al. 2011. Gut flora metabolism of phosphatidylcholine promotes cardiovascular disease. Nature. 472: 57–63. [DOI] [PMC free article] [PubMed] [Google Scholar]
- 35.Haeusler R. A., Astiarraga B., Camastra S., Accili D., and Ferrannini E.. 2013. Human insulin resistance is associated with increased plasma levels of 12a-hydroxylated bile acids. Diabetes. 62: 4184–4191. [DOI] [PMC free article] [PubMed] [Google Scholar]
- 36.Wewalka M., Patti M. E., Barbato C., Houten S. M., and Goldfine A. B.. 2014. Fasting serum taurine-conjugated bile acids are elevated in type 2 diabetes and do not change with intensification of insulin. J. Clin. Endocrinol. Metab. 99: 1442–1451. [DOI] [PMC free article] [PubMed] [Google Scholar]
- 37.Brown J. M., and Hazen S. L.. 2018. Microbial modulation of cardiovascular disease. Nat. Rev. Microbiol. 16: 171–181. [DOI] [PMC free article] [PubMed] [Google Scholar]
- 38.Koh A., De Vadder F., Kovatcheva-Datchary P., and Backhed F.. 2016. From dietary fiber to host physiology: short-chain fatty acids as key bacterial metabolites. Cell. 165: 1332–1345. [DOI] [PubMed] [Google Scholar]
- 39.Tang W. H. W., Backhed F., Landmesser U., and Hazen S. L.. 2019. Intestinal microbiota in cardiovascular health and disease: JACC state-of-the-art review. J. Am. Coll. Cardiol. 73: 2089–2105. [DOI] [PMC free article] [PubMed] [Google Scholar]
- 40.Adolph T. E., Grander C., Moschen A. R., and Tilg H.. 2018. Liver-microbiome axis in health and disease. Trends Immunol. 39: 712–723. [DOI] [PubMed] [Google Scholar]
- 41.Molinaro A., Wahlstrom A., and Marschall H. U.. 2018. Role of bile acids in metabolic control. Trends Endocrinol. Metab. 29: 31–41. [DOI] [PubMed] [Google Scholar]
- 42.Wahlström A., Sayin S. I., Marschall H. U., and Backhed F.. 2016. Intestinal crosstalk between bile acids and microbiota and its impact on host metabolism. Cell Metab. 24: 41–50. [DOI] [PubMed] [Google Scholar]
- 43.Chávez-Talavera O., Tailleux A., Lefebvre P., and Staels B.. 2017. Bile acid control of metabolism and inflammation in obesity, type 2 diabetes, dyslipidemia, and nonalcoholic fatty liver disease. Gastroenterology. 152: 1679–1694.e1673. [DOI] [PubMed] [Google Scholar]
- 44.van Nierop F. S., Scheltema M. J., Eggink H. M., Pols T. W., Sonne D. P., Knop F. K., and Soeters M. R.. 2017. Clinical relevance of the bile acid receptor TGR5 in metabolism. Lancet Diabetes Endocrinol. 5: 224–233. [DOI] [PubMed] [Google Scholar]
- 45.Jia W., Xie G. X., and Jia W. P.. 2018. Bile acid-microbiota crosstalk in gastrointestinal inflammation and carcinogenesis. Nat. Rev. Gastroenterol. Hepatol. 15: 111–128. [DOI] [PMC free article] [PubMed] [Google Scholar]
- 46.Vázquez-Baeza Y., Callewaert C., Debelius J., Hyde E., Marotz C., Morton J. T., Swafford A., Vrbanac A., Dorrestein P. C., and Knight R.. 2018. Impacts of the human gut microbiome on therapeutics. Annu. Rev. Pharmacol. Toxicol. 58: 253–270. [DOI] [PubMed] [Google Scholar]
- 47.Gu Y., Wang X., Li J., Zhang Y., Zhong H., Liu R., Zhang D., Feng Q., Xie X., Hong J., et al. 2017. Analyses of gut microbiota and plasma bile acids enable stratification of patients for antidiabetic treatment. Nat. Commun. 8: 1785. [DOI] [PMC free article] [PubMed] [Google Scholar]
- 48.Thomas C., Pellicciari R., Pruzanski M., Auwerx J., and Schoonjans K.. 2008. Targeting bile-acid signalling for metabolic diseases. Nat. Rev. Drug Discov. 7: 678–693. [DOI] [PubMed] [Google Scholar]
- 49.Araya Z., and Wikvall K.. 1999. 6alpha-hydroxylation of taurochenodeoxycholic acid and lithocholic acid by CYP3A4 in human liver microsomes. Biochim. Biophys. Acta. 1438: 47–54. [DOI] [PubMed] [Google Scholar]
- 50.Radomińska-Pyrek A., Zimniak P., Irshaid Y. M., Lester R., Tephly T. R., and St Pyrek J.. 1987. Glucuronidation of 6 alpha-hydroxy bile acids by human liver microsomes. J. Clin. Invest. 80: 234–241. [DOI] [PMC free article] [PubMed] [Google Scholar]
- 51.Wang S., Deng Y., Xie X., Ma J., Xu M., Zhao X., Gu W., Hong J., Wang W., Xu G., et al. 2018. Plasma bile acid changes in type 2 diabetes correlated with insulin secretion in two-step hyperglycemic clamp. J. Diabetes. 10: 874–885. [DOI] [PubMed] [Google Scholar]
- 52.Yoshitsugu R., Kikuchi K., Iwaya H., Fujii N., Hori S., Lee D. G., and Ishizuka S.. 2019. Alteration of bile acid metabolism by a high-fat diet is associated with plasma transaminase activities and glucose intolerance in rats. J. Nutr. Sci. Vitaminol. (Tokyo). 65: 45–51. [DOI] [PubMed] [Google Scholar]
- 53.Zaborska K. E., Lee S. A., Garribay D., Cha E., and Cummings B. P.. 2018. Deoxycholic acid supplementation impairs glucose homeostasis in mice. PLoS One. 13: e0200908. [DOI] [PMC free article] [PubMed] [Google Scholar]
- 54.Akiyoshi T., Uchida K., Takase H., Nomura Y., and Takeuchi N.. 1986. Cholesterol gallstones in alloxan-diabetic mice. J. Lipid Res. 27: 915–924. [PubMed] [Google Scholar]
- 55.Biddinger S. B., Haas J. T., Yu B. B., Bezy O., Jing E., Zhang W., Unterman T. G., Carey M. C., and Kahn C. R.. 2008. Hepatic insulin resistance directly promotes formation of cholesterol gallstones. Nat. Med. 14: 778–782. [DOI] [PMC free article] [PubMed] [Google Scholar]
- 56.Li T., Francl J. M., Boehme S., Ochoa A., Zhang Y., Klaassen C. D., Erickson S. K., and Chiang J. Y.. 2012. Glucose and insulin induction of bile acid synthesis: mechanisms and implication in diabetes and obesity. J. Biol. Chem. 287: 1861–1873. [DOI] [PMC free article] [PubMed] [Google Scholar]
- 57.Uchida K., Makino S., and Akiyoshi T.. 1985. Altered bile acid metabolism in nonobese, spontaneously diabetic (NOD) mice. Diabetes. 34: 79–83. [DOI] [PubMed] [Google Scholar]
- 58.Haeusler R. A., Pratt-Hyatt M., Welch C. L., Klaassen C. D., and Accili D.. 2012. Impaired generation of 12-hydroxylated bile acids links hepatic insulin signaling with dyslipidemia. Cell Metab. 15: 65–74. [DOI] [PMC free article] [PubMed] [Google Scholar]
- 59.Roda A., Piazza F., Baraldini M., Speroni E., Guerra M. C., Cerre C., and Cantelli Forti G.. 1998. Taurohyodeoxycholic acid protects against taurochenodeoxycholic acid-induced cholestasis in the rat. Hepatology. 27: 520–525. [DOI] [PubMed] [Google Scholar]
Associated Data
This section collects any data citations, data availability statements, or supplementary materials included in this article.


