Abstract
Background
Cox proportional hazard model (CPH) is commonly used in clinical research for survival analysis. In quantitative medical imaging (radiomics) studies, CPH plays an important role in feature reduction and modeling. However, the underlying linear assumption of CPH model limits the prognostic performance. In this work, using transfer learning, a convolutional neural network (CNN) based survival model was built and tested on preoperative CT images of resectable Pancreatic Ductal Adenocarcinoma (PDAC) patients.
Results
The proposed CNN-based survival model outperformed the traditional CPH-based radiomics approach in terms of concordance index and index of prediction accuracy, providing a better fit for patients’ survival patterns.
Conclusions
The proposed CNN-based survival model outperforms CPH-based radiomics pipeline in PDAC prognosis. This approach offers a better fit for survival patterns based on CT images and overcomes the limitations of conventional survival models.
Keywords: Cox proportional hazard model, Radiomics, Convolutional neural network, Survial analysis
Background
In clinical practice, medical imaging plays an increasingly important role in informed decision making of clinicians for disease management. Radiomics is a systematic approach to study the latent information in medical imaging for improved accuracy in prognosis. A typical radiomics study involves image acquisition, feature extraction, feature analysis, and predictive modeling for a clinical outcome such as patient survival [1]. Efforts have been made to standardize quantitative imaging features (radiomic features) by implementing open source libraries such as PyRadiomics [2]. These feature banks contain thousands of hand-crafted formulas, designed to extract the distribution or texture information from medical images. In radiomics studies, a feature reduction method (e.g., principle component analysis) is used to select representative features [3]. The prognostic features are usually determined using Cox proportional hazard model (CPH) [4]. In the past decade, several radiomics features have shown prognostic value in different diseases especially different types of cancer [5–9]. However, the high dimensionality nature of radiomics features makes the feature selection prone to multiple testing, leading to false positives and low performance in the validation cohorts.
As a statistical method, survival models are commonly used in clinical research to identify potential risk factors and predict risks for a variety of clinical outcomes including patients’ overall survivals for different diseases such as cancer. CPH is one of the most commonly used survival analysis tools [10–12]. CPH is a type of semiparametric model that calculates the effects of features (independent variables) on the risk of a certain event (e.g., death) [13]. For example, CPH can measure the effect of tumor size on the risk of death.
The CPH-based survival models can help clinicians make more personalized treatment decisions for individual patients. Traditional CPH models assume that the independent variables make a linear contribution to the model, with respect to time [13]. In many conditions, this assumption oversimplifies the relationships between biomarkers (e.g., radiomic features) and outcomes, especially in cancer diseases with poor prognosis including Pancreatic Ductal Adenocarcinoma (PDAC) [11]. With a limited sample size, the violation of linear assumption may not be obvious. However, as data sizes increase, the violation of linear assumption in CPH models increasingly becomes more obvious and problematic, diminishing the performance and reliability of such models [10–12]. In modern survival modeling approaches, restricted cubic splines have been applied to fix this weakness of CPH models [14, 15]. However, most radiomics studies have failed to address this shortcoming and instead, either they have adopted binary classification methods discarding duration (time to event) information altogether or continued to use conventional CPH Methods [16–21].
The binary classification methods solve the nonlinearity by using a classifier such as Random Forest or Support Vector Machine (SVM) [22, 23]. Although these classifiers perform well in diagnosis and prognosis, they discard the time information in the modeling. For disease with poor prognosis such as pancreatic cancer, the 5-year survival rate is very low (e.g., less than 10% for pancreatic cancer) [24–26]. Consequently, binary predictions only offer limited information for clinicians in designing personalized treatment plans and hence, a nonlinear survival model that takes duration (time to an event such as death) into account to provide useful information on the survival is desired.
A recent development in artificial neural networks (ANNs) has provided an alternative solution for survival modeling. ANNs can learn complex and nonlinear relationships between prognostic features and an individual’s risk for a given outcome [27]. Therefore, the ANNs-based model can provide an improved personalized recommendation based on the computed risk. Nevertheless, previous studies have demonstrated mixed performance for risk-prediction models [27–29]. This may be due to the small sample size and limited feature space leading to ANNs models that are underfitted [28]. To exploit the ANNs architecture and successfully apply them to complex cases, larger datasets are required. Recent work has shown that, given enough sample sizes, ANNs can, in fact, outperform traditional CPH survival models [10–12].
The majority of previous works on deep learning based survival analysis including DeepSurv and NNET-survival are ANNs-based survival models with modified loss function to capture more accurate survival patterns [10, 11]. These models take features (e.g., age, gender, height) as input and return risks for patients at different timepoints. However, feeding radiomics features into these ANNs as input is not the optimal solution due to the multicollinearity issue.
In this research, we used medical images as input, replacing radiomics feature extractors with a Convolutional Neural Network (CNN) architecture to extract disease-specific image features which are associated with survival patterns. As the most well-known architecture in deep learning, CNNs extract imaging features by applying multiple layers of convolution operations to the images. Furthermore, the weights of the convolution filters are finetuned during training via backpropagation process [30, 31]. Thus, given sufficient data, CNNs can be used to extract disease-specific features, which can be used for diagnosis or prognosis purposes [32–35]. Although traditional medical imaging based CNNs use “binary” or “multinomial” classification loss function, the loss function can be modified to also capture the survival patterns [11]. By doing so, CNN can be tuned to extract features that are associated with the risk of the outcome in a certain duration. We hypothesized that the proposed CNN-based Survival (CNN-Survival) model with a modified loss function would outperform conventional radiomics and CPH-based prognosis models.
Methods
Data
Three independent cohorts were used in this study. Cohort 1 consists of publicly available pretreatment CT scans of 422 Non-small cell lung cancer (NSCLC) patients [7]. Cohort 2 has 68 resectable pancreatic adenocarcinoma (PDAC) patients collected from a local hospital from 2008 to 2013. Cohort 3, which is the test data, consists of 30 resectable PDAC patients enrolled in another independent hospital site from 2007 to 2012 [3]. For all the patients in these three independent cohorts, CT scans, annotations (contours) of tumor performed by radiologists, and survival data were available. For PDAC patients, the CT scans were preoperative contrast-enhanced images of resectable patients, and the survival data was collected from the date of surgery until death. CT images from all three cohorts were read from DICOM file without further processing. As CT scans were from different institutions, the image acquisition protocol information (e.g., exact contrast bolus volume, timing, and injection rate) was not consistent over the time period. The institutions’ Research Ethics Boards approved these retrospective studies and all methods were carried out in accordance with relevant guidelines and regulations.
Architecture of the proposed CNN-survival
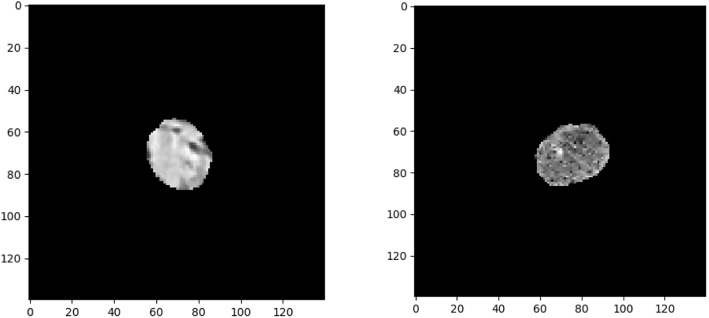
A CNN architecture with six-layered convolutions (CNN-Survival) was trained as shown in Fig. 1. Input images have dimensions of 140 × 140 × 1 (grayscale), which contain the CT images within the manual contours of the tumors (example shown in Fig. 2). All pixels outside of the contoured region were 0 in the 0 to 255 grayscales. All convolutional layers have kernel size of 3 × 3 with 32 filters following by Batch Normalization layers (BN). The first Max Pool layer has pool size of 2 × 2, and the latter two Max Pool layers have pool size of 3 × 3. Through the Max Pool layers, number of trainable parameters was significantly reduced. To avoid overfitting with this small sample size, dropout layers were added after every two convolutional layers with dropout rate at 0.5. Finally, passing through the flatten and dense layer, images were converted into 19 features and finally, survival probabilities for a given time t were calculated.
Fig. 1.
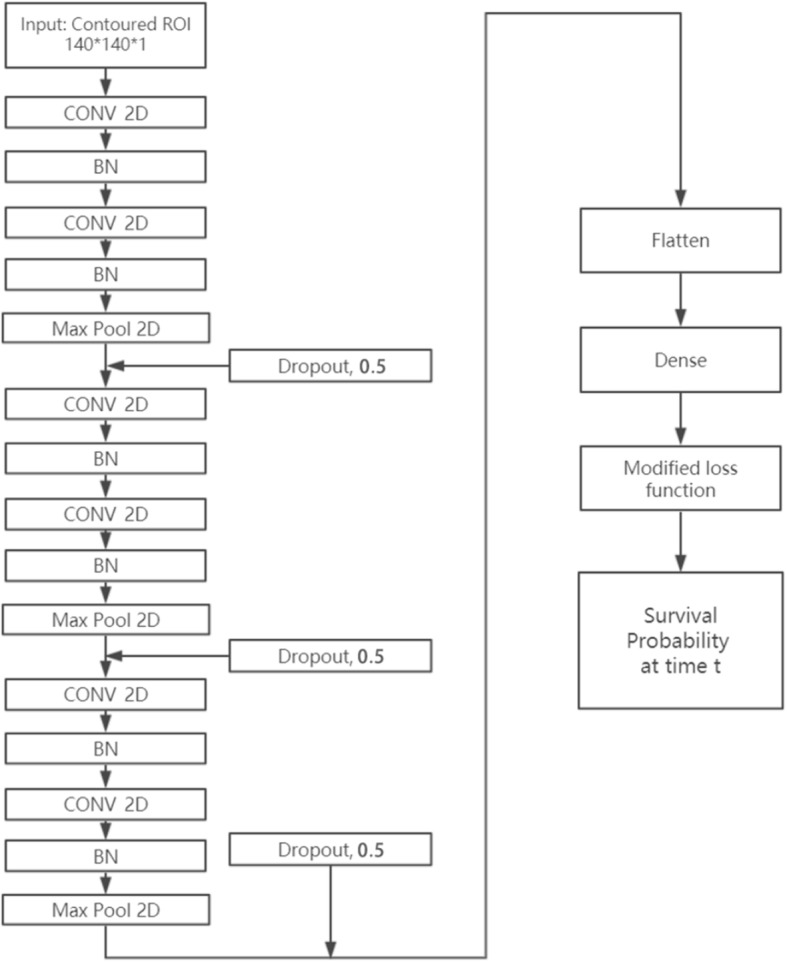
The proposed CNN-Survival architecture: 6-layer CNN, batch normalization, and Max Pooling layers. There are also three dropout layers to control the potential overfitting
Fig. 2.
Example of the input CT images. Left: NSCLC tumor from Cohort 1. Right: PDAC tumor from Cohort 2
Loss function
To better fit the distribution of survival data, a modified loss function, proposed by Gensheimer et al. [11], was applied to the CNN architecture (Eq. 1).
| 1 |
In Equation 1, is the hazard probability for individual i during time interval j. r stands for individuals “in view” during the interval j (i.e., survived in this period) and d means a patient suffered a failure (e.g., death) during this interval [11]. As it can be seen from Equation 1, the left part penalizes if the model gave low hazard for failure (e.g., death), while the right part penalizes if the model gave high hazard for a survived case. The overall loss function is the sum of the losses for each time interval [11].
Training process and transfer learning of CNN-survival
Training a CNN-based survival model needs to finetune a large number of parameters. Given this CNN architecture, there were 73,587 trainable parameters. As such, the larger dataset, cohort 1, was used to pretrain the network. In Cohort 1, 422 patients had 5479 slices containing manually contoured tumor regions. However, the region of interest (ROI) on some of the slices were too small (e.g., less than 250 pixels) to be fed as input to the CNN (shown in Fig. 3). To mitigate this, we ranked slices using their ROI size and pixel intensity and picked the top 2500 slices. This ensured the minimum ROI size of 250 pixels.
Fig. 3.
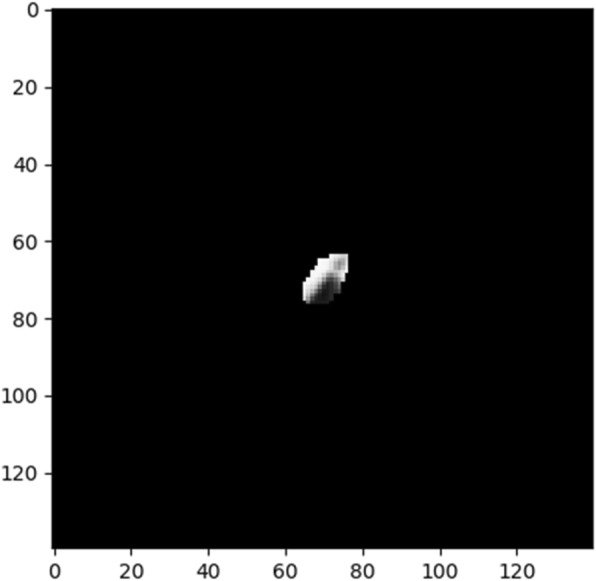
Example of small ROI in Cohort 1
These 2500 slices were fed into the proposed CNN model without augmentation. After training the initial model at learning rate 0.0001 for 50 epochs, all the weights in the pretrained model were frozen except for the final dense layer. Next, 68 patients of Cohort 2 were used to finetune the dense layer (containing 627 parameters) for 20 epochs with learning rate of 0.0001 without augmentation. The finetuning was necessary since Cohort 1 and Cohort 2 have CT images from two different types of cancers (lung and pancreas cancer, respectively) with different survival patterns. After 20 epochs of finetuning in Cohort 2, the final model was tested in Cohort 3. The prognosis performance was measured by two metrics: concordance index (CI) [36] and index of prediction accuracy (IPA) [37]. CI is calculated using Equation 2.
| 2 |
where the indicator function 1a < b = 1 if a < b, and 0 otherwise. Ti is the survival time for subject i. | | is the number of edges in the order graph. f(xi) is the predicted survival time for subject i by model f. Under this formula, concordance index (CI) is the probability of concordance between the predicted and the observed survival [36]. IPA is a recently proposed performance measure for binary and time to event outcomes accounting for both discrimination and calibration, and can identify harmful models as well [37]. IPA of 100% indicates a perfect model, and harmful models will have IPA < 0 [37].
Radiomics and CNN-survival features
In order to systematically compare the performance of CNN-Survival with CPH models and rule out the confounding variable, we built two additional models using CPH. The first model (Model 1: Radiomics features + LASSO-CPH) is a traditional radiomics-based CPH model, which used 1428 2D radiomics features extracted from the manually contoured regions using PyRadiomics library [2] (version 2.0). A LASSO-CPH [38] feature reduction method was used to find prognostic radiomic features in the training cohort (Cohort 2), which were then tested in the test cohort (Cohort 3). The second model (Model 2: Transfer learning features + LASSO-CPH) was trained using the 19 transfer learning features extracted from the last dense layer of the CNN-Survival model. Similar to Model 1, a LASSO-CPH method was used to select prognostic features in Cohort 2 and test them in Cohort 3. Under this setting, Model 1 and Model 2 had the same type of survival function (LASSO-CPH), and hence, the differences in the input data would explain the differences in performance. On the other hand, Model 2 had the same input data as our proposed CNN-Survival (Model 3) as they both used features from the dense layer. Given that, the performance disparities of Model 2 and Model 3 can be explained by the different survival functions where Model 2 uses LASSO-CPH and instead, Model 3 uses the modified loss function to generate survival probabilities for a given time. The performance of all three models was validated in Cohort 3 (test set) at 18 months by concordance index (CI) and index of prediction accuracy (IPA) using R software (version 3.5.3), Survival, Survcomp, and riskRegression library [39–41].
Results
In the traditional radiomics with LASSO-CPH approach (Model 1), an optimal CPH model was trained in Cohort 2 using four features (“gradient_gldm_SmallDependenceEmphasis”, “gradient_glszm_SmallAreaEmphasis”, “original_glszm_LargeAreaLowGrayLevelEmphasis”, and “wavelet. HLH_glszm_HighGrayLevelZoneEmphasis”). This model was tested in cohort 3 for validation with CI and IPA at 0.491 and − 3.80%, respectively. Similarly, another LASSO-CPH model (Model 2) was trained using transfer learning features extracted from Cohort 2. Using three features selected by LASSO-CPH, this model yielded CI and IPA of 0.603 and 4.40%, respectively when validated in Cohort 3. In contrast, the proposed CNN-Survival model (Model 3) achieved CI and IPA of 0.651 and 11.81%, respectively, in Cohort 3, outperforming the previous two CPH-based methods. Table 1 lists the results (IPA and CI) for all three survival models.
Table 1.
Results (IPA and CI) of three survival models for resectable PDAC
| IPA in Cohort 3 (test set) | CI in Cohort 3 (test set) | |
|---|---|---|
| Model 1: Radiomics features + LASSO-CPH | −3.80% | 0.491 |
| Model 2: Transfer learning features + LASSO-CPH | 4.40% | 0.603 |
| Model 3: Proposed CNN-Survival | 11.81% | 0.651 |
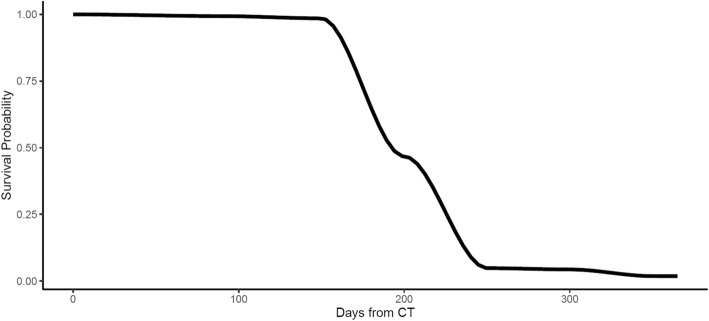
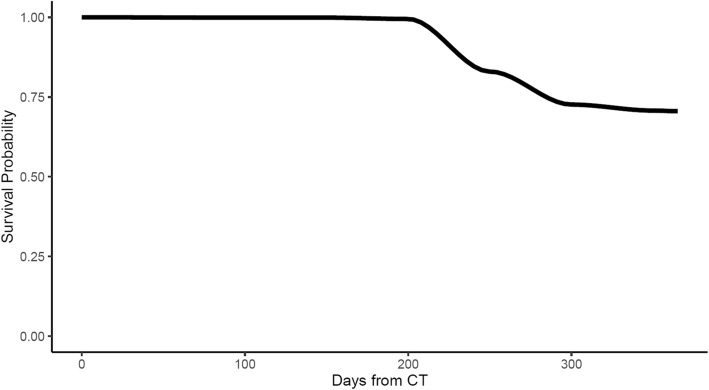
As discussed above, CNN-Survival could depict the survival probability of a patient at a given time. The survival probabilities curves of two patients (one survived versus one deceased) in the test cohort are shown in Fig. 4 and Fig. 5.
Fig. 4.
Survival probability curve generated by the proposed CNN-Survival model for a patient deceased 316 days after surgery
Fig. 5.
Survival probability curve generated by the proposed CNN-Survival for a patient survived more than one year after surgery
For the patient deceased within 1 year after surgery, the survival probability dropped significantly, while for the survived patient, the survival probability stays above 0.5.
Discussion
Using the proposed CNN-Survival model, the prognosis performance was improved, elevating IPA from − 3.80 to 11.81%, and CI from 0.491 to 0.651 compared to a traditional radiomic-based CPH model (Model 1). Even when transfer learning features were used to build a CPH model (Model 2), the proposed CNN-Survival model was still superior (IPA: 11.81% vs 4.40%, CI: 0.651 vs. 0.603). These comparisons illustrate that transfer learning features outperform radiomics features (Model 2 vs. Model 1) and the proposed CNN-Survival model using a modified loss function outperforms both CPH-based models (Model 3 vs. Model 1 and 2). Deep learning networks provide flexibility in modifying the dimension of feature space and loss function, enabling us to extract disease-specific features and build more precise models. Using a CNN-based survival model, we showed that, with the help of transfer learning, deep learning architectures can outperform the traditional pipeline in a typical small sample size setting when modeling the survival for resectable PDAC patients. The proposed transfer learning-based CNN-Survival model has significant potential to enable researchers to pretrain a model using images from common cancers with larger datasets and transfer this model to target rare cancers. Transfer learning-based CNN-Survival model mitigates the needs for large sample size, allowing the survival model to be applied to a wide range of cancer sites.
The proposed CNN-Survival model provides better prognostic performance compared to the traditional radiomics analytic pipeline (IPA 11.81% versus − 3.80%). Although there was no prior publications reporting IPA for PDAC biomarkers, the IPA of our proposed CNN-Survival is comparable to the typical IPA for other survival models [37]. From the feature extraction perspective, parameters in a CNN can be updated during backpropagation, allowing to extract a large number of features that are associated with the target outcome. For feature analysis, the CNN-Survival model avoids the multiple testing, which is a significant issue in the conventional radiomics analytic pipeline. Finally, with the modified loss function, CNN-Survival model does not rely on the linear assumption, making it suitable for more real-world scenarios. These advantages contributed to the improved performance of the proposed model. Compared to transfer learning features-based CPH model (Model 2), which used the same feature sued by CNN-Survival model (Model 3), the proposed CNN-Survival had higher IPA (11.89% versus 4.40%). Given that these two models had the same data input, this result indicates that the loss function in CNN-Survival model outperforms the traditional linear CPH which is commonly used in radiomic studies.
In this research, due to the small sample size in PDAC cohorts, the proposed CNN-Survival model was not optimal. We used CT images from 68 patients to finetune the pretrained CNN-Survival model and tested in another 30 patients of an independent cohort. Although through transfer learning, most of the parameters were trained using the pretrained cohort, there were still 627 parameters in the dense layer needed to be modified through finetuning. Thus, if a larger dataset was available for finetuning, performance may be further improved. Additionally, the pretrained dataset are CT images from Non-Small Cell Lung Cancer (NSCLC) patients. Although it is the largest open source dataset we could find, NSCLC has different biological traits and survival patterns compared to PDAC. In future research, using a similar pretrained domain and a larger finetuning cohort, further improvement may be achieved. A proper validation of the proposed model is required through clinical validation, which is beyond the scope of this work.
In this study, using CT images from three independent cohorts, we validated the proposed CNN-Survival model with the modified loss function proposed by Gensheimer et al. [11]. We showed that the proposed CNN-Survival model outperformed and avoided the limitations of the conventional radiomics-based CPH model in a real-world small sample size setting. Further validation of this loss function can be performed for other types of diseases through transfer learning. The proposed CNN-Survival model has the potential to be a standardized survival model in quantitative medical imaging research field.
Conclusions
The proposed CNN-based survival model outperforms traditional CPH-based radiomics and transfer learning pipelines in PDAC prognosis. This approach offers a better fit for survival patterns based on CT images and overcomes the limitations of conventional survival models.
Acknowledgements
We sincerely appreciate all the patients who participated in this study.
Abbreviations
- ANN
Artificial Neural Networks
- BN
Batch Normalization
- CI
Concordance Index
- CNN
Convolutional Neural Network
- CPH
Cox Proportion Hazard
- CT
Computerized Tomography
- NSCLC
Non-Small Cell Lung Cancer
- PDAC
Pancreatic Ductal Adenocarcinoma
- ROI
Region of Interest
- SVM
Support Vector Machine
Authors’ contributions
YZ, MAH, and FK contributed to the design of the concept. EML, SG, PK, MAH, and FK contributed in collecting and reviewing the data. YZ and FK contributed to the design and implementation of quantitative imaging feature extraction and machine learning modules. All authors contributed to the writing and reviewing of the paper. All authors read and approved the final manuscript. FK and MAH are co-senior authors for this manuscript.
Funding
This study was conducted with the support of the Ontario Institute for Cancer Research (OICR, PanCuRx Translational Research Initiative) through funding provided by the Government of Ontario. The funding body had no role in the design of the study, collection, analysis, and interpretation of data, or in writing the manuscript.
Availability of data and materials
The datasets of Cohort 2 and Cohort 3 analyzed during the current study are available from the corresponding author on reasonable request pending the approval of the institution(s) and trial/study investigators who contributed to the dataset.
Ethics approval and consent to participate
Cohort 1 is publicly available and can be downloaded from: https://wiki.cancerimagingarchive.net/. For Cohort 2, University Health Network Research Ethics Boards approved the retrospective study and informed consent was obtained. For Cohort 3, the Sunnybrook Health Sciences Centre Research Ethics Boards approved the retrospective study and waived the requirement for informed consent.
Consent for publication
Not Applicable.
Competing interests
FK is an associated editor of BMC Medical Imaging.
Footnotes
Publisher’s Note
Springer Nature remains neutral with regard to jurisdictional claims in published maps and institutional affiliations.
References
- 1.Khalvati F, Zhang Y, Wong A, Haider MA. Encyclopedia of Biomedical Engineering. 2019. Radiomics; pp. 597–603. [Google Scholar]
- 2.Van Griethuysen JJM, et al. Computational radiomics system to decode the radiographic phenotype. Cancer Res. 2017;77:e104–e107. doi: 10.1158/0008-5472.CAN-17-0339. [DOI] [PMC free article] [PubMed] [Google Scholar]
- 3.Khalvati F, et al. Prognostic value of CT Radiomic features in Resectable pancreatic ductal adenocarcinoma. Nat Sci Reports. 2019. 10.1038/s41598-019-41728-7. [DOI] [PMC free article] [PubMed]
- 4.George B, Seals S, Aban I. Survival analysis and regression models. J Nucl Cardiol. 2014;21:686–694. doi: 10.1007/s12350-014-9908-2. [DOI] [PMC free article] [PubMed] [Google Scholar]
- 5.Keek SA, Leijenaar RT, Jochems A, Woodruff HC. A review on radiomics and the future of theranostics for patient selection in precision medicine. Br J Radiol. 2018;91:20170926. doi: 10.1259/bjr.20170926. [DOI] [PMC free article] [PubMed] [Google Scholar]
- 6.Zhang Y, Oikonomou A, Wong A, Haider MA, Khalvati F. Radiomics-based prognosis analysis for non-small cell lung Cancer. Nat Sci Reports. 2017;7(46349). 10.1038/srep16630. [DOI] [PMC free article] [PubMed]
- 7.Aerts HJ, et al. Decoding tumour phenotype by noninvasive imaging using a quantitative radiomics approach. Nat Commun. 2014;5:4006. doi: 10.1038/ncomms5006. [DOI] [PMC free article] [PubMed] [Google Scholar]
- 8.Aerts Hugo J. W. L. The Potential of Radiomic-Based Phenotyping in Precision Medicine. JAMA Oncology. 2016;2(12):1636. doi: 10.1001/jamaoncol.2016.2631. [DOI] [PubMed] [Google Scholar]
- 9.Haider MA, Vosough A, Khalvati F, Kiss A, Ganeshan B, Bjarnason GA. CT texture analysis: a potential tool for prediction of survival in patients with metastatic clear cell carcinoma treated with sunitinib. Cancer Imaging. 2017;17(1). 10.1186/s40644-017-0106-8. [DOI] [PMC free article] [PubMed]
- 10.Katzman J, et al. DeepSurv: Personalized Treatment Recommender System Using A Cox Proportional Hazards Deep Neural Network. BMC Med Res Methodol. 2016. 10.1186/s12874-018-0482-1. [DOI] [PMC free article] [PubMed]
- 11.Gensheimer MF, Narasimhan B. A Scalable Discrete-Time Survival Model for Neural Networks. PeerJ. 2019;7:e6257. doi: 10.7717/peerj.6257. [DOI] [PMC free article] [PubMed] [Google Scholar]
- 12.Ching T, Zhu X, Garmire LX. Cox-nnet: an artificial neural network method for prognosis prediction of high-throughput omics data. PLoS Comput Biol. 2018;14:e1006076. doi: 10.1371/journal.pcbi.1006076. [DOI] [PMC free article] [PubMed] [Google Scholar]
- 13.Cox D. R. Regression models and life-tables. J Royal Stat Soc. 1972;34:187–220. [Google Scholar]
- 14.Zhang Zhongheng, Kattan Michael W. Drawing Nomograms with R: applications to categorical outcome and survival data. Annals of Translational Medicine. 2017;5(10):211–211. doi: 10.21037/atm.2017.04.01. [DOI] [PMC free article] [PubMed] [Google Scholar]
- 15.Borucka J. Extensions of Cox model for non-proportional hazards purpose. Ekonometria. 2014;3(3(45). 10.15611/ekt.2014.3.07.
- 16.Huang Yanqi, Liu Zaiyi, He Lan, Chen Xin, Pan Dan, Ma Zelan, Liang Cuishan, Tian Jie, Liang Changhong. Radiomics Signature: A Potential Biomarker for the Prediction of Disease-Free Survival in Early-Stage (I or II) Non—Small Cell Lung Cancer. Radiology. 2016;281(3):947–957. doi: 10.1148/radiol.2016152234. [DOI] [PubMed] [Google Scholar]
- 17.Isensee F, Kickingereder P, Wick W, Bendszus M, Maier-Hein KH. International MICCAI Brainlesion Workshop. Cham: Springer; 2017. Brain Tumor Segmentation and Radiomics Survival Prediction: Contribution to the BRATS 2017 Challenge; pp. 287–297. [Google Scholar]
- 18.Hawkins S, et al. Predicting malignant nodules from screening CT scans. J Thorac Oncol. 2016;11:2120–2128. doi: 10.1016/j.jtho.2016.07.002. [DOI] [PMC free article] [PubMed] [Google Scholar]
- 19.Chakraborty J, et al. CT radiomics to predict high-risk intraductal papillary mucinous neoplasms of the pancreas. Med Phys. 2018;45:5019–5029. doi: 10.1002/mp.13159. [DOI] [PMC free article] [PubMed] [Google Scholar]
- 20.Cozzi L, et al. Computed tomography based radiomic signature as predictive of survival and local control after stereotactic body radiation therapy in pancreatic carcinoma. PLoS One. 2019;14:e0210758. doi: 10.1371/journal.pone.0210758. [DOI] [PMC free article] [PubMed] [Google Scholar]
- 21.Lao J, et al. A deep learning-based Radiomics model for prediction of survival in Glioblastoma Multiforme. Sci Rep. 2017;7:10353. doi: 10.1038/s41598-017-10649-8. [DOI] [PMC free article] [PubMed] [Google Scholar]
- 22.Breiman L. Random Forests. 2001. pp. 1–33. [Google Scholar]
- 23.Hearst MA, Dumais ST, Osman E, Platt J, Scholkopf B. Support vector machines. IEEE Intell Syst. 1998;13:18–28. doi: 10.1109/5254.708428. [DOI] [Google Scholar]
- 24.Adamska Aleksandra, Domenichini Alice, Falasca Marco. Pancreatic Ductal Adenocarcinoma: Current and Evolving Therapies. International Journal of Molecular Sciences. 2017;18(7):1338. doi: 10.3390/ijms18071338. [DOI] [PMC free article] [PubMed] [Google Scholar]
- 25.Foucher ED, et al. Pancreatic ductal adenocarcinoma: a strong imbalance of good and bad immunological cops in the tumor microenvironment. Front Immunol. 2018;9:1044. doi: 10.3389/fimmu.2018.01044. [DOI] [PMC free article] [PubMed] [Google Scholar]
- 26.Stark Alexander P., Sacks Greg D., Rochefort Matthew M., Donahue Timothy R., Reber Howard A., Tomlinson James S., Dawson David W., Eibl Guido, Hines O. Joe. Long-term survival in patients with pancreatic ductal adenocarcinoma. Surgery. 2016;159(6):1520–1527. doi: 10.1016/j.surg.2015.12.024. [DOI] [PMC free article] [PubMed] [Google Scholar]
- 27.Mariani L, et al. Prognostic factors for metachronous contralateral breast cancer: a comparison of the linear Cox regression model and its artificial neural network extension. Breast Cancer Res Treat. 1997;44:167–178. doi: 10.1023/A:1005765403093. [DOI] [PubMed] [Google Scholar]
- 28.Katzman JL, et al. DeepSurv: personalized treatment recommender system using a Cox proportional hazards deep neural network. BMC Med Res Methodol. 2018;18:24. doi: 10.1186/s12874-018-0482-1. [DOI] [PMC free article] [PubMed] [Google Scholar]
- 29.Xiang A, Lapuerta P, Ryutov A, Buckley J, Azen S. Comparison of the performance of neural network methods and Cox regression for censored survival data. Comput Stat Data Anal. 2000;34:243–257. doi: 10.1016/S0167-9473(99)00098-5. [DOI] [Google Scholar]
- 30.LeCun Y, Bengio Y, Hinton G. Deep learning. Nature. 2015;521:436–444. doi: 10.1038/nature14539. [DOI] [PubMed] [Google Scholar]
- 31.Krizhevsky A, Sutskever I, Hinton GE. InAdvances in neural information processing systems. 2012. Imagenet classification with deep convolutional neural networks; pp. 1097–1105. [Google Scholar]
- 32.Shin H-C, et al. Deep convolutional neural networks for computer-aided detection: CNN architectures, Dataset Characteristics and Transfer Learning. IEEE Trans Med Imaging. 2016;35:1285–1298. doi: 10.1109/TMI.2016.2528162. [DOI] [PMC free article] [PubMed] [Google Scholar]
- 33.Tajbakhsh N, et al. Convolutional neural networks for medical image analysis: full training or fine tuning? IEEE Trans Med Imaging. 2017;35:1299–1312. doi: 10.1109/TMI.2016.2535302. [DOI] [PubMed] [Google Scholar]
- 34.Yasaka K, Akai H, Abe O, Kiryu S. Deep learning with convolutional neural network for differentiation of liver masses at dynamic contrast-enhanced CT: a preliminary study. Radiology. 2018;286:887–896. doi: 10.1148/radiol.2017170706. [DOI] [PubMed] [Google Scholar]
- 35.Yamashita R, Nishio M, Do RKG, Togashi K. Convolutional neural networks: an overview and application in radiology. Insights Imaging. 2018;9:611–629. doi: 10.1007/s13244-018-0639-9. [DOI] [PMC free article] [PubMed] [Google Scholar]
- 36.Raykar VC, Steck H, Krishnapuram B, Dehing-Oberije C, Lambin P. InAdvances in neural information processing systems. 2008. On Ranking in Survival Analysis: Bounds on the Concordance Index; pp. 1209–1216. [Google Scholar]
- 37.Kattan MW, Gerds TA. The index of prediction accuracy: an intuitive measure useful for evaluating risk prediction models. Diagnostic Progn Res. 2018;2(1). 10.1186/s41512-018-0029-2. [DOI] [PMC free article] [PubMed]
- 38.Tibshirani R. Regression shrinkage and selection via the Lasso. J R Stat Soc Ser B. 1996;58:267–288. [Google Scholar]
- 39.Therneau TM, Grambsch PM. Modeling Survival Data: Extending the Cox Model. Springer, New York; 2000. ISBN 0-387-98784–3.
- 40.Schröder Markus S., Culhane Aedín C., Quackenbush John, Haibe-Kains Benjamin. survcomp: an R/Bioconductor package for performance assessment and comparison of survival models. Bioinformatics. 2011;27(22):3206–3208. doi: 10.1093/bioinformatics/btr511. [DOI] [PMC free article] [PubMed] [Google Scholar]
- 41.Gerds TA, Ozenne B. riskRegression: Risk Regression Models and Prediction Scores for Survival Analysis with Competing Risks. R package version 2019.11.03. https://CRAN.R-project.org/package=riskRegression.
Associated Data
This section collects any data citations, data availability statements, or supplementary materials included in this article.
Data Availability Statement
The datasets of Cohort 2 and Cohort 3 analyzed during the current study are available from the corresponding author on reasonable request pending the approval of the institution(s) and trial/study investigators who contributed to the dataset.


