Abstract
Respiratory rate is an extremely important but poorly monitored vital sign for medical conditions. Current modalities for respiratory monitoring are suboptimal. This paper presents a proof of concept of a new algorithm using a contactless ultra-wideband (UWB) impulse radar-based sensor to detect respiratory rate in both a laboratory setting and in a two-subject case study in the Emergency Department. This novel approach has shown correlation with manual respiratory rate in the laboratory setting and shows promise in Emergency Department subjects. In order to improve respiratory rate monitoring, the UWB technology is also able to localize subject movement throughout the room. This technology has potential for utilization both in and out of the hospital environments to improve monitoring and to prevent morbidity and mortality from a variety of medical conditions associated with changes in respiratory rate.
1. Introduction
Respiratory rate (RR) is a critical vital sign that is used to assess all hospitalized patients. Respiratory rate abnormalities are among the first indicators of severe pathology, including sepsis, metabolic acidosis, respiratory distress, and drug overdoses. [1] Patients with high respiratory rates have been found to have increased morbidity and one study even found high respiratory rates to correlate with risk for in-hospital cardiac arrest. [2] Despite this critical importance, respiratory rate is inconsistently and inaccurately documented in hospitalized patients, earning recognition as the “neglected vital sign.” [3]
The most common current techniques for respiratory rate measurement include manual respiratory rate counting and transthoracic impedance plethysmography (which measures chest wall movement through cardiac telemetry electrodes); both techniques are suboptimal. Manual counting is time consuming and cannot practically be done in a continuous fashion, making detection of subtle changes difficult. [4,5] Transthoracic impedance plethysmography is susceptible to erroneous measurements, as patient movements can lead to significant interference. [6,7] Improving accuracy of respiratory monitoring will increase early detection of significant changes in clinical status, such as bradypnea in opioid overdose, and prevent adverse outcomes.
To enable a more simplified and accurate method of respiratory rate monitoring in the clinical setting, we propose the use of a contactless sensor system using an Ultra-Wideband (UWB) radio transceiver capable of detecting subtle movements in subjects (e.g. as chest wall rise). The overarching goal is to improve respiratory rate monitoring in order to prevent morbidity and mortality both in and out of the hospital setting. As an initial step, we present a proof of concept manuscript to explore the contactless sensor system’s capability to detect respiratory rates in subjects in both controlled laboratory and real-world clinical settings compared to current gold standards.
2. Methods
Respiratory rate monitoring in any indoor setting needs two major processes, namely localization and RR estimation in that localized area. At first, the localization algorithm tracks the subject in an indoor space and then the RR estimation algorithm focuses around the tracked position where the subject has settled down. Localization in the clinical environment such as the Emergency Department (ED) is important because in the emergency room we can track other individuals’ (doctors, technicians, nurses, visitors etc.) location in order to choose the appropriate radar(s) in the case of blockage of any particular radar from measuring target subjects respiratory rate.
2.1. General Study Protocol
The study took place in two phases: The first phase was in a controlled setting (laboratory), and the second was in a clinical environment (ED).
2.2. Hardware
In our study, UWB Impulse Radar was used for non-contact and continuous monitoring of patient's macromovement (large motion and limb-level motions) as well as micro-movements (chest wall motion that correlates with respiration).
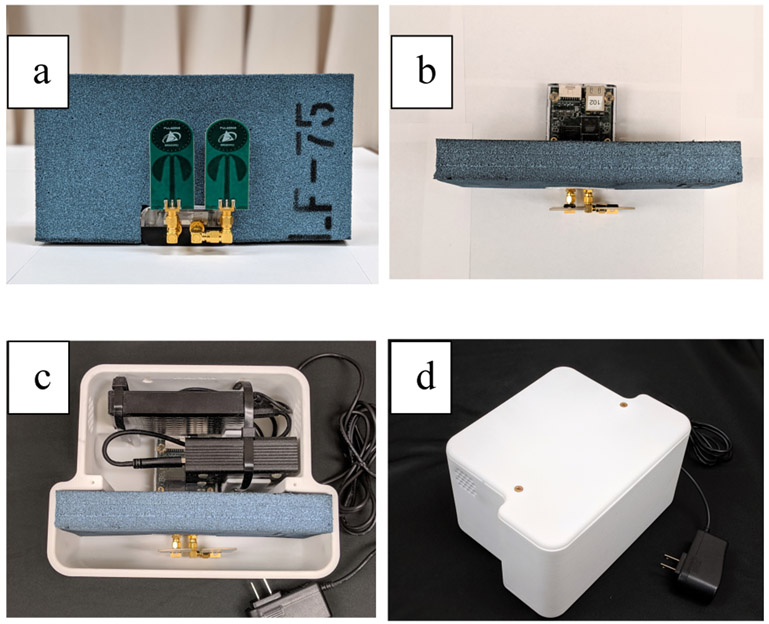
For the data collection described here, we used the commercially available UWB radar units PulsON® 440 (P440) Monostatic Radar Module (MRM) as shown in Figure 1(a). Each sensor has an UWB transmitter and an UWB receiver. The transmitter and receiver operating band is generally, 3.1 to 4.8 GHz with a center frequency of 4.3 GHz. We built an ultra-wide band radar array with 3 monostatic radars placed on 3 walls of the room. The three radars use sperate code channels to avoid interference among each other. The UWB radar repetitively transmits short duration electromagnetic impulses having extremely low power and a very large bandwidth. These impulses incident upon both stationary and moving objects and the reflected pulses travel back to the receiver of the UWB radar. The reflected pulses go through some signal processing steps in order to remove clutter (reflections from static objects such as furniture, walls etc.) and focus on the target’s motion based on the round-trip propagation delay of the pulses called time-of-flight (ToF). The signal processing steps for clutter removal include band-pass filtering of the raw data and envelope detection of the motion filtered data. The target’s range/distance can be easily calculated from the ToF by multiplying it with the speed of light (electromagnetic wave).
Figure 1:
(a) P440 MRM radar module with LF-75 absorber behind the antenna (b) Top view of the radar with absorber (c) Radar Box with Raspberry Pi and a hard disk drive (d) enclosed radar box
Each radar unit consists of two omni directional antennas one for transmitting the radar pulses and the other for receiving the reflections. As only the returns arriving from inside the room are useful, we want to block the returns from behind the antenna by using an absorber material. For this purpose, we use absorber material of dimension 8.5” × 4.5” × 1.13” which provides attenuation of −20dB for a frequency range of 2.5GHz to 40GHz. The radar box comprises one PulseON 440 UWB radar unit, one piece of absorber material placed 1” behind the antennas, one Raspberry Pi unit and one hard disk drive to store the data locally. All these components are accommodated in a 3-D printed T shaped box as shown in Figure 1(b-d). The Raspberry Pi is connected with the radar module and the storage device. The Raspberry Pi works as a single board computer which runs a C program to initiate the radar data collection and stores them in the hard drive every minute. The program starts at the boot as soon as the device is connected to power supply which makes the radar box easy to use as it requires no prior technical knowledge.
2.3. Laboratory Protocol
The laboratory protocol consisted of two experiments. The first one aimed at localization of the subject while moving in different predefined paths. The predefined paths involve walking in patterns such as the letter ‘U’ or the number ‘4’ etc. The second experiment was performed to validate the breathing rate estimation. We used standard metronome for the sake of obtaining ground truth breathing rate. The bed position, the room dimension, and the position of the radars was kept constant for all the experiments. The subjects were asked to synchronize their breathing with the sound of the metronome while lying on the bed. Each subject underwent three specific rhythm of breathing phases: 10 breaths per minute, 15 breaths per minute, and 20 breaths per minute. During each rhythm of breathing phase, the radars captured the corresponding chest and abdominal movement of the subject. In our algorithm we leverage the prior knowledge of the subjects’ position which is the bed position. It is essential for our current algorithm that the subject be stationary during the breathing rate detection period. The coarse position of the subject while lying stationary, i.e. the approximate position of the bed, is also important for us to better estimate the breathing rate. The orientation of the bed provides the prior information and helps choose one radar or a subset of radars to focus in the right regions in order to get the breathing signal.
2.4. Natural Environment Testing
After optimization in the laboratory setting, the device was tested on subjects in a natural clinical environment (ED room during routine clinical care).
The study site was an urban, tertiary care medical center and level one trauma center. The ED treats approximately 135,000 patients per year and provides care to a significant volume of high-acuity patients. We included patients in the ED who were greater than or equal to 18 years old, were monitored by cardiac telemetry for respiratory rate, and were able to provide informed consent. Patients were excluded from participation if they were pregnant or currently under police custody.
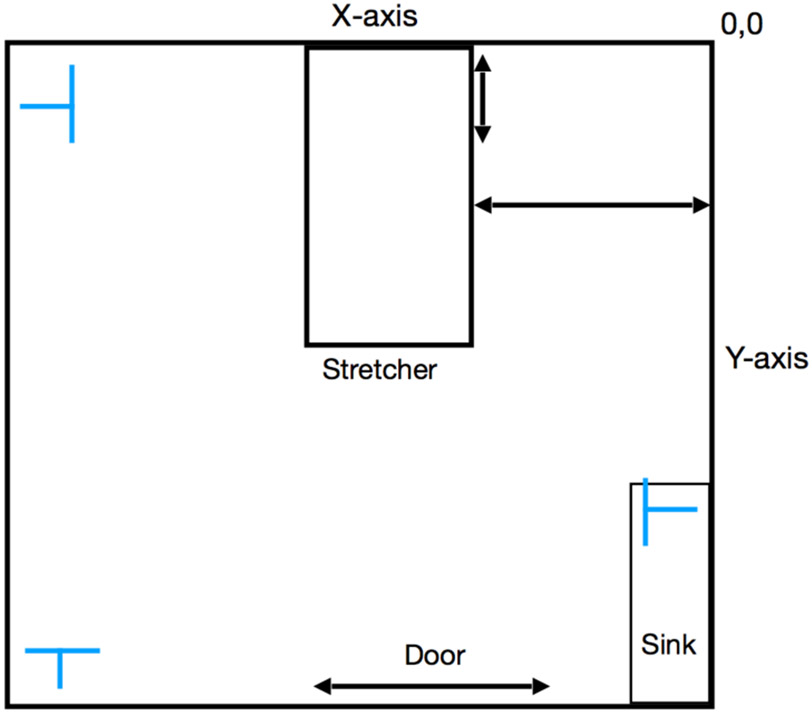
Once the subject provided informed consent, basic demographic and relevant clinical information (age, sex, race, ethnicity, body mass index, medical history, current and administered medications, chief complaint, and diagnosis) was recorded. Measurements were taken of the room and radar placement. General descriptions were recorded of the patient’s clothing, equipment in the room, furniture, and number and location of people in the room (Figure 2).
Figure 2.
Room layout, the letter T indicates sensor placement.
Three radar modules were placed in the room with the subject for two hours, during which time respiratory rates were collected from telemetry monitors and by manual counting at 15-minute intervals. Since movement of the subject is known to interfere with accurate respiratory monitoring, the study also monitored and quantified subject movement through a commercially available, wrist worn sensor, which captures accelerometer data (E4, Empatica, Milan, Italy). The E4 was placed on the subjects’ nondominant wrist at the beginning of the 2-hour time frame. Movement of other individuals into and out of the room as well as any significant events were recorded during the observation period.
2.5. Localization Method
2.5.1. UWB Signal Modeling
A received signal at the UWB receiver during any kth scan can be expressed as the following equation,
| (1) |
Here, s(t) is the transmitted pulse, αn,k and τη- represent the amplitude and the propagation delay respectively of the nth path and kth scan number. w(t) denotes the additive noise from the channel.
As mentioned earlier the received signal contains reflections from both the target and the clutter, the received signals can be modeled as following discretization,
| (2) |
where, received signal r[n] is comprised of reflections from the target rt[n] and reflections from the static clutter rc[n]. These clutter signals have to be removed before performing any localization techniques.
2.5.2. Clutter Removal
There are several techniques available for clutter removal in the literature including exponential averaging [8], Singular Value Decomposition [9][10], Principle Component Analysis [11], and Independent Component Analysis [11]. Some of which are computationally heavy. We apply a simple clutter rejection technique which comprises background subtraction, band pass filtering, motion filtering and envelope detection. Background subtraction is performed by first averaging over the first few scans (e.g. first 100 scans) where there are no targets present in the room. Then the mean is subtracted from every future scan to reject the clutter. Even with this background subtraction there may still be some dynamic clutter (e.g a door opening or closing, a fan moving, vibration from the air conditioning unit). These unwanted signals are further filtered with a 3rd order Infinite Impulse Response (IIR) band pass filter. After that the band pass signal is further motion filtered with a four tap FIR filter. The filter coefficients and the filtered signal equation are provided as follows:
| (3) |
| (4) |
After band pass and motion filtering the scan envelope is detected by creating in phase and quadrature components by multiplying each scan by a low frequency cosine and sine respectively. The In phase and quadrature components are than low pass filtered with a 6th order IIR filter. The envelope is then calculated by taking the square root of the sum of squares of in phase and quadrature components.
2.5.3. Thresholding
After the envelope detection of the motion filtered signal one can observe the presence and movement of human body in the waterfall curve. By plotting a 3D plot of the envelope detected signal we can decide a threshold value for tracking the moving individual over time. This threshold can be different for different radars depending on farthest location of the subject from the radar location. We used an optimal empirical value after some trial and error which is best suited for our given room dimension. In a given time instant, the range bins at which the signal strength is greater than the threshold determines the radial distance of the individual from the corresponding radar. UWB impulse radar (IR) can only provide range information based on ToF of the received pulses. For this reason, localization in a 2D plane via UWB-IR requires more than one radar.
2.5.4. Time Synchronization
In order to localize and track a moving person, we need to synchronize consecutive observations of the target individual with their location. Therefore, time synchronization of all three radars’ observations is crucial. Using the provided Unix timestamps from each radar we synchronized the envelope detected signals from all the three radars before applying any localization techniques.
2.5.5. Trilateration
Trilateration technique [12] uses only the distance measurements to localize the target. After getting the synchronized consecutive observations of the three radars, the target range bins are obtained through thresholding. Now one can draw circles using this range as radius and the corresponding radar position as the center. The intersection of these circles will provide the estimated location of the target in a 2D plane. However, it is expected to have multiple circles drawn for one radar for a particular time instant due to multiple range bins (human target cannot be considered as a single point). This also depends on the window size and window shift taken for analysis. Larger window size results in more radar detections. In our localization experiments the window size is taken 0.25 seconds with a window shift of half of the window size. Therefore, there would be multiple intersection points for a single target. A geometric interpolation is used to estimate target position using a properly created cluster of circle intersections. The geometric centroid of the cluster is then the estimated location of the target individual.
2.5.6. Shadow/ Mirror Location Fallacy
In case of localization using only two radars in adjacent walls, shadow/mirror points might appear because two circles intersect twice in two different locations. This mirror point does not appear in cases of three radars. The mirror location can easily be avoided by incorporating the room measurements (the intersection falling outside of the room dimension should be discarded). If two intersections are still available (which might occur in case of short radii) then the intersection closest to the previous observed location should be selected, discarding the other one.
2.5.7. Kalman Filtering
For improving the localization and tracking estimation we used the Kalman filter [13]. It is an iterative approach used to predict the future state of linear dynamic system given the current observation and the previous state. In our case we use localization and tracking of an individual in an indoor space using Kalman filtering in 2-D. The trilateration followed by clustering and geometric centroid estimation works as an input to the Kalman filter. As the ED room is quite small compared to other indoor scenarios, we use a constant velocity linear model as opposed to non-linear models like Extended Kalman Filter [14] or Unscented Kalman Filer [15]. Below we set up a linear system defined by the kinematics equation of the target individuals’ motion,
For a 2-dimensional estimation, we have 2 sets of kinematics equations one for each dimension at any given iteration:
| (5) |
| (6) |
| (7) |
| (8) |
Here, x and y denote the position or state, u denote velocity and a is the acceleration. Now combining the 2 sets of equations eq. (5 - 8) into matrix following format eq. (9) for the state update,
| (9) |
| (10) |
The matrix A, B and Ex are defined in the following way to match with the original kinematics equations in 2-D.
Next, we define the measurement update by the following eq. (11):
| (11) |
as measure the position in the 2 dimensions not the velocity.
Now the predicted covariance matrix is defined by
| (12) |
Then the Kalman gain is denoted by the following expression,
| (13) |
Finally, we update our state estimation and the error covariance for the next iteration.
Update state estimation,
| (14) |
Update error covariance,
| (15) |
This is a constant velocity model which avoids modeling for the acceleration. However, the localization estimation can further be further smoothed using a Rauch–Tung–Striebel (RTS) smoother [16] which is a fixed interval filter and uses Kalman filtered data as a forward pass over the interval.
2.6. Respiratory Rate Estimation Method:
In the laboratory setting we employed two methods to estimate respiratory rate from the sensor data. The first technique involves taking the Fast Fourier Transform (FFT) of the slow time samples of the radar signal in the traversed range bins of interest (the range bins associated to the position of bed with respect to radar). Before performing FFT we must transform the 2-D radar scans resulted from multiple focused range bins over the time window of interest into a 1-D time series. This transformation is crucial as we want to preserve the breathing information as well as also reduce the dimension of the data. For this purpose, we use taking the maximum of each scan over all the focused range bins. Thus, we get a single value for each scan and a time series over a defined window size. This method happens to preserve the breathing information.
A windowing of 30 seconds with a window-shift of 3 seconds is maintained to ensure correct breathing estimation in any given time of the observation. The sensor raw data is filtered with a band pass butter-worth filter having a lower cutoff frequency of 6 breaths per minute and a higher cut off frequency of 30 breaths per minute. The filtering helps get rid of the dc components and the high frequency clutters present in the RR signal.
The ED room scenario is more convoluted due to the fast nature of emergency events and the abrupt manner of the response and recovery. The subject is not always alone in the room and not necessarily stationary. At any given time, the subject might be accompanied by the ED doctor, nurse, technician or visitor, creating noisier signals. In an event of entry or exit of a second individual, there is a possibility that the second person is blocking one of the radars, which may cause false estimation of the respiration rate. Our localization algorithm comes into play in such a scenario. According to the estimated location of the second individual, the RR estimation algorithm can remove the blocked radar for calculating the breathing rate.
2.6.1. Radar Fusion:
In a multi-person scenario, movement of individuals other than the target present in the room interferes with the signal significantly. In both single and multi-person scenarios, the movement of the target also disturbs the respiratory signal captured at the radar. Due to the movements of the target as well as the other individual, the signal gets distorted and the radar returns are not pure breathing signals. In order to fuse all the radars’ captured signal for a better estimation of RR we employ Independent Component Analysis [17]. For any given window, all the radar returns (the 1D time series) are fed into the ICA algorithm to get 3 independent and possibly pure components. One of the components is supposed to be the true respiration signal. Now taking the FFT of all the 3 components gives us information about which component to choose. Again, we apply a band pass filtering to each component with the cut off frequencies in the normal human breathing range i.e. 6 breaths per minute to 30 breaths per minute. The component with the strongest FFT peak will be the best candidate for the respiration signal. The results section describes more about the effect of ICA and subsequent FFT on the individual radars.
3. Results
3.1. Localization Results from Lab data:
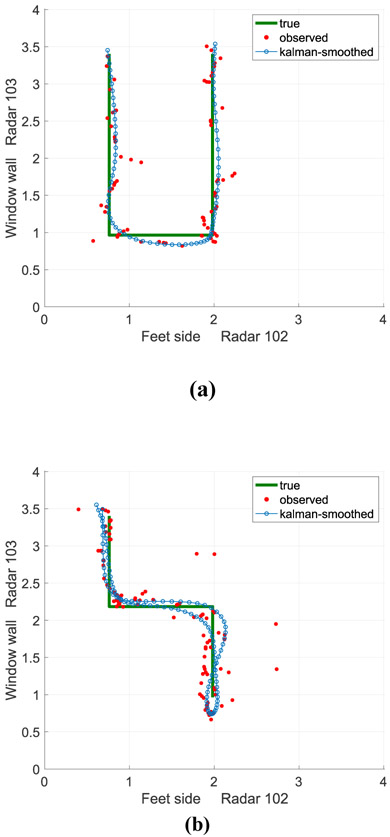
In the laboratory setting we have a 4m × 4m room where the subject walks in a designated path. In Fig. 3(a) the subject took a U shape without returning to the original position and in Fig. 3(b) the subject takes a ‘4’ shape path and returns to the starting position. The green line shows the true path and the red dots correspond to the observed location from radar using trilateration method. The blue path in both the figures shows the Kalman filtered and smoothed locations of the individual. It is interesting to observe that the Kalman filtering and smoothing is robust to outliers (some of the red dots which are way of the original path). These localization results give us confidence about localizing in a clinical environment.
Figure 3:
Single Person Tracking: Walking in different patterns (a) Shape: U (b) Shape: Four
3.2. Localization Results from ED Room data:
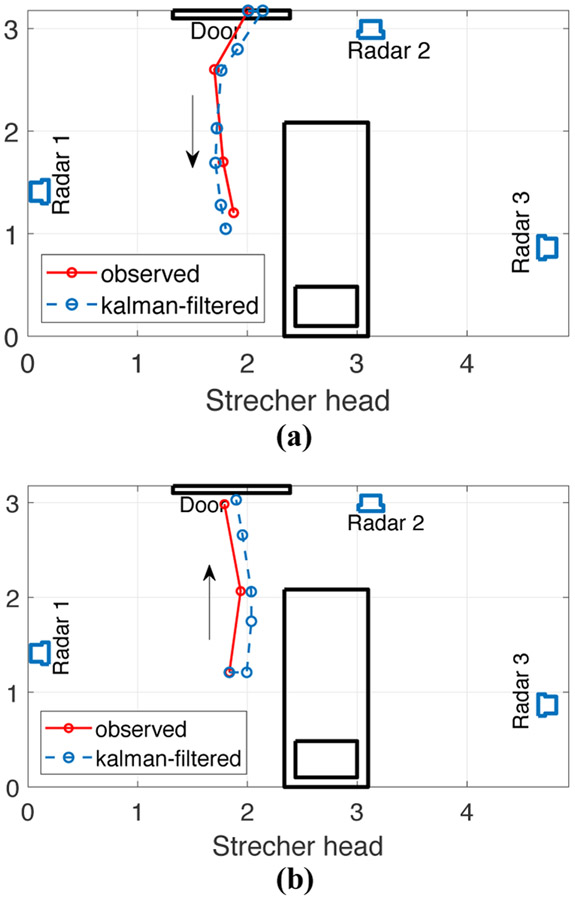
In the ED room we also successfully localized the entry and exit event of the second individual at the time instants which matched with the ground truth time. One of the events is illustrated in Fig. 4 where an ED doctor entered the ED room and left after some time. The ED room dimension for this case was 4.92m × 3.15m. The radar positions, stretcher position and the door location are drawn to scale. Fig. 4(a) shows an entry event whereas Fig. 4(b) illustrates an exit event. The red line indicates the ED doctor’s location estimated by the trilateration method and the blue line shows the location estimated by Kalman filtering.
Figure 4:
(a) Event: ED Doctor Entry at 14:51:41 hr (b) Event: ED Doctor Exit at 14:55:19 hr.
3.3. Respiratory Rate Estimation from Laboratory Data
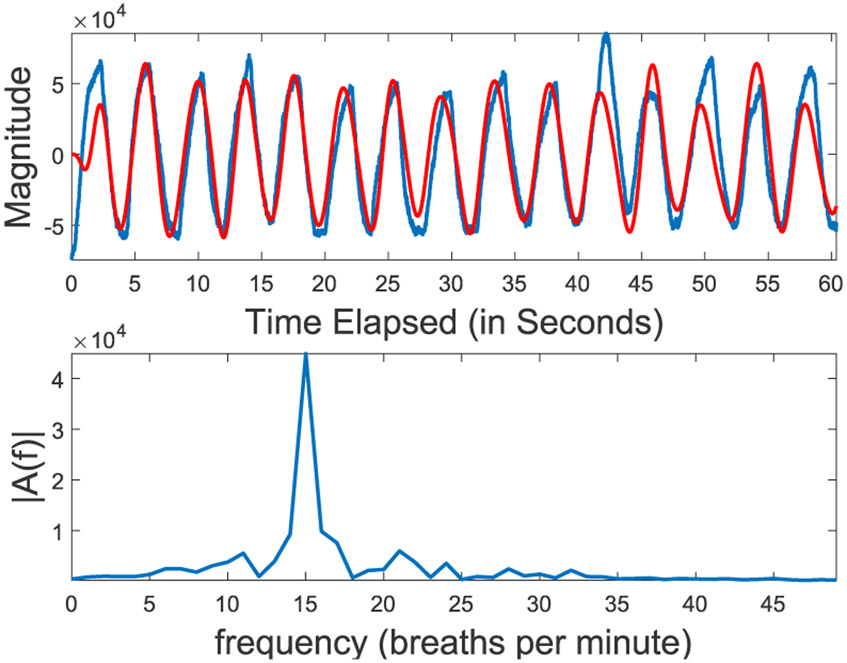
In the second phase of laboratory protocol we had a bed in the middle of the 4m × 4m room. The subject lay down on the bed on his back replicating an emergency room scenario. In the laboratory setting the signal is pure as the subject is mostly stationary and there are no second individuals in the picture. The purpose was to ensure our device and algorithm can pick up the RR signal in a pure setting. Four subjects participated in the laboratory respiratory rate estimation. A sample breathing signal captured by the radar and corresponding FFT are shown in Fig. 5. The result shown in this figure corresponds to the subject breathing in a rhythm of 15 breaths per minute in synchronization with the metronome count. The top figure illustrates the raw breathing signal in blue and the filtered signal is shown in red. The bottom figure shows the spectrum of the signal with a peak around 15 breaths per minute.
Figure 5:
(Top) Respiratory Signal captured by the radar module and (Bottom) Respiratory Rate extracted by FFT for Lab Subject 1 at metronome count 15 breaths per minute.
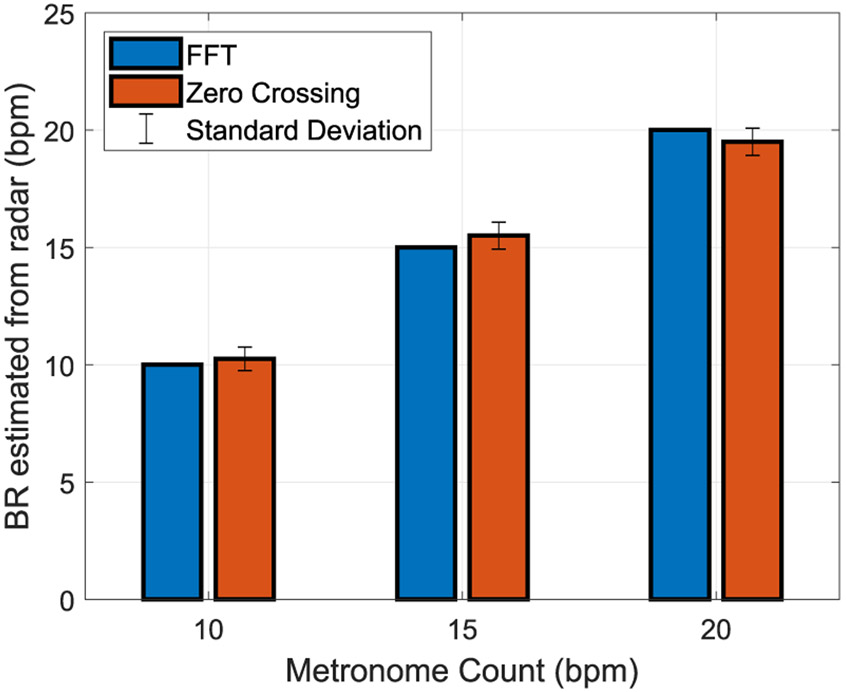
We performed both FFT and Zero crossing for all four subjects and for all breathing rates and the corresponding results are shown in Fig 6. From the figure it can be observed that the FFT has a better match with the ground truth than the zero-crossing algorithm.
Figure 6:
Estimated Respiratory Rate compared with corresponding metronome count over 4 subjects in Laboratory setting
3.4. Respiratory Rate Estimation ED Room Data:
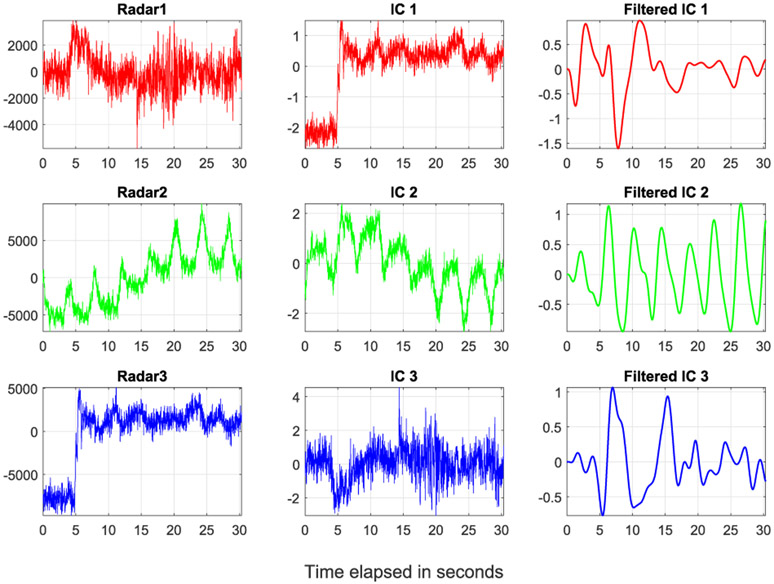
The independent component analysis takes the raw radar returns from all the three radars shown in the left column of Fig. 7 as input and outputs three independent components as illustrated in the middle column. A filtered version of the independent components is observed in the right most column. We observed that the ICA algorithm extracts a better breathing signal shown as the second independent out of noisy radar reflections. Now for the RR estimation only one independent component was chosen which results in the strongest FFT peak that contains more breathing information compared to the other two.
Figure 7:
Left Column: Raw radar returns from the radars, Middle Column: Independent components extracted from the three radar returns using ICA, Right Column: band pass filtered independent components
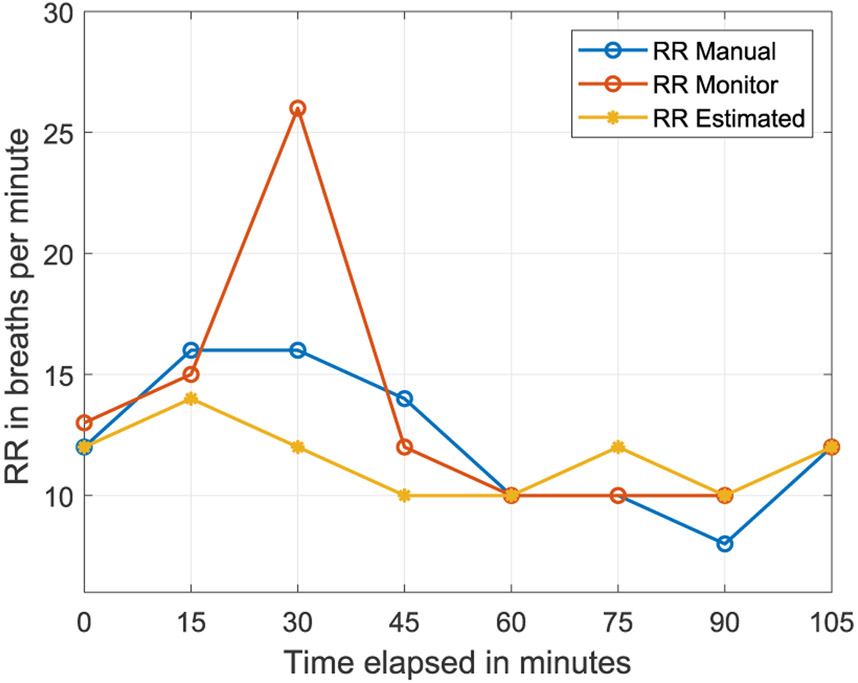
We compared the RR estimation results with the standard manual RR counting and the telemetry RR monitoring for the ED room sessions. Two subjects were enrolled. A sample of the results for ED subject 2 are reported in Fig. 8. The ground truth data (manual and telemetry monitor) were collected at 15-minute intervals. Therefore, we report out RR estimation matching the same time instants. However, we took the RR estimation for three consecutive minutes around each ground truth measurement to maintain the 30 second window size and 3 second window shift and report the average RR over all the windows. This mechanism helped us to generate a smoothened estimation for respiratory rates.
Figure 8:
ED Subject 2: Comparison of the RR estimation with the ground truth taken manually at 15 minutes intervals
The results for ED subject 2 shown in Fig. 8 are promising. The estimated rates follow the increasing trend like the manually counted RR and the RR from telemetry monitor in the early measurements. However, there is a large discrepancy observed in the manual RR and the monitor RR in the 3rd measurement at 30 minute, the estimated RR exhibit values close to the manual counting. The estimation also matches the decreasing trend in the middle and replicates the RR at the later measurements with a maximum error of 2 breaths per minute.
As the standard measurement procedures like manually counted RR and the telemetry monitored RR differ in values, we can conclude that our estimation algorithm does a fair job calculating the respiration rate as well as capturing the trend of RR variations over time.
4. Discussion
Overall, the contactless monitor has shown good correlation with respiratory rate in the laboratory setting and in multiple different subject positions, showing promise for the natural environment setting. The initial cases in the ED had good correlation with the ground truth, showing that the algorithm can work in a natural environment. This technology has potential applications in many clinical scenarios, such as monitoring high risk opioid users for overdose, people who suffer from pulmonary disease or sleep apnea, and infants at risk for apnea. The contactless monitor also has shown other unique findings, such as the ability to localize a subject’s movements throughout a room, which could be useful in its own regard.
There are several factors that may challenge our accuracy and will have to be monitored and accounted for. Motion artifact is known to affect respiratory rate monitoring. Further analysis will be aimed at evaluating the effect of motion by comparing accelerometry data from a simultaneously worn wrist sensor. Another possible challenge is observer interference. The observer stands very close to the patient in order to get the best manual respiratory rate, which could cause the radar to pick up on the observer respiratory rate given the close proximity of location. Narrowing the focus of the radar location being used to detect respiratory rate may help decrease the observer interference.
The ultrawide band monitor is not the first technology to be used for contactless vital sign monitoring. A recent study used sonar technology through a smart phone to identify respiratory depression and apnea in people who had overdosed. [18] While ultrasound technology was able to detect changes in respiratory rate, there are some limitations that can be overcome using the UWB technology. The main difference is that ultrasonic audio cannot penetrate through many objects, therefore, the monitor will need to have a reasonably direct line of sight of the target subject. The UWB technology uses electromagnetic wave in the microwave range. It can easily penetrate objects like clothes, wood, even walls (although wall might attenuate it significantly), therefore this technology should perform well in diverse living environments, with different sensor placements and subject locations, in multi-person settings and lastly with different postures, making it more applicable for use in a broad range of scenarios.
Other studies have utilized contactless radar monitors to detect respiratory rate in a sleep study lab. [19] They were performed with a small sample size and encountered similar difficulties that are known to exist with radar modules, which included movement and background noise interference that made the determination of contactless vital signs difficult. For this reason, the studies were performed on subjects that were stationary and in a direct line of site of the monitor. The ability of the UWB algorithm to localize the subject and be used with the patient in multiple positions and locations and in multiple-person scenarios will enable more practical use.
The UWB Respiratory Module could represent a noninvasive, simple, and accurate method to facilitate detection of subtle changes in clinical status. To move toward this goal, there are several future studies that will need to be performed. The first is to validate the device algorithm against telemetry respiratory rate monitoring and standard manual respiratory rate counting. Once validated, additional studies will be aimed at detecting changes in respiratory rates associated with therapeutic and adverse medication events. These studies will focus on patients at-risk for medication overdose, such as those with opioid use who are being monitored following an overdose or patients who are prescribed high-dose opioids for pain control. The ultimate goal is to deploy the device both inside and outside of hospital settings to help signal clinically concerning respiratory rate changes, such as bradypnea and periodic apnea, during opioid use.
4.1. Strengths and Limitations
As new technologies are being developed, it is important for them to be useful in real-life scenarios. The study is being performed in the ED, an extremely busy, chaotic environment, with severely ill patients requiring immediate interventions, diagnostic testing and procedures. Validating the device in this setting is difficult due to the large amount of movement and additional background noise that can affect the data. However, demonstrating accuracy of this algorithm in such an extreme environment will confirm its utility in a large variety of settings, both in and out of the hospital.
While preliminary data have been promising, there are some limitations. First, the study has a small sample size. In order to validate the technology, more subjects will need to be included to ensure that it holds true over a variety of subject types and subsets of disease. The future validation study will aim to recruit 52 subjects which will be powered to detect a difference in respiratory rate of two beats per minute. Additionally, the “gold standard” to which the device is being compared to have their own limitations- hence the critical need for this study. Manual respiratory counting requires that study personnel are directly observing the patient, which can distract the patient from their normal activity and thus change their respiratory pattern. The alternative comparison, telemetry monitoring, is also known to have inaccuracies.
5. Conclusion
Successful validation of our contactless sensor system for respiratory rate monitoring will create an innovative solution to help recognize, monitor, and treat patients with a variety of critical disease states. The ability to obtain objective data from a contactless sensor has multiple potential applications. This technology can be miniaturized to generate small devices for the home or mobile devices that will collect continuous data that can be accessed remotely. This information can be leveraged by clinicians to promote earlier recognition of critical starts (such as drug overdose) resulting in earlier intervention and improved patient outcomes.
7. Acknowledgements
Dr. Carreiro is funded by NIH/NIDA K23DA045242.
Contributor Information
Charlotte E. Goldfine, Division of Medical Toxicology Department of Emergency Medicine University of Massachusetts Medical School, Worcester, MA
Md. Farhan Tasnim Oshim, College of Information and Computer Sciences University of Massachusetts Amherst, Amherst, MA
Stephanie P. Carreiro, Division of Medical Toxicology Department of Emergency Medicine University of Massachusetts Medical School, Worcester, MA
Brittany P. Chapman, Division of Medical Toxicology Department of Emergency Medicine University of Massachusetts Medical School, Worcester, MA
Deepak Ganesan, College of Information and Computer Sciences University of Massachusetts Amherst, Amherst, MA.
Tauhidur Rahman, College of Information and Computer Sciences University of Massachusetts Amherst, Amherst, MA.
6. References
- [1].Khanna A, Overdyk J, Greening C et al. Respiratory depression in low acuity hospital settings- Seeking answers from the PRODIGY trial. Journal of Critical Care 47 (2018) 80–87. 10.1016/j.jcrc.2018.06.014 [DOI] [PubMed] [Google Scholar]
- [2].Fieselmann JF, Hendryx MS, Helms CM, et al. Respiratory rate predicts cardiopulmonary arrest for internal medicine patients. J Gen Intern Med 1993; 8: 354–360. [DOI] [PubMed] [Google Scholar]
- [3].Cretikos M Respiratory rate: the neglected vital sign.. The Medical journal of Australia. 2008-June;188:657–659. [DOI] [PubMed] [Google Scholar]
- [4].Hogan J Why don’t nurses monitor the respiratory rates of patients? British Journal of Nursing, 2006:15(9), 489–492. doi: 10.12968/bjon.2006.15.9.21087 [DOI] [PubMed] [Google Scholar]
- [5].Subbe C, & Kinsella S Continuous Monitoring of Respiratory Rate in Emergency Admissions: Evaluation of the RespiraSense™ Sensor in Acute Care Compared to the Industry Standard and Gold Standard. Sensors, 2018:18(8), 2700. doi: 10.3390/s18082700 [DOI] [PMC free article] [PubMed] [Google Scholar]
- [6].Kelley SD, & Ramsay MA Respiratory Rate Monitoring. Anesthesia & Analgesia, 2014: 119(6), 1246–1248. doi: 10.1213/ane.0000000000000454 [DOI] [PubMed] [Google Scholar]
- [7].Kohn S, et al. Monitoring the Respiratory Rate by Miniature Motion Sensors in Premature Infants: a Comparative Study. Journal of Perinatology, 36(2), 2015:116–120., doi: 10.1038/jp.2015.173. [DOI] [PubMed] [Google Scholar]
- [8].Zetik Rudolf, Crabbe Stephen, Krajnak Jozef, Peyerl Peter, Sachs Jürgen, and Thomä Reiner. “Detection and localization of persons behind obstacles using M-sequence through-the-wall radar”, In Sensors, and Command, Control, Communications, and Intelligence (C3I) Technologies for Homeland Security and Homeland Defense V, vol. 6201, p. 62010I. International Society for Optics and Photonics, 2006. [Google Scholar]
- [9].Tivive F, Bouzerdoum A, Amin MG, “An SVD-based Approach for Mitigating Wall Reflections in Through-the-Wall Radar Imaging,” IEEE Radar Conference, Kansas, MO, 2011, pp.519–524. [Google Scholar]
- [10].Abujarad F, Jostingmeier A, and Omar AS, “Clutterremoval for landmine using different signal processing techniques”, Proceedings of the Tenth IEEE International Conference on Ground Penetrating Radar, GPR 2004, 697–700, Jun. 2004. [Google Scholar]
- [11].Karlsen B, Larsen J, Sorensen HBD, and Jakobsen KB, “Comparison of PCA and ICA based clutter reduction in GPR systems for anti-personal land-mine detection”, Proceedings of the 11th IEEE Signal Processing Workshop on Statistical Signal Processing, 146–149, Aug. 2001. [Google Scholar]
- [12].Thomas F and Ros L, 2005. Revisiting trilateration for robot localization. IEEE Trans. Robot, 21: 93–101. [Google Scholar]
- [13].Welch G and Bishop G, “An introduction to the Kalman filter”, Technical Report Tr 95-041, University of North Carolina at Chapel Hill, Department of Computer Science, Chapel Hill, NC: 27599–3175, 2006. [Google Scholar]
- [14].Chui CK, Chen G, “Kalman Filtering with Real-Time Applications”, 4th ed. Springer; Berlin, Germany, 2009. pp. 108–129. [Google Scholar]
- [15].Julier SJ, Uhlmann JK “Unscented Filtering and Nonlinear Estimation”, Proc. IEEE 2004; 92:401–422 [Google Scholar]
- [16].Rauch HE, Tung F, and Striebel CT, “Maximum likelihood estimates of linear dynamic systems” AIAA J.,3, 1965, pp. 1445–1450. [Google Scholar]
- [17].Hyvärinen Aapo, Karhunen Juha, and Oja Erkki, “Independent component analysis”. Vol. 46. John Wiley & Sons. 2004. [Google Scholar]
- [18].Nandakumar R Gallakota S, and Sunshine JE. "Opioid overdose detection using smartphones.” Sci Transl Med 11(474). 2019. [DOI] [PubMed] [Google Scholar]
- [19].Tran VP, Al-Jumaily AA, Islam SMS. Doppler Radar-Based Non-Contact Health Monitoring for Obstructive Sleep Apnea Diagnosis: A Comprehensive Review. Big Data and Cognitive Computing. 2019;3(1). [Google Scholar]


